Automated Segmentation of CT Scans for Normal Pressure Hydrocephalus
Normal Pressure Hydrocephalus (NPH) is one of the few reversible forms of dementia, Due to their low cost and versatility, Computed Tomography (CT) scans have long been used as an aid to help diagnose intracerebral anomalies such as NPH. However, no …
Authors: Angela Zhang, Po-Yu Kao, Ronald Sahyouni
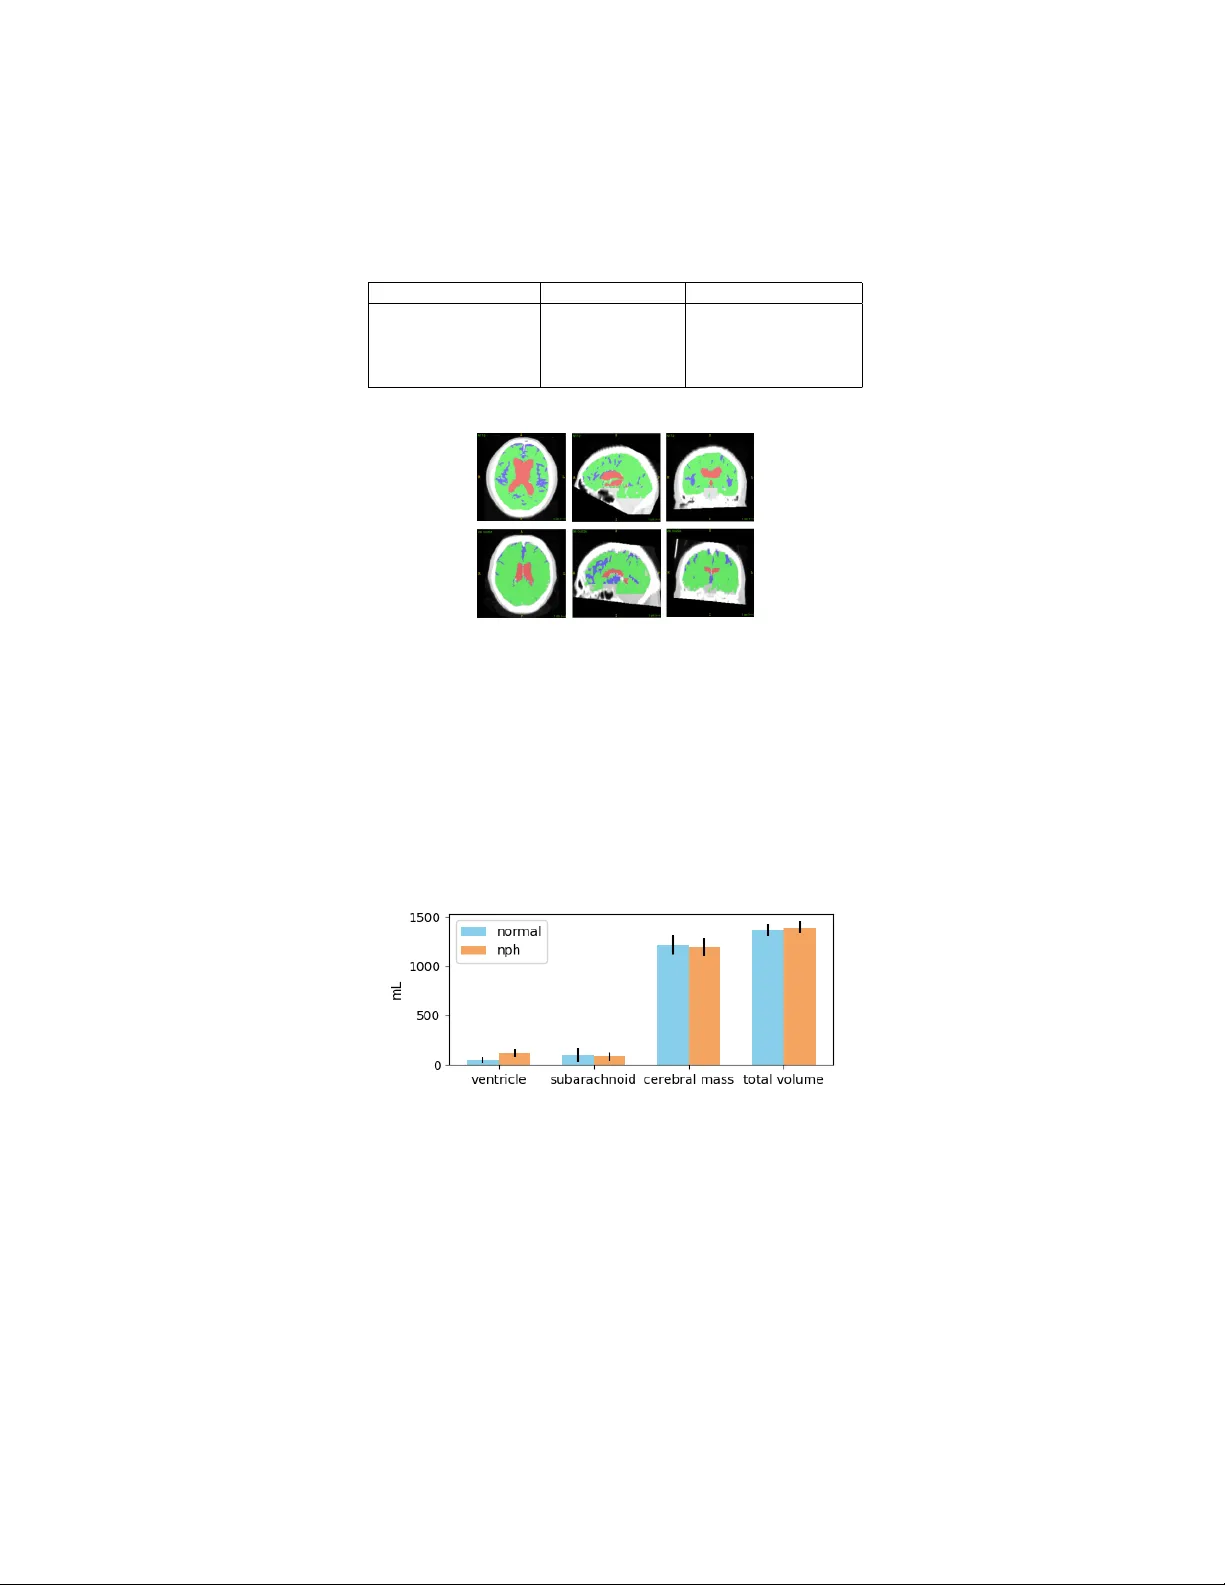
Automated Segmen tation of CT Scans for Normal Pressure Hydro cephalus ? Angela Zhang 1 , P o-yu Kao 1 , Ronald Sah youni 2 , Ash utosh Shelat 3 , Jefferson Chen 2 , and B.S. Manjunath 1 1 Univ ersity of California, Santa Barbara, Santa Barbara CA 93106, USA 2 Univ ersity of California, Irvine, Irvine CA 93106, USA 3 San ta Barbara Cottage Hospital, Santa Barbara CA 93106, USA angela00@ucsb.edu Abstract. Normal Pressure Hydro cephalus (NPH) is one of the few rev ersible forms of demen tia. Due to their low cost and versatilit y , Com- puted T omograph y (CT) scans hav e long b een used as an aid to help diagnose intracerebral anomalies suc h as NPH. How ever, no well-defined and effective protocol currently exists for the analysis of CT scan-based v entricular, cerebral mass and subarac hnoid space v olumes in the setting of NPH. The Ev ans ratio, an approximation of the ratio of ven tricle to brain volume using only one 2D slice of the scan, has been proposed but is not robust. Instead of manually measuring a 2-dimensional proxy for the ratio of v entricle volume to brain v olume, this study prop oses an automated metho d of calculating the brain v olumes for b etter recogni- tion of NPH from a radiological standp oin t. The metho d first aligns the sub ject CT v olume to a common space through an affine transformation, then uses a random forest classifier to mask relev ant tissue types. A 3D morphological segmentation metho d is used to partition the brain v ol- ume, which in turn is used to train mac hine learning metho ds to classify the sub jects into non-NPH vs. NPH based on volumetric information. The prop osed algorithm has increased sensitivit y compared to the Ev ans ratio thresholding metho d. Keyw ords: Normal Pressure Hydrocephalus · segmen tation · classifica- tion · machine learning · morphological contours. 1 In tro duction NPH presents as v entriculomegaly accompanied with symptoms of demen tia, sp ecifically cognitiv e dysfunction, changes in gait, and urinary incontinence [15]. It is estimated that more than 700,000 Americans hav e NPH. Due to the non- sp ecific and indolent nature of NPH, the ma jority of cases are under- or mis- diagnosed [8]. NPH is one of few reversible causes of dementia in the elderly , making correct diagnosis imp ortan t, as shun t placement has b een demonstrated to b e a safe and effective treatment [15]. ? This pap er was partially supported by the National Institutes of Health [grant n um- b er T32-GM08620]. 2 A. Zhang et al. Curren t diagnostic metho ds for NPH inv olve a mixture of clinical and imaging approac hes [15]. Although MRI v olumetric data may , in ideal cases, provide b etter detail of the b orders of the ven tricles than standard CT imaging, shorter acquisition time, use for follo w-up, and the sheer num b er of data p oin ts are some adv antages of CT imaging in understanding and classifying NPH on a broad scale. The curren t metho ds av ailable for analyzing brain scans for p ossible NPH, suc h as finding the Ev ans ratio, are time-intensiv e, manual, and prone to er- ror [17]. Ev ans index is the ratio of the transverse diameter of the anterior horns of the lateral ven tricles to the greatest internal diameter of the skull in a single slice of a 3D v olume. This is illustrated in Figure 1. Fig. 1. Illustration of Ev ans ratio method. The ratio takes the length of the widest part of the frontal horns (line A) ov er the length of the widest part of the inner skull (line B). The lo cation of the slice in the z dimension is the lo cation where the parietal lob e app ears to b e widest. Curren t guidelines state that an Ev ans index of greater than 0.3 indicates NPH. Ho wev er, recent findings hav e shown that the Ev ans ratio in fact v aries greatly dep ending on the level (slice lo cation) of the brain CT scan image at whic h the frontal horns and maximal inner skull diameters are measured [17]. A 3-dimensional, volumetric method of measuring the relev an t regions of the brain could help to mitigate these c hallenges and holds promise for improving NPH differen tial diagnosis [12]. While there are metho ds to obtain ven tricle and cerebral mass v olumes in MRI, these metho ds cannot find the subarachnoid space, as it do es not show up in MRI. The metho d detailed in [7] automatically detects features of dispro- p ortionately enlarged subarachnoid space h ydro cephalus in MRI. [5] uses exp ert priors to aid in patch based segmen tation of the lateral ven tricles in MRI. In [19], automated ven tricular v olume measurement in MRI is implemented through the P A CS system. The pap er claims feasibility in CT, but do es not discuss NPH. Another metho d of lateral v entricle segmen tation in MRI is presented in [11]. The authors in [14] explore challenges in ven tricle segmentation using neural net works in MRI. An automated metho d of computing the Ev ans ratio from CT is presented in [16], but this metho d loses the v olumetric adv an tage of directly computing the v olumes from CT scans. This paper proposes a no v el metho d to automatically classify in 3 dimensions the lateral ven tricles, cerebral mass, and subarachnoid space from CT scans and use these volumes to predict p ossible NPH. The prop osed metho d has improv ed p erformance compared to the Ev ans Ratio, whic h can be used as an aid in screening for p oten tial NPH in sub jects who might otherwise b e misdiagnosed. Automated Segmentation of CT Scans for Normal Pressure Hydrocephalus 3 2 Metho ds and Materials 2.1 Data The sub ject data comes from tw o sources: the Universit y of California Irvine Medical Center (UCI) and the Santa Barbara Cottage Hospital. This is a retro- sp ectiv e study , with all images de-identified as specified by the IRB agreemen t b et w een each medical center and the Univ ersity of California, Santa Barbara. There w as no protocol determining the num ber of slices, orien tation, or other imaging parameters for the data used in this study . CT scans of 61 sub jects from [Hospital 1 and Hospital 2] the Universit y of California, Irvine and Santa Barbara Cottage Hospital w ere included in the study , with 34 sub jects having a diagnosis of normal and 27 sub jects ha ving a diagnosis of NPH. Scans were acquired as part of the treatment pro cess, and the num b er of slices v aried from 25 to 207. F or the sub jects from UCI, the av erage sub ject age is 75 ± 15 years. F or the sub jects from Cottage Hospital, the av erage age of the sub jects is 72 ± 14 years. 30 man ual segmentations were p erformed by members of the research team under direct sup ervision and v alidation by a neurological surgeon. The Ev ans ratio, as measured by or under direct sup ervision of a neurological surgeon, was measured for all sub jects. 2.2 Algorithm Overview There are several ma jor steps inv olv ed in the proposed metho d for NPH predic- tion, as sho wn in Figure 2. The implemen tation details and co de to the algorithm is a v ailable at https://github.com/UCSB-VRL/NPH\_Prediction. Fig. 2. W orkflow of automatic classification algorithm. F rom left to right, 1) the orig- inal volumetric image. 2) An affine transform is computed to register the v olume to a template. 3) RF is used to classify the types of tissue in the volume. 4) Segmen tation of v entricle and cerebral mass. 5) P ost pro cessing, segmen tation of subarac hnoid space. Best viewed on screen/in color. V oxel-wise Classification 4 A. Zhang et al. Pr epr o c essing First, the skull of each scan is extracted using thresholding. The skull v olume is used to compute an affine transformation with the standard MRI in MNI152 space [9]. The MNI152 space is a 3-dimensional coordinate system for stereotactic lo calization in neurosurgery made from the a v erage MRI of 152 scans from the Mon treal Neurological Institute of McGill Univ ersity Health Centre [6]. The computed affine transform is then applied to its corresp onding CT scan. Denoising is applied [2]. Tissue Classific ation The registered scans are used to train a random forest classifier [13] [1] on a small subset of lab eled data ( ∼ 10,000 vo xels) to recognize the intensit y v alues of 3 differen t tissue types - cerebrospinal fluid (CSF), cere- bral mass, and skull. The classifier then aggregates the votes from the different decision trees to decide the final class of the v oxel. There are 4 classes total, including the background class. The trained classifier is then used to classify eac h vo xel of every scan. The trained random forest classifier is used to select relev ant regions of the v olume and mask the other regions based on tissue type. V entricle / Cer ebr al Mass Se gmentation Each masked volume of the CSF is then seeded at the cen ter of the anatomical ven tricular region based on anatomical prior knowledge of the av erage ven tricle lo cation in MNI152 space. The seeds are then grown using the 3-dimensional Morphological Chan-V ese (MCV) algo- rithm [3] [18]. This algorithm is a lev el set evolution algorithm with the goal of minimizing the energy function defined b y: F = µ × S ur f aceAr ea ( C ) + v × V ol ume ( I nside ( C ))+ λ 1 Z I nside ( C ) | u 0 ( x, y , z ) − c 1 | 2 dxdy dz + λ 2 Z Outside ( C ) | u 0 ( x, y , z ) − c 2 | 2 dxdy dz , where u 0 ( x, y , z ) is the volumetric image, λ 1 , λ 2 > 0 are parameters that can ad- just the comparisons b et ween a verage intensit y inside and outside of 3-dimensional surface contour C ( c 1 and c 2, resp ectiv ely), and µ 1 > 0 is a regularizing param- eter to promote ev olution. Lik ewise, each masked volume of the cerebral mass is seeded at three p oints: on the top, back, and fron t of the head next to the skull. The b oundaries are then found using the MCV algorithm. Because the v en tricular space is separate from the subarac hnoid space in terms of fluid flo w, this method allows for the separation of the t w o, even though their tissue classes are the same from the random forest classifier. Post Pr o c essing / Sub ar achnoid Sp ac e L ab eling F ollowing segmentation of the lateral ven tricles and cerebral mass, the remaining v oxels (classified as fluid) are labeled as subarachnoid space. The volumes of eac h class are computed b y multiplying the total num ber of lab eled vo xels with the 3D v oxel spacing information in the metadata of the scan. T o return the segmen tation to the original patien t space for purp oses of visualisation and segmen tation v erification, the in verse affine transform from the Automated Segmentation of CT Scans for Normal Pressure Hydrocephalus 5 MNI152 space to the patient space was computed and applied to the automatic segmen tation using nearest neigh b or in terp olation. Eac h automatic segmen tation w as then compared to its corresp onding manual segmentation in the original patien t space. The segmen tations performed b y the algorithm are compared with 30 manual segmentations of 9 sub jects p erformed by members of the research team under the direct sup ervision of a neurological surgeon. Comp arison with other metho ds Some basic machine learning metho ds are im- plemen ted to compare with the prop osed metho d. Some of these metho ds are used as one step in our metho d. They include random forest classification, 3D morphological geo desic active contours (MGAC), and 3D morphological Chan- V ese (MCV). The implemen tation of the alternativ e metho ds of v entricle segmen tation use thresholding to find the skull region and remov e any lab els outside of this re- gion. All implementations first compute and apply the affine transformations in to MNI152 space, then computes and applies the in verse transformation after completing segmentation. F or the morphological chan-v ese and morphological geo desic active contour metho ds, the volumes are seeded in the same manner as the prop osed algorithm. The regions are then grown according to their p ersp ec- tiv e algorithms. Finally , the regions inside the skull not lab eled as cerebral mass are then lab eled as ven tricular space. NPH Prediction A Supp ort V ector Mac hine (SVM) [4] with a radial basis function (RBF) kernel and a Random F orest (RF) classifier are trained and tested on the v olumetric information obtained from the segmentation algorithm. T o account for v ariability in brain size, the total brain volume is calculated b y adding the ven tricle, cerebral mass, and subarac hnoid space volumes. The v entricle, cerebral mass, subarachnoid space, and total brain volumes are used as input features to train a rbf SVM and a random forest classifier. Stratified k- fold cross-v alidation was used to create training and v alidation datasets. F or eac h metho d, 100 classifiers are trained to obtain an av erage and standard deviation for classifier p erformance. F or comparison, each scan is also lab eled with the Ev ans ratio as measured under direct sup ervision of a neurological surgeon. NPH prediction on the lab eled subset using only the Ev ans ratio are first computed by the curren t guidelines, with sub jects having an Ev ans ratio greater than or equal to 0.3 classified as NPH, and the remaining sub jects classified as non-NPH. 3 Results 3.1 Classification V alidation and Comparison F or the scores in T able 1, the Dice Score, 2 | X ∩ Y | | X | + | Y | = 2 T P 2 T P + F P + F N , where X and Y are tw o classes (p ositiv e and negative for each class), is used. It is imp ortant to note that the prop osed metho d is unique in that it allows for separation of v en tricle space and subarac hnoid space, due to the com bination 6 A. Zhang et al. T able 1. Comparison of Dice Scores for v arious ven tricle and cerebral mass segmen- tation algorithms for CT scans. The scores are rep orted as mean standard deviation. Metho d V en tricle (Dice) Cerebral Mass (Dice) Prop osed Metho d 85.31 ± 6.16 % 91.03 ± 2.38 % Random F orest 57.34 ± 16.52 % 88.16 ± 3.19 % 3D MGAC 20.51 ± 19.87 % 84.68 ± 9.13 % 3D MCV 15.05 ± 18.36 % 85.71 ± 3.65 % Fig. 3. Example segmentations generated b y our algorithm. The first (top) set of im- ages consists of cross sections of a sub ject diagnosed with NPH and the second (b ottom) set of images are cross sections of a normal sub ject. Best viewed in color. of prior anatomical knowledge, intensit y-based tissue classifier, and level set ev olution. h ttps://www.ov erleaf.com/pro ject/5d003ecae4b5f6444959e88f Fig. 4. Mean and standard deviation of ven tricle, subarachnoid, cerebral mass, and total volumes. Figure 4 and T able 2 sho w that the ven tricles volumes are greater for NPH, as exp ected. The subarachnoid space is mostly consisten t across sub jects. The cerebral mass volumes roughly inv ersely corresp ond to ven tricle volume. The v entricular volumes of normal sub jects are consistent with the a verage MRI- deriv ed ven tricular volumes in the age range of 69.5 ± 4.8 years [10]. Automated Segmentation of CT Scans for Normal Pressure Hydrocephalus 7 T able 2. Mean and standard deviation of ven tricular and cerebral mass volumes. V en tricle Subarac hnoid Cerebral Mass Normal 47.4 ± 28.2 mL 101.6 ± 69.7 mL 1214.6 ± 100.6 mL NPH 118.0 ± 41.2 mL 85.2 ± 44.3 mL 1210.2 ± 95.6 mL Fig. 5. Box-and-whisk er plots showing the significance of each feature for the RBF SVM mo del. It is evident that the v entricular volume is the most imp or- tan t feature, which follows exp ectation. T able 3. NPH prediction scores using all volume information for SVM and RF classi- fiers compared with Ev an’s Index thresholding. The train/test split is 50/11. Sensitivit y (T rain/T est) Sp ecificit y (T rain/T est) Ev ans Index, Thresholding 75% (all data) 89% (all data) V ol. F eatures, RBF SVM 90 ± 5 / 86 ± 13% 89 ± 3 / 85 ± 10% V ol. F eatures, RF 99 ± 2 / 86 ± 14% 96 ± 2 / 84 ± 10% 3.2 Diagnosis Scores and Comparison with Ev ans Ratio The SVM with RBF k ernel used parameters C=2, gamma=0.1. The RF classifier used 200 estimators, had a minimum sample split of 3, gini criterion, max depth of 4, and max features of 2. As seen in T able 3, the SVM had the b est p erformance in NPH sensitivity , but sligh tly low er sp ecificit y than Ev an’s index. F rom Figure 5, all of the v olumetric information w as used by the SVM to predict p ossible NPH. 4 Discussion and F uture W ork The pap er presen ts a fully automated, volumetric metho d of lateral ven tricles, subarac hnoid space and cerebral mass segmentation in CT scans. Additionally , this pap er prop oses a fully automated, volumetric metho d to predict NPH di- agnosis, which in conjunction with the clinical s ymptomatology , can facilitate the diagnosis of NPH and rule-out sub jects who do not meet the radiographic criteria of an NPH diagnosis. This technological system outp erforms the thresh- olding metho d using Ev ans ratio and can b e used as a screening to ol to iden tify or stratify p ossible NPH cases in a clinical setting. The w ork presented in this pap er is intended as a pro of of concept, with represen tative samples of CT scans from sub jects in each category . In order to ac hieve more robust classification and higher mo del scores, we plan to collect a greater n umber of samples ov er time. Additionally , it may be b eneficial to explore the com bination of MRI and CT scans to create a multimodal metho d for more fine-tuned diagnosis as well as for 8 A. Zhang et al. symptoms and treatment outcome prediction. This algorithm could b e further refined b y incorp orating relev ant demographic and medical v ariables. References 1. B reiman, Leo. 2001. Random F orests. Machine Learning 45 (1): 532. 2. B uades, A., Coll. B., and Morel, J. 2011. Non-Local Means Denoising. Image Pro- cessing On Line 1: 20812. 3. Chan, T. and V ese, L.. 2001. Active Contours without Edges. IEEE T ransactions on Image Processing: A Publication of the IEEE Signal Pro cessing So ciet y 10 (2): 26677. 4. Cortes, C., and V apnik, V. 1995. Supp ort V ector Mac hine. Machine Learning 20 (3): 27397. 5. Coup´ e, P . et al. 2011. Patc h-Based Segmentation Using Exp ert Priors: Application to Hipp ocampus and V entricle Segmentation. NeuroImage 54 (2): 94054. 6. Grabner, G. et al. 2006. Symmetric Atlasing and Mo del Based Segmentation: An Application to the Hipp o campus in Older Adults. MICCAI 9 (Pt 2): 5866. 7. Gunter, N. et al. 2018. Automated Detection of Imaging F eatures of Disprop ortion- ately Enlarged Subarachnoid Space Hydro cephalus Using Machine Learning Meth- o ds. NeuroImage. Clinical, No vem b er. 8. Jara j, D. et al. 2014. Prev alence of Idiopathic Normal-Pressure Hydro cephalus. Neu- rology 82 (16): 144954. 9. Jenkinson, M. et al. 2012. FSL. NeuroImage 62 (2): 78290. 10. Jovicic h, J. et al. 2009. MRI-Derived Measurements of Human Sub cortical, V en- tricular and In tracranial Brain V olumes: Reliability Effects of Scan Sessions, Ac- quisition Sequences, Data Analyses, Scanner Upgrade, Scanner V endors and Field Strengths. NeuroImage 46 (1): 17792. 11. Kobashi, S. et al. 2001. F uzzy Medical Image Processing for Segmenting the Lateral V en tricles from MR Images. In Proceedings 2001 In ternational Conference on Image Pro cessing (Cat. No.01CH37205), 3:109598 vol.3. 12. Mo ore, D. et al. 2012. A Pilot Study of Quan titative MRI Measuremen ts of V entric- ular V olume and Cortical Atroph y for the Differential Diagnosis of Normal Pressure Hydro cephalus. Neurology Research International 2012: 718150. 13. Pedregosa, F. et al. 2011. Scikit-Learn: Machine Learning in Python. Journal of Mac hine Learning Research: JMLR 12 (Oct): 282530. 14. Shao, M., et al. 2018. Shortcomings of V entricle Segmentation Using Deep Conv o- lutional Netw orks. In Understanding and Interpreting Machine Learning in Medical Image Computing Applications, 11038:7986. 15. Shprecher, D., Sch walb, J., and Kurlan, R. 2008. Normal Pressure Hydro cephalus: Diagnosis and T reatment. Current Neurology and Neuroscience Rep orts 8 (5): 37176. 16. T ak ahashi, N., et al. 2017. Automated Metho d to Compute Ev ans Index for Diag- nosis of Idiopathic Normal Pressure Hydro cephalus on Brain CT Images. In Medical Imaging 2017: Computer-Aided Diagnosis, 10134:101342C. In ternational Society for Optics and Photonics. 17. T oma, A. et al. 2011. Ev ans Index Revisited: The Need for an Alternativ e in Normal Pressure Hydro cephalus. Neurosurgery 68 (4): 93944. 18. W alt, S. et al., and scikit-image contributors. 2014. Scikit-Image: Image Pro cessing in Python. PeerJ 2 (June): e453. 19. Y epes-Calderon, F., Nelson, M., and McCom b, J. 2018. Automatically Measuring Brain V en tricular V olume within P ACS Using Artificial Intelligence. PloS One 13 (3): e0193152.
Original Paper
Loading high-quality paper...
Comments & Academic Discussion
Loading comments...
Leave a Comment