Polyphonic Sound Event Detection by using Capsule Neural Networks
Artificial sound event detection (SED) has the aim to mimic the human ability to perceive and understand what is happening in the surroundings. Nowadays, Deep Learning offers valuable techniques for this goal such as Convolutional Neural Networks (CN…
Authors: Fabio Vesperini, Leonardo Gabrielli, Emanuele Principi
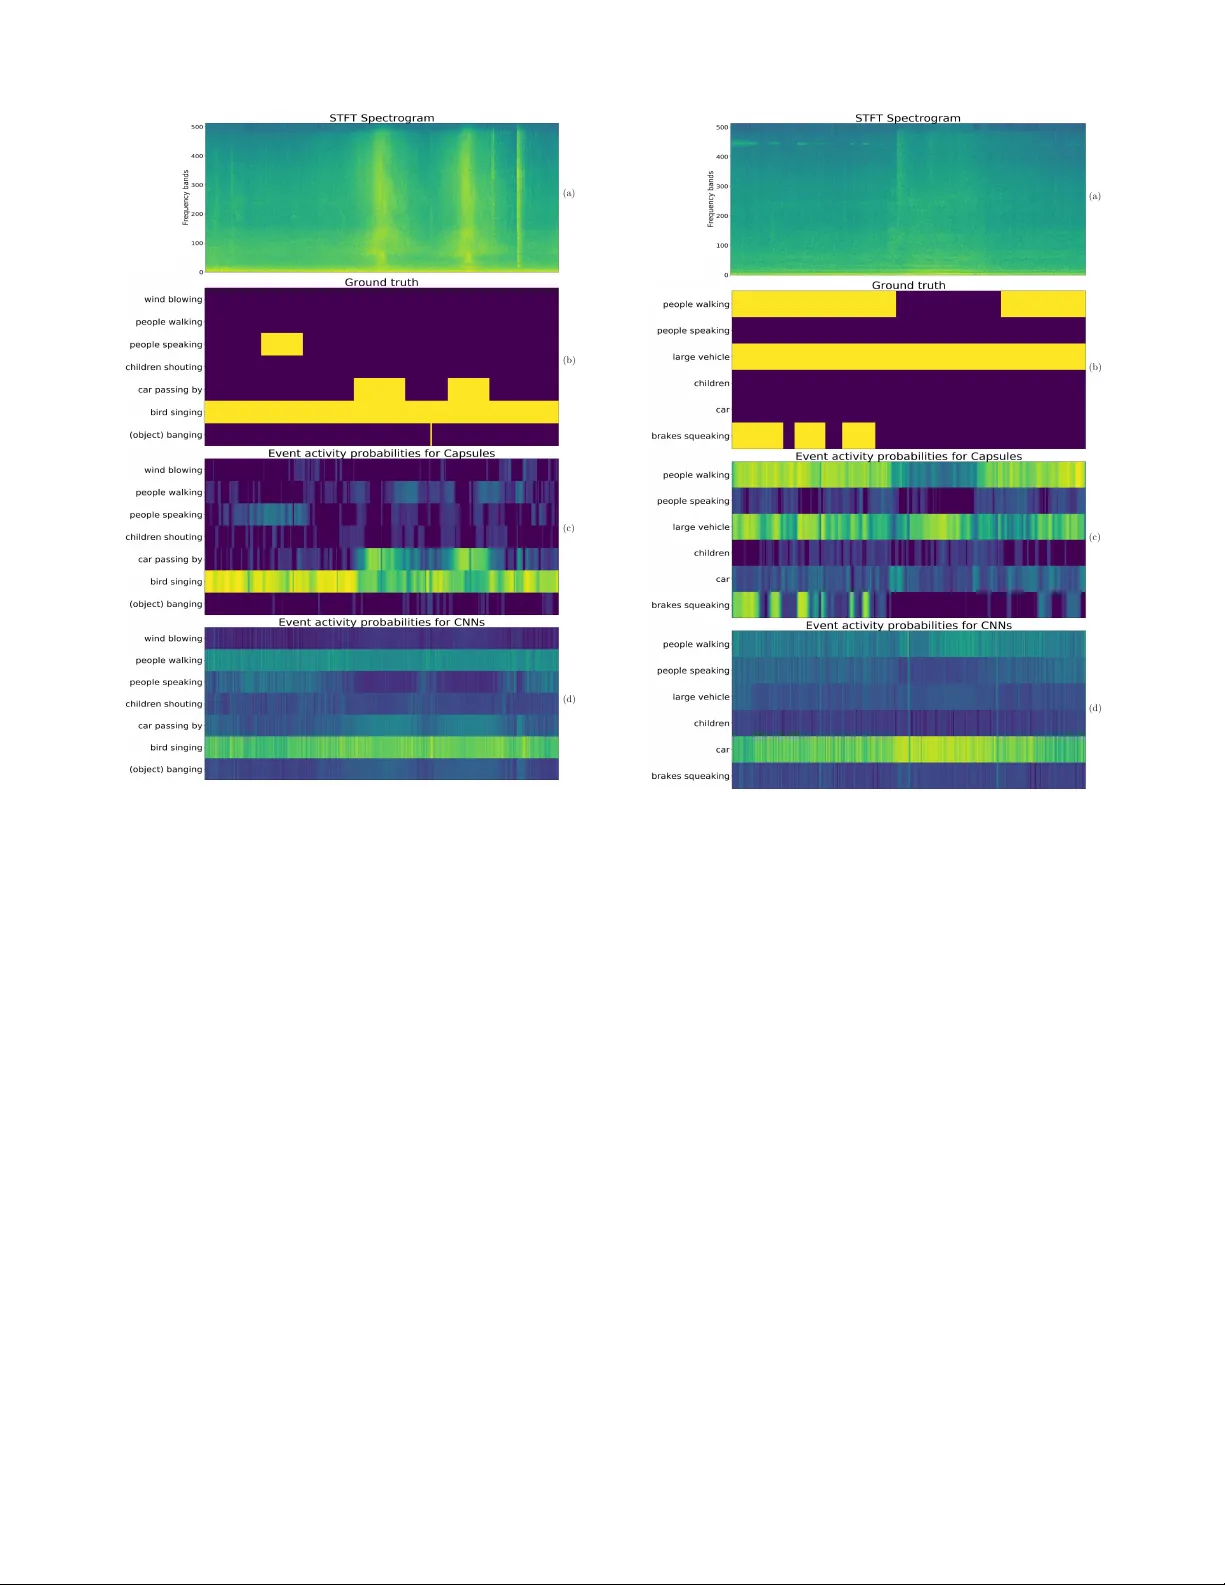
JOURNAL OF SELECTED TOPICS IN SIGN AL PROCESSING, VOL. X, NO. X, OCTOBER 2018 1 Polyphonic Sound Ev ent Detection by using Capsule Neural Networks Fabio V esperini ∗ , Leonardo Gabrielli, Emanuele Principi, and Stefano Squartini, Senior Member , IEEE Abstract —Artificial sound event detection (SED) has the aim to mimic the human ability to percei ve and understand what is happening in the surroundings. No wadays, learning offers valuable techniques for this goal such as con volutional neural networks (CNNs). The capsule neural network (CapsNet) archi- tecture has been recently introduced in the image processing field with the intent to over come some of the kno wn limitations of CNNs, specifically regarding the scarce robustness to affine transformations (i.e., perspective, size, orientation) and the detec- tion of o verlapped images. This motiv ated the authors to employ CapsNets to deal with the polyphonic SED task, in which multiple sound ev ents occur simultaneously . Specifically , we propose to exploit the capsule units to repr esent a set of distinctiv e properties for each individual sound event. Capsule units are connected through a so-called dynamic routing that encourages learning part-whole relationships and improv es the detection performance in a polyphonic context. This paper reports extensive ev aluations carried out on three publicly a vailable datasets, showing how the CapsNet-based algorithm not only outperforms standard CNNs but also allows to achieve the best results with respect to the state-of-the-art algorithms. Index T erms —Capsule Neural Networks, Con volutional Neural Network, Polyphonic Sound Event Detection, DCASE, Compu- tational A udio Processing I . I N T R O D U C T I O N H UMAN cognition relies on the ability to sense, process, and understand the surrounding en vironment and its sounds. Although the skill of listening and understanding their origin is so natural for li ving beings, it still results in a very challenging task for computers. Sound ev ent detection (SED), or acoustic event detection, has the aim to mimic this cognitiv e feature by means of artificial systems. Basically , a SED algorithm is designed to detect the onset and offset times for a v ariety of sound ev ents captured in an audio recording and associate a textual descriptor , i.e., a label for each of these events. In recent years, SED has recei ved significant interest from the computational auditory scene analysis community [1], due to its potential in several engineering applications. Indeed, the automatic recognition of sound ev ents and scenes can hav e a considerable impact in a wide range of applications where sound or sound sensing is adv antageous with respect to other modalities. This is the case of acoustic surveillance [2], healthcare monitoring [3], [4] or urban sound analysis [5], where the short duration of certain ev ents (i.e., a human fall, a gunshot or a glass breaking) or the personal priv acy ∗ Corresponding author . The authors are with the A3lab, Department of Information Engineering, Univ ersit ` a Politecnica delle Marche, Ancona (Italy), E-mail: f.vesperini@pm.uni vpm.it, { l.gabrielli,e.principi,s.squartini } @univpm.it motiv ate the exploitation of audio information rather than, e.g., image processing. In addition, audio processing is often less computationally demanding compared to other multimedia domains, thus embedded devices can be easily equipped with microphones and sufficient computational capacity to locally process the signal captured. These could be smart home devices for home automation purposes or sensors for wildlife and biodi versity monitoring (i.e., bird calls detection [6]). SED algorithms in a real-life scenario f ace man y chal- lenges. These include the presence of simultaneous events, en vironmental noise and ev ents of the same class produced by different sources [7]. Since multiple e vents are v ery likely to ov erlap, a polyphonic SED algorithm, i.e., an algorithm able to detect multiple simultaneous e vents, needs to be designed. Finally , the effects of noise and intra-class variability represent further challenges for SED in real-life situations. T raditionally , polyphonic acoustic event analysis has been approached with statistical modelling methods, including hid- den Markov models (HMM) [8], Gaussian mixture models (GMM) [9], non-negativ e matrix Factorization (NMF) [10] and support vector machines (SVM) [11]. In the recent era of “deep learning”, different neural network architectures hav e been successfully used for sound event detection and classi- fication tasks, including feed-forward neural netw orks (FNN) [12], deep belief networks [13], con volutional neural networks (CNNs) [14] and recurrent neural networks (RNNs) [15]. In addition, these architectures laid the foundation for end-to-end systems [16], [17], in which the feature representation of the audio input is automatically learnt from the raw audio signal wa veforms. A. Related W orks The use of deep learning models has been motiv ated by the increased av ailability of datasets and computational resources and resulted in significant performance improv ements. The methods based on CNNs and RNNs ha ve established the new state-of-the-art performance on the SED task, thanks to the capabilities to learn the non-linear relationship between time- frequency features of the audio signal and a target v ector representing sound e vents. In [18], the authors show how “local” patterns can be learned by a CNN and can be exploited to impro ve the performance of detection and classification of non-speech acoustic ev ents occurring in con versation scenes, in particular compared to a FNN-based system which pro- cesses multiple resolution spectrograms in parallel. The combination of the CNN structure with recurrent units has increased the detection performance by taking advantage JOURNAL OF SELECTED TOPICS IN SIGN AL PROCESSING, VOL. X, NO. X, OCTOBER 2018 2 of the characteristics of each architecture. This is the case of con volutional recurrent neural networks (CRNNs) [19], which provided state-of-the-art performance especially in the case of polyphonic SED. CRNNs consolidate the CNN property of local shift in variance with the capability to model short- and long-term temporal dependencies provided by the RNN layers. This architecture has been also employed in almost all of the most performing algorithms proposed in the recent editions of research challenges such as the IEEE Audio and Acoustic Signal Processing (AASP) Challenge on Detection and Classification of Acoustic Scenes and Events (DCASE) [20]. On the other hand, if the datasets are not sufficiently large, problems such as overfitting can be encountered with these models, which typically are composed of a considerable number of free-parameters (i.e., more than 1M). Encouraging polyphonic SED performance has been ob- tained using CapsNets in preliminary experiments conducted on the Bird Audio Detection task in occasion of the DCASE 2018 challenge [21], confirmed by the results reported in [22]. The CapsNet [23] is a recently proposed architecture for image classification and it is based on the grouping of activ ation units into novel structures introduced in [24], named capsules , along with a procedure called dynamic routing. The capsule has been designed to represent a set of properties for an entity of interest, while dynamic routing is included to allow the network to implicitly learn global coherence and to identify part-whole relationships between capsules. The authors of [23] show that CapsNets outperform state- of-the-art approaches based on CNNs for digit recognition in the MNIST dataset case study . They designed the CapsNet to learn how to assign the suited partial information to the entities that the neural network has to predict in the final classification. This property should ov ercome the limitations of solutions such as max-pooling, currently emplo yed in CNNs to provide local translation in variance, b ut often reported to cause an excessiv e information loss. Theoretically , the introduction of the dynamic routing can supply inv ariances for any property captured by a capsule, allowing also to adequately train the model without requiring extensiv e data augmentation or dedicated domain adaptation procedures. B. Contribution The proposed system is a fully data-dri ven approach based on the CapsNet deep neural architecture presented by Sabour et al. [23]. This architecture has shown promising results on the classification of highly ov erlapped digit images. In the audio field, a similar condition can be found in the detection of multiple concomitant sound ev ents from acoustic spectral representations, thereby we propose to employ the CapsNet for polyphonic SED in real-life recordings. The novel computational structure based on capsules, combined with the routing mechanism, allows to be in variant to intra-class affine transformations and to identify part-whole relationships between data features. In the SED case study , it is hypothe- sized that this characteristic confers to CapsNet the ability to effecti vely select most representativ e spectral features of each individual sound e vent and separate them from overlapped descriptions of the other sounds in the mixture. This hypothesis is supported by pre viously mentioned re- lated w orks. Specifically , in [21], the CapsNet is exploited in order to obtain the prediction of the presence of heterogeneous polyphonic sounds (i.e., bird calls) on unseen audio files recorded in various conditions. In [22], the authors proposed a CapsNet for sound e vent detection that uses gated con volutions in the initial layers of the network, and an attention layer that operates in parallel with the final capsule layer . The outputs of the two layers are merged and used to obtain the final prediction. The algorithm is ev aluated on the weakly-labeled dataset of the DCASE 2017 challenge [25] with promising results. In [26], capsule netw orks ha ve been applied to a speech command recognition task, and the authors obtained a significant performance improvement with respect to CNNs. In this paper, we present an extensiv e analysis of SED conducted on real-life audio datasets and compare the results with state-of-the-art methods. In addition, we propose a v ariant of the dynamic routing procedure which takes into account the temporal dependence of adjacent frames. The proposed method outperforms pre vious SED approaches in terms of detection error rate in the case of polyphonic SED, while it has comparable performance with respect to CNNs in the case of monophonic SED. The whole system is composed of a feature extraction stage and a detection stage. The feature extraction stage transforms the audio signal into acoustic spectral features, while the sec- ond stage processes these features to detect the onset and offset times of specific sound events. In this latter stage we include the capsule units. The network parameters are obtained by supervised learning using annotations of sound e vents activity as tar get vectors. W e have ev aluated the proposed method against three datasets of real-life recordings and we hav e compared its performance both with the results of experiments with a traditional CNN architecture, and with the performance of well-established algorithms which have been assessed on the same datasets. The rest of the paper is or ganized as follows. In Section II the task of polyphonic SED is formally described and the stages of the approach we propose are detailed, including a presentation of the CapsNet architecture characteristics. In Section III, we present the ev aluation set-up used to accom- plish the performance of the algorithm we propose and the comparativ e methods. In Section IV the results of experiments are discussed and compared with baseline methods. Section V finally presents our conclusions for this w ork. I I . P R O P O S E D M E T H O D The aim of polyphonic SED is to find and classify the sound events present in an audio signal. The algorithm we propose is composed of two main stages: sound representation and polyphonic detection. In the sound representation stage, the audio signal is transformed in a two-dimensional time- frequency representation to obtain, for each frame t of the audio signal, a feature vector x t ∈ R F , where F represents the number of frequency bands. Sound e vents possess temporal characteristics that can be exploited for SED, thus certain events can be efficiently JOURNAL OF SELECTED TOPICS IN SIGN AL PROCESSING, VOL. X, NO. X, OCTOBER 2018 3 distinguished by their time ev olution. Impulsi ve sounds are extremely compact in time (e.g., gunshot, object impact), while other sound e vents ha ve indefinite length (i.e., wind blowing, people walking). Other ev ents can be distinguished from their spectral evolution (e.g., bird singing, car passing by). Long-term time domain information is very beneficial for SED and motiv ates for the use of a temporal context allowing the algorithm to e xtract information from a chronological sequence of input features. Consequently , these are presented as a context window matrix X t : t + T − 1 ∈ R T × F × C , where T ∈ N is the number of frames that defines the sequence length of the temporal conte xt, F ∈ N is the number of frequency bands and C is the number of audio channels. Differently , the target output matrix is defined as Y t : t + T − 1 ∈ N T × K , where K is the number of sound event classes. In the SED stage, the task is to estimate the probabilities p ( Y t : t + T − 1 | X t : t + T − 1 , θ ) ∈ R T × K , where θ denotes the pa- rameters of the neural network. The network outputs, i.e., the ev ent activity probabilities, are then compared to a threshold in order to obtain ev ent acti vity predictions ˆ Y t : t + T − 1 ∈ N T × K . The parameters θ are trained by supervised learning, using the frame-based annotation of the sound event class as target output, thus, if class k is activ e during frame t , Y ( t, k ) is equal to 1, and is set to 0 otherwise. The case of polyphonic SED implies that this target output matrix can hav e multiple non- zero elements K in the same frame t , since se veral classes can be simultaneously present. Indeed, polyphonic SED can be formulated as a multi-label classification problem in which the sound ev ent classes are de- tected by multi-label annotations ov er consecuti ve time frames. The onset and of fset time for each sound ev ent are obtained by combining the classification results over consequent time frames. The trained model will then be used to predict the activity of the sound ev ent classes in an audio stream without any further post-processing operations and prior knowledge on the e vents locations. A. F eatur e Extraction For our purpose, we use tw o acoustic spectral represen- tation, the magnitude of the Short Time Fourier T ransform (STFT) and LogMel coefficients, obtained from all the audio channels and extensiv ely used for other SED algorithms. Except where differently stated, we study the performance of binaural audio features and compare it with those extracted from a single channel audio signal. In all cases, we operate with audio signals sampled at 16 kHz and we calculate the STFT with a frame size equal to 40 ms and a frame step equal to 20 ms. Furthermore, the audio signals are normalized to the range [ − 1 , 1] in order to have the same dynamic range for all the recordings. The STFT is computed on 1024 points for each frame, while LogMel coefficients are obtained by filtering the STFT magnitude spectrum with a filter-bank composed of 40 trian- gular filters evenly spaced in the mel frequency scale [27]. In both cases, the logarithm of the energy of each frequency band is computed. The input matrix X t : t + T − 1 concatenates T = 256 consequent STFT or LogMel vectors for each channel C = { 1 , 2 } , thus the resulting feature tensor is X t : t + T − 1 ∈ R 256 × F × C , where F is equal to 513 for the STFT and equal to 40 for the LogMels. The range of feature v alues is then normalized according to the mean and the standard deviation computed on the training sets of the neural networks. B. Backgr ound on capsule networks Capsules ha ve been introduced to overcome some limita- tions of CNNs, in particular the loss of information caused by the max-pooling operator used for obtaining translational in- variance [23], [24]. The main idea behind capsules is to replace con ventional neurons with local units that produce a vector output (capsules) incorporating all the information detected in the input. Moreover , lo wer-le vel capsules are connected to higher-le vel ones with a set of weights determined during inference by using a dynamic routing mechanism. These two aspects represent the main differences from con ventional neural networks, where neurons output a single scalar value, and connection weights are determined in the training phase by using back-propagation [23], [24]. Recalling the original formulation in [23], [24], a layer of a capsule network is divided in multiple computational units named capsules. Considering capsule j , its total input s j is calculated as: s j = X i α ij W ij u i = X i α ij ˆ u j | i , (1) where α ij are coupling coef ficients between capsule i and capsule j in the lo wer-lev el layer, u i is the output of capsule i , W ij are transformation matrices, and ˆ u j | i are prediction vectors. The vector output of capsule j is calculated by applying a non-linear squashing function that makes the length of short vectors close to zero and the length of long vectors close to 1: v j = k s j k 2 1 + k s j k 2 s j k s j k . (2) Using the squashing function of Eq. (2) allows to interpret the magnitude of the v ector as a probability , in particular the probability that the entity represented by the capsule is present in the input [23]. Coefficients α ij measure how likely capsule i may activ ate capsule j . Thus, the value of α ij should be relatively high if the properties of capsule i coincide with the properties of capsule j in the layer above. As shown in detail in the next section, this is obtained by using the notion of agr eement between capsules in two consecutiv e layers. The coupling coefficients are calculated by the iterativ e process of dynamic routing, and capsules in the higher layers should include capsules in the layer below in terms of the entity they identify . Dynamic routing iterativ ely attempts to find these associations and supports capsules to learn features that ensure these connections. The new “routing-by-agreement” algorithm introduced in [23] represents an ev olution of the simpler routing mechanism intrinsic in max-pooling and will be described in the next section. JOURNAL OF SELECTED TOPICS IN SIGN AL PROCESSING, VOL. X, NO. X, OCTOBER 2018 4 1: procedure R O U T I N G ( ˆ u ij , r , l ) 2: ∀ capsule i in layer l and capsule j in layer ( l + 1) : β ij ← 0. 3: for r iterations do 4: ∀ capsule i in layer l : α ij ← exp( β ij ) P k exp( β ik ) 5: ∀ capsule j in layer ( l + 1) : s j ← P i α ij ˆ u j | i 6: ∀ capsule j in layer ( l + 1) : v j ← k s j k 2 1+ k s j k 2 s j k s j k 7: ∀ capsule i in layer l and capsule j in layer ( l + 1) : β ij ← β ij + ˆ u j | i · v j 8: end f or 9: retur n v j 10: end procedur e Fig. 1. The dynamic routing algorithm proposed in [23]. 1) Dynamic Routing: After giving a qualitative description of the routing mechanism, we describe in detail the algorithm used in [23] to compute the coupling coefficients. The “routing-by-agreement” algorithm operates as shown in Fig. 1. The algorithm is ex ecuted for each layer l of the network and for r iterations, and it outputs vectors v j of layer ( l + 1) . In essence, the algorithm represents the forward pass of the network. As shown in line 4, coupling coefficients α ij are determined by applying the softmax function to coefficients β ij : α ij = exp( β ij ) P k exp( β ik ) . (3) The softmax function ensures that α ij ∈ (0 , 1) , thus making α ij the probability that capsule i in the lo wer-le vel layer sends its output to capsule j in the upper-lev el layer . The coefficients β ij are initialized to zero so that the coupling coefficients α ij hav e all the same initial value. After this step, the β ij coefficients are updated by using an iterative algorithm which uses the agr eement between the output of capsule j , v j , and the prediction of capsule i , ˆ u ij , in the layer below . The agreement is measured by the scalar product ˆ u j | i · v j , and it provides a measure of how similar the directions (i.e., the properties of the entity they represent) of capsules i and j are. 2) Margin loss function: The length of the vector v j is used to represent the probability that the entity represented by the capsule j exists. The CapsNet have to be trained to produce long instantiation v ector at the corresponding k th capsule if the ev ent that it represents is present in the input audio sequence. A separate margin loss is defined for each target class k as: L k = T k max(0 , m + − k v j k ) 2 + λ (1 − T k ) max(0 , k v j k − m − ) 2 , (4) where T k = 1 if an ev ent of class k is present, while λ is a down-weighting f actor of the loss for absent sound e vent classes. m + , m − and λ are respecti vely set equal to 0.9, 0.1 and 0.5 as suggested in [23]. The total loss is simply the sum of the losses of all the output capsules. Co nvo l utio na l La ye r s P r i m a r y C a p s u le s Detecti on Ca psules D y n a m ic R o u t in g C o n v o l u t i o n a l L a y e r s I n p u t F e a t u r e s Eucli dean Norm ... Fig. 2. Flow chart of the capsule neural network architecture used for polyphonic sound event detection. C. CapsNet for P olyphonic Sound Event Detection The architecture of the neural network is sho wn in Fig. 2. The first stages of the model are traditional CNN blocks which act as feature e xtractors on the input X t : t + T − 1 . The input of each CNN block is zero-padded in order to preserve its dimension, and, after each block, max-pooling [28] is used to halve the dimensions only on the frequenc y axis. Thus, the output of the first CNN layers has dimension T × F 0 × Q , where F 0 < F is the number of elements in the frequency axis after max-pooling, and Q is the number of kernels in the final CNN block. This tensor is then used as input for the Primary Capsule Layer that represents the lo west le vel of multi-dimensional entities. The processing stages occurring after the CNN blocks are depicted in Fig. 3. Basically , the Primary Capsule Layer is a con volutional layer with J · M filters, i.e., it contains M con volutional capsules with J k ernels each. The output tensor of this layer has dimension T × F 0 × J · M , and it is then reshaped in order to obtain a T × F 0 · J × M tensor . Capsule vectors u i are represented by the M - dimensional T · F 0 · J vectors of this tensor obtained after applying the squashing operation of Eq. (2). The final layer , or Detection Capsule Layer , is a time-distributed layer composed of K densely connected capsule units with G elements. With “time-distributed”, we mean that the same weights are applied for each time-index. For each t , thus, the Detection Capsule Layer outputs K vectors v i composed of G elements. This JOURNAL OF SELECTED TOPICS IN SIGN AL PROCESSING, VOL. X, NO. X, OCTOBER 2018 5 differs from the architecture proposed in [26], where all the capsule vectors from the Primary Capsule Layer are processed as a whole. Since the previous layer is also a capsule layer, the dynamic routing algorithm is used to compute the output. The backgr ound class was included in the set of K target e vents, in order to represent its instance with a dedicated capsule unit and train the system to recognize the absence of ev ents. In the ev aluation, howe ver , we consider only the outputs relati ve to the target sound ev ents. The model predictions are obtained by computing the Euclidean norm of the output of each Detection Capsule. These values represent the probabilities that one of the target e vents is activ e in a frame t of the input feature matrix X t : t + T − 1 , thus we consider them as the network output predictions. In [23], the authors propose a series of densely connected neuron layers stacked at the bottom of the CapsNet, with the aim to re gularize the weights training by reconstructing the input image. Here, this technique entails an excessi ve complexity of the model to train, due to the higher number of units needed to reconstruct X t : t + T − 1 ∈ R T × F × C , yielding poor performance in our preliminary experiments. W e decided, thus, to use dropout [29] and L 2 weight normalization [30] as regularization techniques, as done in [22]. I I I . E X P E R I M E N TA L S E T - U P In order to ev aluate the performance of the proposed method, we performed a series of experiments on three datasets provided to the participants of dif ferent editions of the DCASE challenge [25], [31]. W e ev aluated the results by comparing the system based on the Capsule architecture with the traditional CNN. The hyperparameters of each network hav e been optimized with a random searc h strate gy [32]. Furthermore, we reported the baselines and the best state-of- the-art performance provided by the challenge organizers. A. Dataset W e assessed the proposed method on three datasets, two containing stereo recordings from real-life en vironments and one artificially generated monophonic mixtures of isolated sound e vents and real background audio. In order to e valuate the proposed method in polyphonic real- life conditions, we used the TUT Sound Events 2016 & 2017 datasets, which were included in the corresponding editions of the DCASE Challenge. For the monophonic SED case study , we used the TUT Rare Sound Events 2017 which represents the task 2 of the DCASE 2017 Challenge. 1) TUT Sound Events 2016: The TUT Sound e vents 2016 (TUT -SED 2016) 1 dataset consists of recordings from two acoustic scenes, respectively “Home” (indoor) and “Resi- dential area” (outdoor) which we considered as two sepa- rate subsets. These acoustic scenes were selected from the challenge or ganizers to represent common environments of interest in applications for safety and surv eillance (outside home) and human activity monitoring or home surveillance [31]. The dataset was collected in Finland by the T ampere 1 http://www .cs.tut.fi/sgn/arg/dcase2016/ Univ ersity of T echnology from different locations by means of a binaural recording system. A total amount of around 54 and 59 minutes of audio are provided respectively for “Home” and “Residential area” scenarios. Sound events present in each recording were manually annotated without any further cross- verification, due to the high lev el of subjectivity inherent to the problem. F or the “Home” scenario a total of 11 classes were defined, while for the “Residential Area” scenario 7 classes were annotated. Each scenario of the TUT -SED 2016 has been divided into two subsets: Development dataset and Evaluation dataset. The split was done based on the number of examples av ailable for each sound e vent class. In addition, for the Dev elopment dataset a cross-v alidation setup is provided in order to easily compare the results of dif ferent approaches on this dataset. The setup consists of 4 folds, so that each recording is used exactly once as test data. More in detail, the “Residential area” set consists of 5 recordings in the Evaluation set and 12 recordings in the De velopment set, while the “Home” set consists of 5 recordings in the Evaluation set and 10 recordings in turn divided into 4 folds as training and validation subsets. 2) TUT Sound Events 2017: The TUT Sound Events 2017 (TUT -SED 2017) 2 dataset consists of recordings of street acoustic scenes with various levels of traffic and other activi- ties, for a total of 121 minutes of audio. The scene was selected as representing an environment of interest for detection of sound events related to human activities and hazard situations. It is a subset of the TUT Acoustic scenes 2016 dataset [31], from which also TUT -SED 2016 dataset was taken. Thus, the recording setup, the annotation procedure, the dataset splitting, and the cross-validation setup is the same described abov e. The y share also some audio contents, in particular the “Residential area” scenario. The 6 target sound e vent classes were selected to represent common sounds related to human presence and traffic, and they include brakes squeaking, car, children, large v ehicle, people speaking, people walking. The Evaluation set of the TUT -SED 2017 consists of 29 minutes of audio, whereas the De velopment set is composed of 92 minutes of audio which are employed in the cross-validation procedure. 3) TUT Rare Sound Events 2017: The TUT Rare Sound Events 2017 (TUT -Rare 2017) 2 [25] consists of isolated sounds of three different tar get ev ent classes (respectiv ely , baby crying, glass breaking and gunshot) and 30-second long recordings of e veryday acoustic scenes to serve as background, such as park, home, street, cafe, train, etc. [31]. In this case we consider a monophonic -SED, since the sound ev ents are artificially mixed with the background sequences without o ver - lap. In addition, the event potentially present in each test file is known a-priori thus it is possible to train dif ferent models, each one specialized for a sound ev ent. In the Development set, we used a number of sequences equal to 750, 750 and 1250 for training respectiv ely of the baby cry , glass-break and gunshot models, while we used 100 sequences as validation set and 500 sequences as test set for all of them. In the Evaluation set, the training and test sequences of the Dev elopment set 2 http://www .cs.tut.fi/sgn/arg/dcase2017/ JOURNAL OF SELECTED TOPICS IN SIGN AL PROCESSING, VOL. X, NO. X, OCTOBER 2018 6 T F 0 Q Primary Capsule Layer J ¢ M T F 0 Reshap e T F 0 ¢ J ... ... ... ... 1 1 M ... 1 T G K Dete ction Capsu le Layer ... ... ... 1 ... Euclidean Norm 1 K ... ... 1 T ... Fig. 3. Details of the processing stages that occur after the initial CNN layers. The dimension of vectors u i is 1 × 1 × M , the dimension of vectors v j is 1 × 1 × G . The decision stage after the Euclidean norm calculation is not shown for simplicity . are combined into a single training set, while the validation set is the same used in the De velopment dataset. The system is ev aluated against an “unseen” set of 1500 samples (500 for each target class) with a sound e vent presence probability for each class equal to 0.5. B. Evaluation Metrics In this work we used the Error Rate (ER) as primary ev aluation metric to ensure comparability with the reference systems. In particular , for the ev aluations on the TUT -SED 2016 and 2017 datasets we consider a segment-based ER with a one-second segment length, while for the TUT -Rare 2017 the ev aluation metric is ev ent-based error rate calculated using onset-only condition with a collar of 500 ms. In the segment- based ER the ground truth and system output are compared in a fixed time grid, thus sound ev ents are marked as acti ve or inactiv e in each segment. For the e vent-based ER the ground truth and system output are compared at ev ent instance lev el. ER score is calculated in a single time frame of one second length from intermediate statistics, i.e., the number of substitutions ( S ( t 1 ) ), insertions ( I ( t 1 ) ), deletions ( D ( t 1 ) ) and activ e sound e vents from annotations ( N ( t 1 ) ) for a se gment t 1 . Specifically: 1) Substitutions S ( t 1 ) are the number of ground truth ev ents for which we hav e a false positiv e and one false negati ve in the same segment; 2) Insertions I ( t 1 ) are events in system output that are not present in the ground truth, thus the f alse positi ves which cannot be counted as substitutions; 3) Deletions D ( t 1 ) are e vents in ground truth that are not correctly detected by the system, thus the false negativ es which cannot be counted as substitutions. These intermediate statistics are accumulated ov er the se g- ments of the whole test set to compute the ev aluation metric ER. Thus, the total error rate is calculated as: E R = P T t 1 =1 S ( t 1 ) + P T t 1 =1 I ( t 1 ) + P T t 1 =1 D ( t 1 ) P T t 1 =1 N ( t 1 ) , (5) where T is the total number of segments t 1 . If there are multiple scenes in the dataset, such as in the TUT -SED 2016, ev aluation metrics are calculated for each scene separately and then the results are presented as the av- erage across the scenes. A detailed and visualized explanation of segment-based ER score in multi label setting can be found in [33]. C. Comparative Algorithms Since the datasets we used were employed to dev elop and ev aluate the algorithms proposed from the participants of the DCASE challenges, we can compare our results with the most recent approaches in the state-of-the-art. In addition, each challenge task came along with a baseline method that consists in a basic approach for the SED. It represents a reference for the participants of the challenges while they were de veloping their systems. 1) TUT -SED 2016: The baseline system is based on mel- frequency cepstral coef ficients (MFCC) acoustic features and multiple GMM-based classifiers. In detail, for each event class, a binary classifier is trained using the audio segments annotated as belonging to the model representing the ev ent class, and the rest of the audio to the model which represents the negati ve class. The decision is based on likelihood ratio between the positive and negati ve models for each indi vidual class, with a sliding window of one second. T o the best of our kno wledge, the most performing method for this dataset is an algorithm we proposed [34] in 2017, based on binaural MFCC features and a Multi-Layer Perceptron (MLP) neural network used as classifier . The detection task is performed by an adaptiv e energy V oice Activity Detector (V AD) which precedes the MLP and determines the starting and ending point of an ev ent-activ e audio sequence. 2) TUT -SED 2017: In this case the baseline method relies on an MLP architecture using 40 LogMels as audio rep- resentation [25]. The network is fed with a feature vector comprehending 5-frame as temporal context. The neural net- work is composed of two dense layers of 50 hidden units per layer with the 20% of dropout, while the network output layer contains K sigmoid units (where K is the number of classes) that can be acti ve at the same time and represent the network prediction of ev ent activity for each context window . The state-of-the-art algorithm is based on the CRNN architecture [35]. The authors compared both monaural and binaural acoustic features, observing that binaural features in general ha ve similar performance as single channel features on the Dev elopment dataset although the best result on the Evaluation dataset is obtained using monaural LogMels as network inputs. According to the authors, this can suggest that the dataset was possibly not large enough to train the CRNN fed with this kind of features. 3) TUT -Rar e 2017: The baseline [31] and the state-of-the- art methods of the DCASE 2017 challenge (Rare-SED) were based on a very similar architectures to that employed for the TUT -SED 2016 and described above. For the baseline method, JOURNAL OF SELECTED TOPICS IN SIGN AL PROCESSING, VOL. X, NO. X, OCTOBER 2018 7 T ABLE I H Y PE R PAR A M E TE R S O P T IM I Z E D I N T H E R A ND O M - SE A R C H P H AS E AN D T H E R E SU LT IN G B E S T P E R FO R M I NG M OD E L S . Parameter Range Distribution Batch Normalization [yes - no] random choice CNN layers Nr. [1 - 4] uniform CNN kernels Nr . [4 - 64] log-uniform CNN kernels dim. [3 × 3 - 8 × 8] uniform Pooling dim. [1 × 1 - 2 × 5] uniform CNN activ ation [tanh - ReLU] random choice CNN dropout [0 - 0.5] uniform CNN L2 [yes - no] random choice Primary Capsules Nr. M [2 - 8] uniform Primary Capsules kernels dim. [3 × 3 - 5 × 5] uniform Primary Capsules dimension J [2 - 16] uniform Detection Capsules dimension G [2 - 16] uniform Capsules dropout [0 - 0.5] uniform Routing iterations [1 - 5] uniform the only difference relies in the output layer , which in this case is composed of a single sigmoid unit. The first classified algorithm [36] takes 128 LogMels as input and process them frame-wise by means of a CRNN with 1D filters on the first stage. D. Neural Network configuration W e performed a hyperparameter search by running a series of experiments over predetermined ranges. W e selected the configuration that leads, for each network architecture, to the best results from the cross-validation procedure on the Dev elopment dataset of each task and used this architecture to compute the results on the corresponding Ev aluation dataset. The number and shape of con volutional layers, the non- linear acti vation function, the regularizers in addition to the capsules dimensions and the maximum number of routing it- erations have been varied for a total of 100 configurations. De- tails of searched hyperparameters and their ranges are reported in T able I. The neural networks training was accomplished by the AdaDelta stochastic gradient-based optimization algorithm [37] for a maximum of 100 epochs and batch size equal to 20 on the margin loss function. The optimizer hyperparameters were set according to [37] (i.e., initial learning rate lr = 1 . 0 , ρ = 0 . 95 , = 10 − 6 ). The trainable weights were initialized according to the Glor ot-uniform scheme [38] and an early stopping strategy was employed during the training in order to av oid overfitting. If the v alidation ER did not decrease for 20 consecutive epochs, the training was stopped, and the last saved model was selected as the final model. In addition, dropout and L 2 weight normalization (with λ = 0 . 01 ) ha ve been used as weights regularization techniques [29]. The algorithm has been implemented in the Python language using Keras [39] and T ensorflow [40] as deep learning libraries, while Librosa [41] has been used for feature extraction 3 . For the CNN models, we performed a similar random hy- perparameters search procedure for each dataset, considering only the first two blocks of the T able I and by replacing the 3 Source code available at the following address: https://gitlab.com/ a3labShares/capsule- for- sed capsule layers with feedforward layers with sigmoid activ ation function. On TUT -SED 2016 and 2017 datasets, the ev ent activity probabilities are simply thresholded at a fix ed value equal to 0.5, in order to obtain the binary acti vity matrix used to compute the reference metric. On the TUT -Rare 2017 the network output signal is processed as proposed in [42], thus it is con volv ed with an exponential decay window then it is processed with a sliding median filter with a local windo w-size and finally a threshold is applied. I V . R E S U L T S In this section, we present the results for all the datasets and experiments described in Section III. The ev aluation of Capsule and CNNs based methods hav e been conducted on the Dev elopment sets of each examined dataset using random combinations of hyperparameters gi ven in T able I. A. TUT -SED 2016 Results on TUT -SET 2016 dataset are shown in T able III, while T able II reports the configurations which yielded the best performance on the Evaluation dataset. All the found models have ReLU as non-linear activ ation function and use dropout technique as weight regularization, while the batch- normalization applied after each con volutional layer seems to be effecti ve only for the CapsNet. T able III reports the results considering each combination of architecture and features we ev aluated. The best performing setups are highlighted with bold face. The use of STFT as acoustic representation is beneficial for both the architectures with respect to the LogMels. In particular , the CapsNet obtains the lowest ER on the cross-v alidation performed on Development dataset when is fed by the binaural version of such features. On the two scenarios of the Evaluation dataset, a model based on CapsNet and binaural STFT obtains an averaged ER equal to 0.69, which is lar gely below both the challenge baseline [31] (- 0.19) and the best score reported in literature [34] (-0.10). The comparative method based on CNNs seems not to fit at all when LogMels are used as input, while the performance is aligned with the challenge baseline based on GMM classifiers when the models are fed by monaural STFT . This discrepancy can be motiv ated by the enhanced ability of CapsNet to exploit small training datasets, in particular due to the effect of the routing mechanism on the weight training. In fact, the TUT - SED 2016 is composed of a small amount of audio and the sounds ev ents occur sparsely (i.e., only 49 minutes of the total audio contain at least one e vent acti ve), thus, the o verall results of the comparati ve methods (CNNs, Baseline, and State-of- the-art) on this dataset are quite low compared to the other datasets. Another CapsNet property that is worth to highlight is the lower number of free parameters that compose the models compared to e valuated CNNs. As shown in T able II, the considered architectures hav e 267 K and 252 K free parameters respectiv ely for the “Home” and the “Residential area” sce- nario. It is a relativ ely low number of parameters to be trained (e.g., a popular deep architecture for image classification such JOURNAL OF SELECTED TOPICS IN SIGN AL PROCESSING, VOL. X, NO. X, OCTOBER 2018 8 (a) (b) (c) (d) Fig. 4. STFT Spectrogram of the input sequence (a), ground truth (b) and ev ent activity probabilities for CapsNet (c) and CNN (d) from a sequence of test examples from TUT -SED 2016 dataset. as AlexNet [43] is composed of 60 M parameters), and the best performing CapsNets of each considered scenario ha ve ev en less parameters with respect to the CNNs (-22% and - 64% respectively for the “Home” and the “Residential area” scenario). Thus, the high performance of CapsNet can be explained with the architectural adv antage rather than the model complexity . In addition, there can be a significant performance shift for the same type of netw orks with the same number of parameters, which means that a suitable hyperparameters search action (e.g., number of filters on the con volutional layers, dimension of the capsule units) is crucial in finding the best performing network structure. 1) Closer Look at Network Outputs: A comparativ e e x- ample on the neural network outputs, which are regarded as ev ent activity probabilities is presented in Fig. 4. The monaural STFT from a 40 seconds sequence of the “Residential area” dataset is shown along with ev ent annotations and the network outputs of the CapsNet and the CNN best performing models. For this example, we chose the monaural STFT as input feature because generally it yields the best results over all the considered datasets. Fig. 4 shows a bir d singing ev ent lasting for the whole sequence and correctly detected by both the architectures. When the car passing by event overlaps the bir d singing , the CapsNet detects more clearly its presence. The people speaking e vent is slightly detected by both the (a) (b) (c) (d) Fig. 5. STFT Spectrogram of the input sequence (a), ground truth (b) and ev ent activity probabilities for CapsNet (c) and CNN (d) from a sequence of test examples from TUT -SED 2017 dataset. models, while the object banging activ ates the relativ e Capsule exactly only in correspondence of the ev ent annotation. It must be noted that the dataset is composed of un verified manually labelled real-life recordings, that may present a de gree of subjectivity , thus, affecting the training. Nev ertheless, the CapsNet exhibits remarkable detection capability especially in the condition of overlapping e vents, while the CNN outputs are definitely more “blurred” and the e vent people walking is wrongly detected in this sequence. B. TUT -SED 2017 The bottom of T able III reports the results obtained with the TUT -SED 2017. As in the TUT -SED 2016, the best performing models on the De velopment dataset are those fed by the Binaural STFT of the input signal. In this case, we can also observe interesting performance obtained by the CNNs, which on the Evaluation dataset obtain a lo wer ER (i.e., equal to 0.65) with respect to the state-of-the-art algorithm [35], based on CRNNs. CapsNet confirms its ef fecti veness and it obtains lowest ER equal to 0.58 with LogMel features, although with a slight margin with respect to the other inputs (i.e., -0.03 compared to the STFT features, -0.06 compared to both the binaural v ersion of LogMels and STFT spectrograms). JOURNAL OF SELECTED TOPICS IN SIGN AL PROCESSING, VOL. X, NO. X, OCTOBER 2018 9 T ABLE II H Y PE R PAR A M E TE R S O F T H E B E S T P E RF O R M IN G MO D E L S O N T H E T U T - P O L Y P H O NI C SE D 20 1 6 & 2 01 7 E VAL UAT IO N D A TA S ET S . TUT -SED 2016 TUT -SED 2017 Home Residential Street CapsNet CNN CapsNet CNN CapsNet CNN CNN kernels Nr . [32 , 32 , 8] [64 , 64 , 16 , 64] [4 , 16 , 32 , 4] [64] [4 , 16 , 32 , 4] [64 , 64 , 16 , 64] CNN kernels dim. 6 × 6 5 × 5 4 × 4 5 × 5 4 × 4 5 × 5 Pooling dim. ( F axis) [4 , 3 , 2] [2 , 2 , 2 , 2] [2 , 2 , 2 , 2] [2] [2 , 2 , 2 , 2] [2 , 2 , 2 , 2] MLP layers dim. - [85 , 65] - [42 , 54 , 66 , 139] - [85 , 65] Primary Capsules Nr. M 8 - 7 - 7 - Primary Capsules kernels dim. 4 × 4 - 3 × 3 - 3 × 3 - Primary Capsules dimension J 9 - 16 - 16 - Detection Capsules dimension G 11 - 8 - 8 - Routing iterations 3 - 4 - 4 - # Params 267 K 343 K 252 K 709 K 223K 342 K T ABLE III R E SU LT S O F BE S T P E R F OR M I N G M O D E LS I N T E RM S OF E R O N TH E T U T - S E D 2 0 1 6 & 20 1 7 D A TA SE T . TUT -SED 2016 - Home Dev elopment Evaluation Features LogMels Binaural LogMels STFT Binaural STFT LogMels Binaural LogMels STFT Binaural STFT CNN 11.15 11.58 1.06 1.07 6.80 8.43 0.95 0.92 CapsNet 0.58 0.59 0.44 0.39 0.74 0.75 0.61 0.69 TUT -SED 2016 - Residential Area Features LogMels Binaural LogMels STFT Binaural STFT LogMels Binaural LogMels STFT Binaural STFT CNN 3.24 3.11 0.64 1.10 2.36 2.76 1.00 1.35 CapsNet 0.36 0.34 0.32 0.32 0.72 0.75 0.78 0.68 TUT -SED 2016 - A veraged CNN 7.20 7.35 0.85 1.09 4.58 5.60 0.98 1.14 CapsNet 0.47 0.47 0.38 0.36 0.73 0.75 0.70 0.69 Baseline [31] 0.91 0.88 State-of-the-art [34] 0.78 0.79 TUT -SED 2017 Dev elopment Evaluation Features LogMels Binaural LogMels STFT Binaural STFT LogMels Binaural LogMels STFT Binaural STFT CNN 1.56 2.12 0.57 0.60 1.38 1.79 0.67 0.65 CapsNet 0.45 0.42 0.36 0.36 0.58 0.64 0.61 0.64 Baseline [25] 0.69 0.93 State-of-the-art [35] 0.52 0.79 It is worth highlighting that in the Development cross- validation, the CapsNet models yielded significantly better performance with respect to the other reported approaches, while the CNNs have decidedly w orse performance. On the Evaluation dataset, howe ver , the ER scores of the CapsNets suffer more relati ve deterioration with respect to the CNNs ones. This is related to the fact that the CapsNet are subject to larger random fluctuations of the ER from epoch to epoch. In absence of ground truth labels and, thus, of the early stopping strategy , the model taken after a fixed number of training epochs is suboptimal, and, with CapsNet, more prone to large errors than with CNN. Notwithstanding this weakness, the absolute performance obtained both with monaural and binaural spectral features is consistent and impro ves the state-of-the-art result, with a reduction of the ER of up to 0.21 in the best case. This is particularly e vident in Fig. 5, that shows the output of the two best performing systems for a sequence of approximately 20 seconds length which contains highly overlapping sounds. The e vent classes “people walking” and “large vehicle” are ov erlapped for almost all the sequence duration and they are well detected by the CapsNet, although they are of different nature: the “large vehicle” has a typical timber and is almost stationary , while the class “people walking” comprehend im- pulsiv e and desultory sounds. The CNN does not seem to be able to distinguish between the “large vehicle” and the “car” classes, detecting confidently only the latter, while the activ ation corresponding “people walking” class is modest. The presence of the “brakes squeaking” class, which has a specific spectral profile mostly located in the highest frequency JOURNAL OF SELECTED TOPICS IN SIGN AL PROCESSING, VOL. X, NO. X, OCTOBER 2018 10 bands (as shown in the spectrogram), is detected only by the CapsNet. W e can assume this as a concrete experimental validation of the routing ef fectiv eness. The number of free parameters amounts to 223 K for the best configuration sho wn in T able II and it is similar to those found for the TUT -SED 2016, which consists also in this case in a reduction equal to 35% with respect to the best CNN layout. C. TUT -Rar e SED 2017 The advantage provided by the routing procedure to the CapsNet is particularly effecti ve in the case of polyphonic SED. The results on the monophonic SED task hav e been obtained by using the TUT -Rare SED 2017 dataset and they are shown in T able V. In this case, the e valuation metric is the event-based ER calculated using onset-only condition. W e performed a separate random-search for each of the three sound e vent classes both for CapsNets and CNNs and we report the av eraged score over the three classes. The setups that obtained the best performance on the Evaluation dataset are shown in T able IV. This is the largest dataset we ev aluated, and its characteristic is the high unbalance between the amount of background sounds versus the tar get sound events. From the analysis of the results of the individual classes on the Evaluation set (not included here for the sake of conciseness), we notice that both architectures achie ve the best performance on the glass break class (0.25 and 0.24 respectiv ely for CNNs and CapsNet with LogMels features), due to its clear spectral fingerprint compared to the back- ground sound. The worst performing class is the gunshot (ER equal to 0.58 for the CapsNet), although the noise produced by different instances of this class inv olves similar spectral components. The low performance is probably due to the fast decay of this sound, which means that in this case the routing procedure is not sufficient to av oid confusing the gunshot with other background noises, especially in the case of dataset unbalancing and low event-to-background ratio. A solution to this issue can be found in the combination of CapsNet with RNN units, as proposed in [19] for the CNNs which yields an efficient modelling of the gunshot by CRNN and improv es the detection abilities even in polyphonic conditions. The baby cry class consists of short, harmonic sounds, and it is detected with almost the same accuracy by the two architectures. Finally , the CNN shows better generalization performance with respect to the CapsNet, although the ER score is far from state-of-the-art that use the aforementioned CRNNs [36] or a hierarchical framework [42]. In addition, in this case the CNN models hav e a reduced number of trainable parameters (36%) compared to the CapsNets, except for the “gunshot” case b ut, as mentioned, it is also the configuration that gets the worst results. D. Alternative Dynamic Routing for SED W e observed that the original routing procedure implies the initialization of the coefficients β ij to zero each time the procedure is restarted, i.e., after each input sample has been processed. This is reasonable in the case of image classification, for which the CapsNet has been originally proposed. In the case of audio task, we clearly expect a higher correlation between samples belonging to adjacent temporal frames X . W e thus inv estigated the chance to initialize the coefficients β ij to zero only at the very first iteration, while for subsequent X to assign them the last values they had at the end of the pre vious iterati ve procedure. W e experimented this v ariant considering the best performing models of the analyzed scenarios for polyphonic SED, taking into account only the systems fed with the monaural STFT . As shown in T able VI, the modification we propose in the routing procedure is effecti ve in particular on the Evaluation datasets, conferring improv ed generalization properties to the models we tested ev en without accomplishing a specific hyperparameters opti- mization. V . C O N C L U S I O N In this work, we proposed to apply a novel neural network architecture, the CapsNet, to the polyphonic SED task. The architecture is based on both conv olutional and capsule layers. The conv olutional layers extract high-lev el time-frequency feature maps from input matrices which provide an acoustic spectral representation with long temporal context. The ob- tained feature maps are then used as input to the Primary Capsule layer which is connected to the Detection Capsule layer that extracts the ev ent activity probabilities. These last two layers are in volved in the iterati ve routing-by-a gr eement procedure, which computes the outputs based on a measure of likelihood between a capsule and its parent capsules. This architecture combines, thus, the ability of con volutional layers to learn local translation in variant filters with the ability of capsules to learn part-whole relations by using the routing procedure. Part of the no velty of this w ork resides in the adaptation of the CapsNet architecture for the audio event detection task, with a special care on the input data, the layers interconnection and the regularization techniques. The routing procedure is also modified to account for an assumed temporal correlation within the data, with a further a verage performance improv e- ment of 6% among the polyphonic SED tasks. An extensiv e ev aluation of the algorithm is proposed with comparison to recent state-of-the-art methods on three dif- ferent datasets. The experimental results demonstrate that the use of dynamic routing procedure is effecti ve and it provides significant performance improv ement in the case of ov erlapping sound e vents compared to traditional CNNs, and other established methods in polyphonic SED. Interestingly , the CNN based method obtained the best performance in the monophonic SED case study , thus emphasizing the suitabil- ity of the CapsNet architecture in dealing with ov erlapping sounds. W e showed that this model is particularly effecti ve with small sized datasets, such as TUT -SED 2016 which contains a total 78 minutes of audio for the dev elopment of the models of which one third is background noise. Furthermore, the network trainable parameters are reduced with respect to other deep learning architectures, confirming the architectural advantage giv en by the introduced features also in the task of polyphonic SED. JOURNAL OF SELECTED TOPICS IN SIGN AL PROCESSING, VOL. X, NO. X, OCTOBER 2018 11 T ABLE IV H Y PE R PAR A M E TE R S O F T H E B E S T P E RF O R M IN G MO D E L S O N T H E T U T - R A RE 2 01 7 M ON O P HO N I C S E D E V A L UATI O N D A TA SE T S . TUT -Rare SED 2017 Monophonic SED Baby cry Glass break Gunshot CapsNet CNN CapsNet CNN CapsNet CNN CNN kernels Nr . [16 , 64 , 32] [16 , 32 , 8 , 16] [16 , 64 , 32] [16 , 32 , 8 , 16] [16 , 16] [16 , 64 , 32 , 32] CNN kernels dim. 6 × 6 8 × 8 6 × 6 8 × 8 8 × 8 7 × 7 Pooling dim. ( F axis) [4 , 3 , 2] [3 , 3 , 2 , 2] [4 , 3 , 2] [3 , 3 , 2 , 2] [5 , 2] [5 , 4 , 2 , 1] MLP layers dim. - [212 , 67] - [212 , 67] - 112 , 51 Primary Capsules Nr. M 7 - 7 - 8 - Primary Capsules kernels dim. 3 × 3 - 3 × 3 - 3 × 3 - Primary Capsules dimension J 8 - 8 - 8 - Detection Capsules dimension G 14 - 14 - 6 - Routing iterations 5 - 5 - 1 - # Params 131 K 84 K 131 K 84 K 30 K 211 K T ABLE V R E SU LT S O F BE S T P E R F OR M I N G M O D E LS I N T E RM S OF E R O N TH E T U T - R A RE S E D 2 0 1 7 D A TA SE T . TUT -RareSED 2017 - Monophonic SED Dev elopment Ev aluation Features LogMels STFT LogMels STFT CNN 0.29 0.21 0.41 0.46 CapsNet 0.17 0.20 0.45 0.54 Baseline [31] 0.53 0.64 Hierarchic CNNs [42] 0.13 0.22 State-of-the-art [36] 0.07 0.13 T ABLE VI R E SU LT S O F TE S T P E R F OR M E D W I T H O U R P RO P O S ED V A R I AN T O F RO U T IN G PR OC E D U RE . TUT -SED 2016 - Home Dev elopment Evaluation CapsNet 0.44 0.61 CapsNet - NR 0.41 -6.8% 0.58 -4.9 % TUT -SED 2016 - Residential CapsNet 0.32 0.78 CapsNet - NR 0.31 -3.1% 0.72 -7.7 % TUT -SED 2016 - A verage CapsNet 0.38 0.70 CapsNet - NR 0.36 -5.3% 0.65 -7.1 % TUT -SED 2017 - Street CapsNet 0.36 0.61 CapsNet - NR 0.36 0.0% 0.58 -4.9 % The results we observed in this work are consistent with many other classification tasks in various domains [44]–[46] and they pro ve that the CapsNet is an ef fective approach which enhances the well-established representation capabilities of the CNNs also in the audio field. Howe ver , se veral aspects still remain une xplored and require further studies: the robustness of CapsNets to overlapping signals (i.e., images or sounds) has been demonstrated in this work as well as in [23]. In [23], the authors demonstrated also the capability of CapsNets to be in variant to affine transformations of images, such as rotations. In the audio case study , this characteristic could be e xploited for obtaining in variance respect to the source position by using a space-time representation of multi-channel audio signals. Moreov er, regularization methods can be inv es- tigated to overcome the lack of generalization which seems to affect the CapsNets. Furthermore, regarding the SED task the addition of recurrent units may be explored to enhance the detection of particular (i.e., impulsiv e) sound e vents in real- life audio and the recently-proposed variant of routing, based on the Expectation Maximization algorithm (EM) [47], can be in vestigated in this context. A C K N O W L E D G E M E N T This research has been partly supported by the Italian Univ ersity and Research Consortium CINECA. W e acknowl- edge them for the availability of high-performance computing resources and support. R E F E R E N C E S [1] T . V irtanen, M. D. Plumbley , and D. Ellis, Computational analysis of sound scenes and events . Springer , 2018. [2] M. Crocco, M. Cristani, A. Trucco, and V . Murino, “ Audio surveillance: a systematic revie w , ” ACM Computing Surveys (CSUR) , vol. 48, no. 4, p. 52, 2016. [3] Y .-T . Peng, C.-Y . Lin, M.-T . Sun, and K.-C. Tsai, “Healthcare audio ev ent classification using hidden Markov models and hierarchical hidden Markov models, ” in Proc. of ICME , 2009. [4] P . Foggia, N. Petkov , A. Saggese, N. Strisciuglio, and M. V ento, “Reliable detection of audio events in highly noisy environments, ” P attern Recognition Letters , vol. 65, pp. 22–28, 2015. [5] J. Salamon and J. P . Bello, “Deep con volutional neural networks and data augmentation for environmental sound classification, ” IEEE Signal Pr ocessing Letters , vol. 24, no. 3, pp. 279–283, 2017. [6] T . Grill and J. Schlter, “T wo conv olutional neural networks for bird detection in audio signals, ” in Pr oc. of EUSIPCO . IEEE, Aug 2017, pp. 1764–1768. [7] D. Stowell and D. Clayton, “ Acoustic ev ent detection for multiple overlapping similar sources, ” in Proc. of W ASP AA . IEEE, 2015, pp. 1–5. [8] N. Degara, M. E. Davies, A. Pena, and M. D. Plumbley , “Onset event decoding exploiting the rh ythmic structure of polyphonic music, ” IEEE J. Sel. T . in Signal Proc. , v ol. 5, no. 6, pp. 1228–1239, 2011. [9] T . Heittola, A. Mesaros, A. Eronen, and T . V irtanen, “ Audio context recognition using audio event histograms, ” in Proc. of EUSIPCO , 2010, pp. 1272–1276. [10] J. J. Carabias-Orti, T . V irtanen, P . V era-Candeas, N. Ruiz-Reyes, and F . J. Canadas-Quesada, “Musical instrument sound multi-excitation model for non-negati ve spectrogram factorization, ” IEEE J. Sel. T . in Signal Proc. , vol. 5, no. 6, pp. 1144–1158, 2011. JOURNAL OF SELECTED TOPICS IN SIGN AL PROCESSING, VOL. X, NO. X, OCTOBER 2018 12 [11] G. Guo and S. Z. Li, “Content-based audio classification and retriev al by support vector machines, ” IEEE T rans. Neural Netw . , vol. 14, no. 1, pp. 209–215, 2003. [12] I. McLoughlin, H. Zhang, Z. Xie, Y . Song, and W . Xiao, “Rob ust sound ev ent classification using deep neural networks, ” IEEE T rans. Audio, Speech, Language Pr ocess. , vol. 23, no. 3, pp. 540–552, 2015. [13] A.-r. Mohamed, G. E. Dahl, G. Hinton, et al. , “ Acoustic modeling using deep belief networks, ” IEEE T rans. Audio, Speech, Language Pr ocess. , vol. 20, no. 1, pp. 14–22, 2012. [14] K. J. Piczak, “Environmental sound classification with conv olutional neural networks, ” in Pr oc. of MLSP . IEEE, 2015, pp. 1–6. [15] A. Graves, A.-r . Mohamed, and G. Hinton, “Speech recognition with deep recurrent neural networks, ” in Pr oc. of ICASSP . IEEE, 2013, pp. 6645–6649. [16] G. Trigeorgis, F . Ringev al, R. Brueckner , E. Marchi, M. A. Nicolaou, B. Schuller , and S. Zafeiriou, “ Adieu features? end-to-end speech emotion recognition using a deep con volutional recurrent network, ” in Pr oc. of ICASSP . IEEE, 2016, pp. 5200–5204. [17] B. W u, K. Li, F . Ge, Z. Huang, M. Y ang, S. M. Siniscalchi, and C.- H. Lee, “ An end-to-end deep learning approach to simultaneous speech derev erberation and acoustic modeling for robust speech recognition, ” IEEE J. Sel. T . in Signal Proc. , vol. 11, no. 8, pp. 1289–1300, 2017. [18] M. Espi, M. Fujimoto, K. Kinoshita, and T . Nakatani, “Exploiting spectro-temporal locality in deep learning based acoustic e vent detec- tion, ” EURASIP J, on Audio, Speech, and Music Pr ocess. , vol. 2015, no. 1, p. 26, Sep 2015. [19] E. Cakir , G. Parascandolo, T . Heittola, H. Huttunen, and T . V irtanen, “Con volutional recurrent neural networks for polyphonic sound event detection, ” IEEE T rans. Audio, Speec h, Language Process. , vol. 25, no. 6, pp. 1291–1303, 2017. [20] T . Virtanen, A. Mesaros, T . Heittola, A. Diment, E. V incent, E. Benetos, and B. M. Elizalde, Pr oceedings of the Detection and Classification of Acoustic Scenes and Events 2017 W orkshop . T ampere Uni versity of T echnology . Laboratory of Signal Processing, 2017. [21] F . V esperini, L. Gabrielli, E. Principi, and S. Squartini, “ A capsule neural networks based approach for bird audio detection, ” Ancona, Italy , 2018, DCASE Tech. Report. Copyright-free. [22] T . Iqbal, Y . Xu, Q. K ong, and W . W ang, “Capsule routing for sound ev ent detection, ” in Pr oc. of the Eur opean Signal Pr ocessing Confer ence , Rome, Italy , Sep. 3-7 2018, pp. 2255–2259. [23] S. Sabour, N. Frosst, and G. E. Hinton, “Dynamic routing between capsules, ” in Advances in Neural Information Processing Systems , 2017, pp. 3856–3866. [24] G. E. Hinton, A. Krizhevsky , and S. D. W ang, “T ransforming auto- encoders, ” in Pr oc. of ICANN . Springer , 2011, pp. 44–51. [25] A. Mesaros, T . Heittola, A. Diment, B. Elizalde, A. Shah, E. V incent, B. Raj, and T . Virtanen, “DCASE 2017 challenge setup: T asks, datasets and baseline system, ” in Proc. of DCASE , 2017. [26] J. Bae and D.-S. Kim, “End-to-end speech command recognition with capsule network, ” in Proc. of Inter speech , Hyderabad, India, Sep. 2-6 2018, pp. 776–780. [27] M. Slaney , “ Auditory toolbox, ” Interval Researc h Corporation, T ech. Rep , vol. 10, 1998. [28] D. Scherer, A. M ¨ uller , and S. Behnke, “Evaluation of pooling operations in con volutional architectures for object recognition, ” in Pr oc. of ICANN . Berlin, Heidelberg: Springer Berlin Heidelberg, 2010, pp. 92–101. [29] N. Srivasta va, G. Hinton, A. Krizhevsky , I. Sutskev er , and R. Salakhut- dinov , “Dropout: A simple way to prevent neural networks from overfit- ting, ” J. of Machine Learning Resear ch , vol. 15, no. 1, pp. 1929–1958, 2014. [30] A. E. Hoerl and R. W . Kennard, “Ridge regression: Biased estimation for nonorthogonal problems, ” T echnometrics , vol. 12, no. 1, pp. 55–67, 1970. [31] A. Mesaros, T . Heittola, and T . V irtanen, “TUT database for acoustic scene classification and sound ev ent detection, ” in Pr oc. of EUSIPCO , Aug 2016, pp. 1128–1132. [32] J. Ber gstra and Y . Bengio, “Random search for hyper-parameter opti- mization, ” J. of Machine Learning Research , vol. 13, no. Feb, pp. 281– 305, 2012. [33] A. Mesaros, T . Heittola, and T . V irtanen, “Metrics for polyphonic sound ev ent detection, ” Applied Sciences , vol. 6, no. 6, p. 162, 2016. [34] M. V alenti, D. T onelli, F . V esperini, E. Principi, and S. Squartini, “ A neural network approach for sound ev ent detection in real life audio, ” in Pr oc. of EUSIPCO . IEEE, 2017, pp. 2754–2758. [35] S. Adavanne and T . V irtanen, “ A report on sound event detection with different binaural features, ” arXiv preprint , 2017. [36] H. Lim, J. Park, and Y . Han, “Rare sound event detection using 1D con volutional recurrent neural netw orks, ” in Pr oc. of DCASE , 2017, pp. 80–84. [37] M. D. Zeiler , “ AdaDelta: an adaptiv e learning rate method, ” arXiv pr eprint arXiv:1212.5701 , 2012. [38] X. Glorot and Y . Bengio, “Understanding the difficulty of training deep feedforward neural networks, ” in Pr oc. of AIST ATS , 2010, pp. 249–256. [39] F . Chollet et al. , “Keras, ” https://github.com/k eras- team/keras, 2015. [40] M. Abadi et al. , “T ensorFlow: Large-scale machine learning on heterogeneous systems, ” pp. 265–283, 2016. [Online]. A vailable: https://www .tensorflow .org/ [41] B. McFee, C. Raffel, D. Liang, D. P . Ellis, M. McV icar, E. Battenber g, and O. Nieto, “librosa: Audio and music signal analysis in python, ” in Pr oc. of SciPy , 2015, pp. 18–25. [42] F . V esperini, D. Droghini, E. Principi, L. Gabrielli, and S. Squartini, “Hierarchic ConvNets framework for rare sound event detection, ” in Pr oc. of EUSIPCO . IEEE, Sept. 3-7 2018. [43] A. Krizhevsk y , I. Sutskev er , and G. E. Hinton, “Imagenet classification with deep conv olutional neural networks, ” in Advances in neural infor- mation pr ocessing systems , 2012, pp. 1097–1105. [44] F . Deng, S. Pu, X. Chen, Y . Shi, T . Y uan, and S. Pu, “Hyperspectral im- age classification with capsule network using limited training samples, ” Sensors , vol. 18, no. 9, 2018. [45] Y . Shen and M. Gao, “Dynamic routing on deep neural network for thoracic disease classification and sensiti ve area localization, ” in Machine Learning in Medical Imaging , Y . Shi, H.-I. Suk, and M. Liu, Eds. Springer International Publishing, 2018, pp. 389–397. [46] M. A. Jalal, R. Chen, R. K. Moore, and L. Mihaylova, “ American sign language posture understanding with deep neural networks, ” in Pr oc. of FUSION . IEEE, 2018, pp. 573–579. [47] G. E. Hinton, S. Sabour, and N. Frosst, “Matrix capsules with EM routing, ” in Pr oc. of ICLR , V ancouver , BC, 2018. Fabio V esperini was born in San Benedetto del T ronto, Italy , on May 1989. He receiv ed his M.Sc. degree (cum laude) in electronic engineering in 2015 from Univ ersit ` a Politecnica delle Marche (Uni- vPM). In 2014 he was at the T echnische Universtit ¨ at M ¨ unchen as visiting student for 7 months, where he carried out his master thesis project on acoustic novelty detection. He is currently a PhD student at the Department of Information Engineering, at UnivPM. His research interests are in the fields of digital signal processing and machine learning for intelligent audio analysis. Leonardo Gabrielli got his M.Sc. and PhD de- grees in Electronics Engineering from Universit Po- litecnica delle Marche, Italy , respectiv ely in 2011 and 2015. His main research topics are related to audio signal processing and machine learning with application to sound synthesis, Computational Sound Design, Netw orked Music Performance, Music In- formation Retriev al and audio classification. He has been co-founder of DowSee srl, and holds sev eral industrial patents. He is coauthor of more than 30 scientific papers. JOURNAL OF SELECTED TOPICS IN SIGN AL PROCESSING, VOL. X, NO. X, OCTOBER 2018 13 Stefano Squartini (IEEE Senior Member, IEEE CIS Member) was born in Ancona, Italy , on March 1976. He got the Italian Laurea with honors in electronic engineering from University of Ancona (now Polytechnic University of Marche, UnivPM), Italy , in 2002. He obtained his PhD at the same univ ersity (November 2005). He worked also as post-doctoral researcher at UnivPM from June 2006 to November 2007, when he joined the DII (De- partment of Information Engineering) as Assistant Professor in Circuit Theory . He is now Associate Professor at UnivPM since November 2014. His current research interests are in the area of computational intelligence and digital signal processing, with special focus on speech/audio/music processing and energy management. He is author and coauthor of more than 190 international scientific peer- revie wed articles. He is Associate Editor of the IEEE T ransactions on Neural Networks and Learning Systems, IEEE Transactions on Cybernetics and IEEE T ransactions on Emerging T opics in Computational Intelligence, and also member of Cognitive Computation, Big Data Analytics and Artificial Intelligence Reviews Editorial Boards. He joined the Or ganizing and the T echnical Program Committees of more than 70 International Conferences and W orkshops in the recent past. He is the Organizing Chair of the IEEE CIS T ask Force on Computational Audio Processing. Emanuele Principi was born in Senigallia (An- cona), Italy , on January 1978. He receiv ed the M.S. degree in electronic engineering (with honors) from Univ ersit ` a Politecnica delle Marche (Italy) in 2004. He received his Ph.D. degree in 2009 in the same univ ersity under the supervision of Prof. Francesco Piazza. In November 2006 he joined the 3MediaL- abs research group coordinated by Prof. Francesco Piazza at Univ ersit ` a Politecnica delle Marche where he collaborated to sev eral regional and european projects on audio signal processing. Dr . Principi is author and coauthor of several international scientific peer-revie wed articles in the area of speech enhancement for robust speech and speaker recognition and intelligent audio analysis. He is member of the IEEE CIS T ask Force on Computational Audio Processing, and is re viewer for se veral international journals. His current research interests are in the area of machine learning and digital signal processing for the smart grid (energy task scheduling, non- intrusiv e load monitoring, computational Intelligence for vehicle to grid) and intelligent audio analysis (multi-room voice acti vity detection and speaker localization, acoustic event detection, fall detection).
Original Paper
Loading high-quality paper...
Comments & Academic Discussion
Loading comments...
Leave a Comment