Landslide Geohazard Assessment With Convolutional Neural Networks Using Sentinel-2 Imagery Data
In this paper, the authors aim to combine the latest state of the art models in image recognition with the best publicly available satellite images to create a system for landslide risk mitigation. We focus first on landslide detection and further pr…
Authors: Silvia L. Ullo, Maximillian S. Langenkamp, Tuomas P. Oikarinen
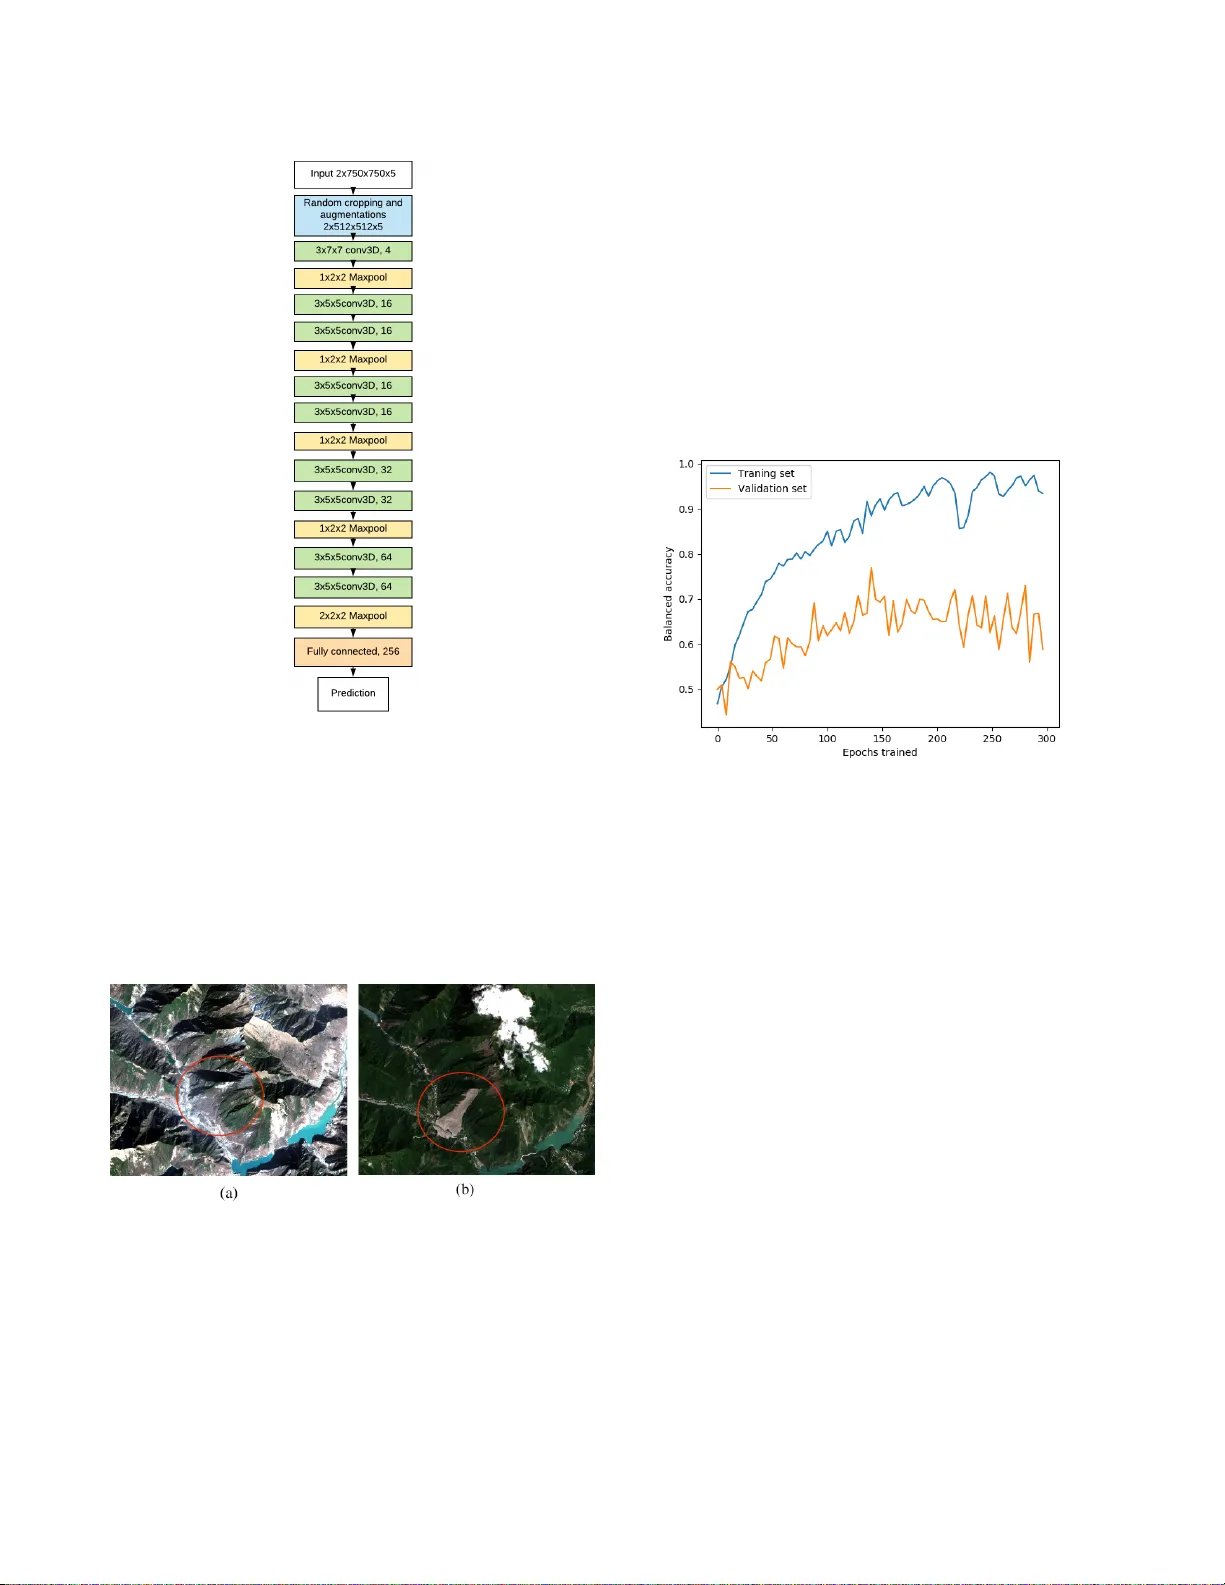
LANDSLIDE GEOHAZARD ASSESSMENT WITH CONV OLUTIONAL NEURAL NETWORKS USING SENTINEL-2 IMA GER Y D A T A S . L . Ul lo 1 , M .S.Lang enkamp 2 , T .P .Oik arinen 2 , M .P .Del Rosso 1 , A.S ebastianel l i 1 , F .P icciril lo 1 , S.S ica 1 (1) Uni versity of Sannio, Benev ento (Italy), ullo@unisannio.it, stefsica@unisannio.it, mariapia.delr osso@gmail.com, alessandr o.sebastianelli1995@gmail.com, federica.piccirillo95@gmail.com (2) Massachusetts Institute of T echnology (MIT), USA, maxnz@mit.edu, tuomas@mit.edu ABSTRA CT In this paper , the authors aim to combine the latest state of the art models in image recognition with the best pub- licly av ailable satellite images to create a system for landslide risk mitigation. W e focus first on landslide de- tection and further propose a similar system to be used for prediction. Such models are valuable as they could easily be scaled up to pro vide data for hazard ev aluation, as satellite imagery becomes increasingly a vailable. The goal is to use satellite images and correlated data to en- rich the public repository of data and guide disaster re- lief ef forts for locating precise areas where landslides hav e occurred. Dif ferent image augmentation methods are used to increase diversity in the chosen dataset and create more robust classification. The resulting outputs are then fed into variants of 3-D con volutional neural networks. A re view of the current literature indicates there is no research using CNNs (Con volutional Neu- ral Networks) and freely av ailable satellite imagery for classifying landslide risk. The model has shown to be ul- timately able to achieve a significantly better than base- line accuracy . Index T erms — Landslide prediction, image pro- cessing, Sentinel-2, deep learning, machine learning, CNNs (Con volutional Neural Networks), geohazard monitoring 1. INTR ODUCTION Landslides are an increasingly significant concern in a world of increasing climate volatility , and there hav e been a number of efforts to improv e the predictive tech- nology around using dif ferent methods to impro ve land- slide monitoring techniques [1, 2]. Landslides often happen without clear warning. Consequences are catas- trophic in terms of human losses. Go vernments are therefore interested in collaborating with researchers to detect landslides and mitigate their effects. So far , methodological in vestigations ha ve been largely fo- cused on using labor -intensi ve preprocessing techniques on less than half a dozen landslides [3]. Authors tried to enhance the work of feature esti- mation accomplished in [4] and [5], moving tow ard the in volv ement of machine learning techniques, such as lo- gistic regression and Support V ector Machines (SVM) [6], used with good results for landslide prediction as demonstrated by a re view of the rele v ant literature [7, 8], [9, 10]. Howe ver , these methods often rely on exact fea- tures of the geographic region such as elev ation, gradient of the slope and soil type or extensi ve preprocessing of the images. A revie w of the current literature indicates there is no research using CNNs (Con volutional Neu- ral Networks) and freely av ailable satellite imagery for classifying landslide risk. Such a model would require fe wer features and less labor-intensi ve preprocessing of the data, yielding a system that requires lower additional ef fort with each set of images. This paper aims to create such a system for the ac- curate detection of landslides. The selection of image recognition model is inspired in part by Krezhe vsky et al. paper [11] on Con volutional Neural Networks, but also prior work using 3-dimensional con volutions, which allo ws the model to learn the dimension of time [12]. T o the best of the authors’ knowledge, com- bination of CNNs (Con volutional Neural Network) and public landslide satellite imagery has not been published and hence this paper serves as a nov el contribution to the field of geohazard assessment. 2. USE OF D A T A The primary focus of this paper has been on catastrophic to large landslides (as defined by the Landslide cata- log) that ha ve occurred from 2015 to 2017, due to data av ailability (explained below). The N ASA Open Data Global Landslide Catalog [13] was used as the starting point for landslides that fit the criteria. It contains co- ordinates, scale (ranging from ’catastrophic’ to ’ small’), date, among other information. Initially , both Sentinel-1 and Sentinel-2 data were analysed for usability . Ho w- e ver , Sentinel-1 images prov ed to be computationally prohibiti ve due to the large amount of preprocessing re- quired. Therefore, it was decided that Sentinel-2 data were better for creating a large database, necessary for training a deep learning model [14]. Since the ESA Copernicus Sentinel-2 [15] optical images suited our purposes most closely , and because the launch of Sentinel-2A happened in June 23, 2015, we only analyzed landslides that occurred after June, 2015. Furthermore, since the catalog ends in Septem- ber , 2017, we did not look at landslides that happened after this date. The landslides were then filtered by size, focusing on the largest first, so that the model could more easily learn an internal representation of a land- slide. Only landslides where the location was known with an accurac y of 1 km or less were used. Images that included noticeable cloud cov erage were also discarded. Among thousands of landslides av ailable in the Global Landslides Catalog, twenty landslides were chosen for preliminary testing. A sample is shown in T able 1. T able 1 . A sample of landslides of interest Location Landslide date Landslide size T ype Latitude Longitude Greenland (Hill near Nuugaatsiaq) 06/17/2017 catastrophic landslide 71,53659933 -53,20874578 California(Mud Creek) 05/20/2017 very large landslide 35,865628 -121,43238 China (V illage of Xinmo) 06/24/2017 catastrophic debris flow 32,08087401 103,6656168 Indonesia (Jalan Melati) 08/19/2016 very large mudslide -6,311708 106,801076 Colombia (Mocoa) 03/25/2017 very large landslide 1,15189804 -76,639923 Switzerland (Piz Cengalo) 23/08/2017 very large debris flow 46,29694 9,595744 UK (Bridgeport and W est Dorset) 29/06/2017 very large landslide 50,70838 -2,75802 Bosnia & Herzegovina (Kakanj) 24/02/2017 very large landslide 44,14354 44,14354 3. PROPOSED MODEL The model is a conv olutional neural network, which per - forms a set of dif ferentiable mathematical operations on the input values, described by the model’ s set of weights, to produce an output. Initially the weights are random- ized, and the network is then trained to minimize the loss function. The loss function in this case is the negati ve log-likelihood loss, described by: L ( X ) = − X x,y ∈X p ( x ) · log ( y ) + (1 − p ( x )) · l og (1 − y ) (1) Where X is our training dataset of image, label pairs and p(x) is the prediction of our model for input x. W e use the backpropagation algorithm and the Adam opti- mizer [16] to repeatedly update the weights in a direc- tion that minimizes the loss function. The model pro- posed is illustrated in Fig. 1. First, it extracts remote sensing data, in the form of Sentinel-2 images and also historical weather data (rainfall, humidity , cloud cover), for preprocessing. During the preprocessing stage, a single landslide im- age is made into multiple images, by taking a randomly sampled window of the original image that still is guar- anteed to contain the landslide. After the preprocessing stage, the images are fed into the CNN model. The CNN contains 8 learned layers. A single input example consists of two images (one image before the landslides, one image after the landslide), each of size 512 by 512 pixels, and an extra dimension of size 5 for the Sentinel-2 bands. W e used Bands 2, 3, 4, 8 and 12 for the le vel of resolution and independent information they provide. This forms a 2x512x512x5 input which is then processed using 3D- con volutions. Additionally , image rotations and flipping were used to increase the number of images to train on. This contributed significantly to the model’ s gains in accuracy . 4. PROPOSED ANAL YSIS In order to train the machine learning algorithms, we do wnloaded sev eral images for each landslide (both be- fore and after the landslide). This allows us first to create multiple pairs to train the detection model, and later to potentially use the sequence of images to train the pre- dicti ve model. W e also used pairings of two images be- fore the landslide as examples where landslides did not occur . The constellation of two satellites (Sentinel-2A and Sentinel-2B) allows us to reach a 5-day geometric re visit time [17]. The images were preprocessed using the Google Earth Engine dev eloper console [18], where the images could be filtered by cloud cov er and cropped by coordinates. An example of the completely processed images is shown in the Fig. 2, where Sentinel-2 images acquired before and after the landslide in Xinmo (China) Fig. 1 . Diagram of model are shown. In the second image the landslide is clearly detectable and even if a cloud is present, the analysis can still be done because the cloud does not cover the area of interest. It’ s worth to say that the images may appear dif ferent just because tak en in dif ferent light conditions. Fig. 2 . An example of Sentinel 2 image acquired before (a) and after (b) the landslide in Xinmo, China (T able 1) The model was trained on 20 dif ferent landslides, using a 5-fold cross v alidation method [19] to corrobo- rate on 4 landslides at a time. For e v aluating the accu- racy we decided to use balanced accuracy , which is the mean of the accuracies on examples from each class (in our case, yes landslide and no landslide). For example a network that predicts ev ery example to be a landslide would achiev e a 100% accuracy on landslides and 0% accuracy on images without a landslide, resulting in a balanced accuracy of 50% regardless of the relati ve fre- quencies of the classes. W e trained our network for 120 epochs with each training set and at the end an av erage balanced accuracy of 0 . 624 was achie ved on detecting landslides, by using also locations that the model has not been trained on. As you can see in Figure 3, these accu- Fig. 3 . Training and Ev aluation Accuracy racies are quite v olatile and significantly higher ev alua- tion accuracies were achieved at points during training. This is most likely due to the small size of our training and e valuation sets. It is important to note that our algo- rithm regardless is able to pick up significant signal after being trained on just a small sample of optical imagery . This is remarkable considering that typical Deep Learn- ing algorithms require at least a few hundred examples from each class [14]. A more large scale approach is likely to achiev e good results. Since there are a lot of dif ferences between distinct locations and images, sig- nificant generalization improv ements could be achiev ed using additional data. 5. FUTURE DEVELOPMENTS The next step in the project development is to detect e ven medium and small size e vents. More images will be necessary . Another important parameter that must be considered is the image resolution. The final Sentinel 2 images ha ve a resolution of 10 × 10 m . A smaller res- olution or further preprocessing may be necessary for accurate landslide prediction. While it is possible to detect landslides based on just optical imagery , it is likely that other types of data such as SAR from Sentinel-1 would be better suited for mon- itoring land movements. Some considerations hav e been already done in [20], where interferometry is used at this aim, and coherence of the images is discussed, as criti- cal issue. Sentinel-1 would allow also to overcome the problem related to cloud coverage, proved to be a signif- icant problem for Sentinel-2 data collection. Moreov er , a system similar to that proposed in this paper , trained on SAR data or on a combination of SAR and optical data, might produce highly accurate results. The prob- lem is that Sentinel-1 data ha ve resulted not a vailable on the period of interest, because of the USA shut do wn. At this end, for future works Sentinel-1 data will be pro- vided by the ESA centre for Earth observation (ESRIN) in Frascati, south of Rome, Italy . Another aspect to e xplore is the possibility to use the software for the classification of different types of past landslides. Landslide classification is primarily based on type of movement (falls, topples, slides, spreads, flows) and type of material (rock, soil, mud and debris) [21]. A model similar to that proposed would likely succeed in this task, given suf ficient amount of examples for each landslide type. 6. REFERENCES [1] S. Lee O.F . Althuw aynee, B. Pradhan, “ Application of an ev- idential belief function model in landslide susceptibility map- ping, ” Comput. Geosci. , vol. 44, pp. 120–135, 2012. [2] Binh Thai Pham, Biswajeet Pradhan, Dieu T ien Bui, Indra Prakash, and M.B. Dholakia, “ A comparati ve study of differ - ent machine learning methods for landslide susceptibility as- sessment: A case study of uttarakhand area (india), ” Envir on- mental Modelling & Softwar e , vol. 84, pp. 240 – 250, 2016. [3] N. Casagli et al., “Landslide mapping and monitoring by us- ing radar and optical remote sensing: Examples from the ec- fp7 project safer , ” Remote Sensing Applications: Society and En vironment , v ol. 4, pp. 92 – 108, 2016. [4] Pia Addabbo et al., “Land cover classification and monitor- ing through multisensor image and data combination, ” in 2016 IEEE International Geoscience and Remote Sensing Sympo- sium (IGARSS) . Beijing, China, 2016, p. 902–905. [5] N. Fiscante, M. Focareta, C. Galdi, and S. L. Ullo, “ Analy- sis and validation of high-resolution satellite DEMs generated from EROS-B data for Montaguto landslide, ” 2012 IEEE In- ternational Geoscience and Remote Sensing Symposium , pp. 7549–7552, July 2012. [6] Corinna Cortes and Vladimir V apnik, “Support-vector net- works, ” Machine Learning , v ol. 20, no. 3, pp. 273–297, Sep 1995. [7] Iswar Das, Sashikant Sahoo, Cees van W esten, Alfred Stein, and Robert Hack, “Landslide susceptibility assessment using logistic regression and its comparison with a rock mass classi- fication system, along a road section in the northern himalayas (india), ” Geomorphology , v ol. 114, no. 4, pp. 627 – 637, 2010. [8] A ykut Akgun, “ A comparison of landslide susceptibility maps produced by logistic regression, multi-criteria decision, and likelihood ratio methods: a case study at izmir, turke y , ” Land- slides , vol. 9, no. 1, pp. 93–106, Mar 2012. [9] T askin Kavzoglu, Emrehan Kutlug Sahin, and Ismail Colke- sen, “Landslide susceptibility mapping using gis-based multi- criteria decision analysis, support vector machines, and logistic regression, ” Landslides , v ol. 11, no. 3, pp. 425–439, Jun 2014. [10] Peng Ling et al., “Landslide susceptibility mapping based on rough set theory and support v ector machines: A case of the three gorges area, china, ” Geomorphology , vol. 204, pp. 287 – 301, 2014. [11] Alex Krizhe vsky , Ilya Sutske ver , and Geoffre y E Hinton, “Im- agenet classification with deep conv olutional neural networks, ” Advances in Neural Information Pr ocessing Systems 25 , pp. 1097–1105, 2012. [12] Shuiwang Ji, W ei Xu, Ming Y ang, and Kai Y u, “3D Con- volutional Neural Networks for Human Action Recognition, ” Advances in Neural Information Pr ocessing Systems 25 , pp. 1097–1105, 2012. [13] “NASA global landslide catalog, ” https://data. nasa.gov/Earth- Science/Global- Landslide- Catalog/h9d8- neg4/data , Accessed: 2019-01-2. [14] Joel Hestness, Sharan Narang, Newsha Ardalani, Gregory F . Diamos, Heewoo Jun, Hassan Kianinejad, Md. Mostofa Ali Patwary , Y ang Y ang, and Y anqi Zhou, “Deep learning scaling is predictable, empirically , ” CoRR , vol. abs/1712.00409, 2017. [15] ESA Sentinel Online, , ” https://www.esa.int/ Our_Activities/Observing_the_Earth/ Copernicus/Sentinel- 2 . [16] Diederik P . Kingma and Jimmy Ba, “ Adam: A method for stochastic optimization, ” CoRR , vol. abs/1412.6980, 2014. [17] “ESA sentinel online, ” https://earth.esa.int/ web/sentinel/missions/sentinel- 2/news/- /article/sentinel- 2- images- the- globe- every- 5- days , Accessed: 2019-01-10. [18] “Google earth engine, ” https://earthengine. google.com/ , Accessed: 2019-01-10. [19] Ron Koha vi et al., “ A study of cross-validation and bootstrap for accurac y estimation and model selection, ” in Ijcai . Mon- treal, Canada, 1995, vol. 14, pp. 1137–1145. [20] S. L. Ullo et al., “ Application of DInSAR T echnique to High Coherence Sentinel-1 Images for Dam Monitoring and Result V alidation Through In Situ Measurements, ” IEEE J ournal of Selected T opics in Applied Earth Observations and Remote Sensing , vol. 12, no. 3, pp. 875–890, March 2019. [21] D. J. V arnes, “Slope mo vement types and processes, ” T rans- portation and Road Resear ch Board, National Academy of Sci- ence, W ashington , https://trid.trb .org/view/86168, 1978.
Original Paper
Loading high-quality paper...
Comments & Academic Discussion
Loading comments...
Leave a Comment