Developing a large scale population screening tool for the assessment of Parkinsons disease using telephone-quality voice
Recent studies have demonstrated that analysis of laboratory-quality voice recordings can be used to accurately differentiate people diagnosed with Parkinson's disease (PD) from healthy controls (HC). These findings could help facilitate the developm…
Authors: Siddharth Arora, Ladan Baghai-Ravary, Athanasios Tsanas
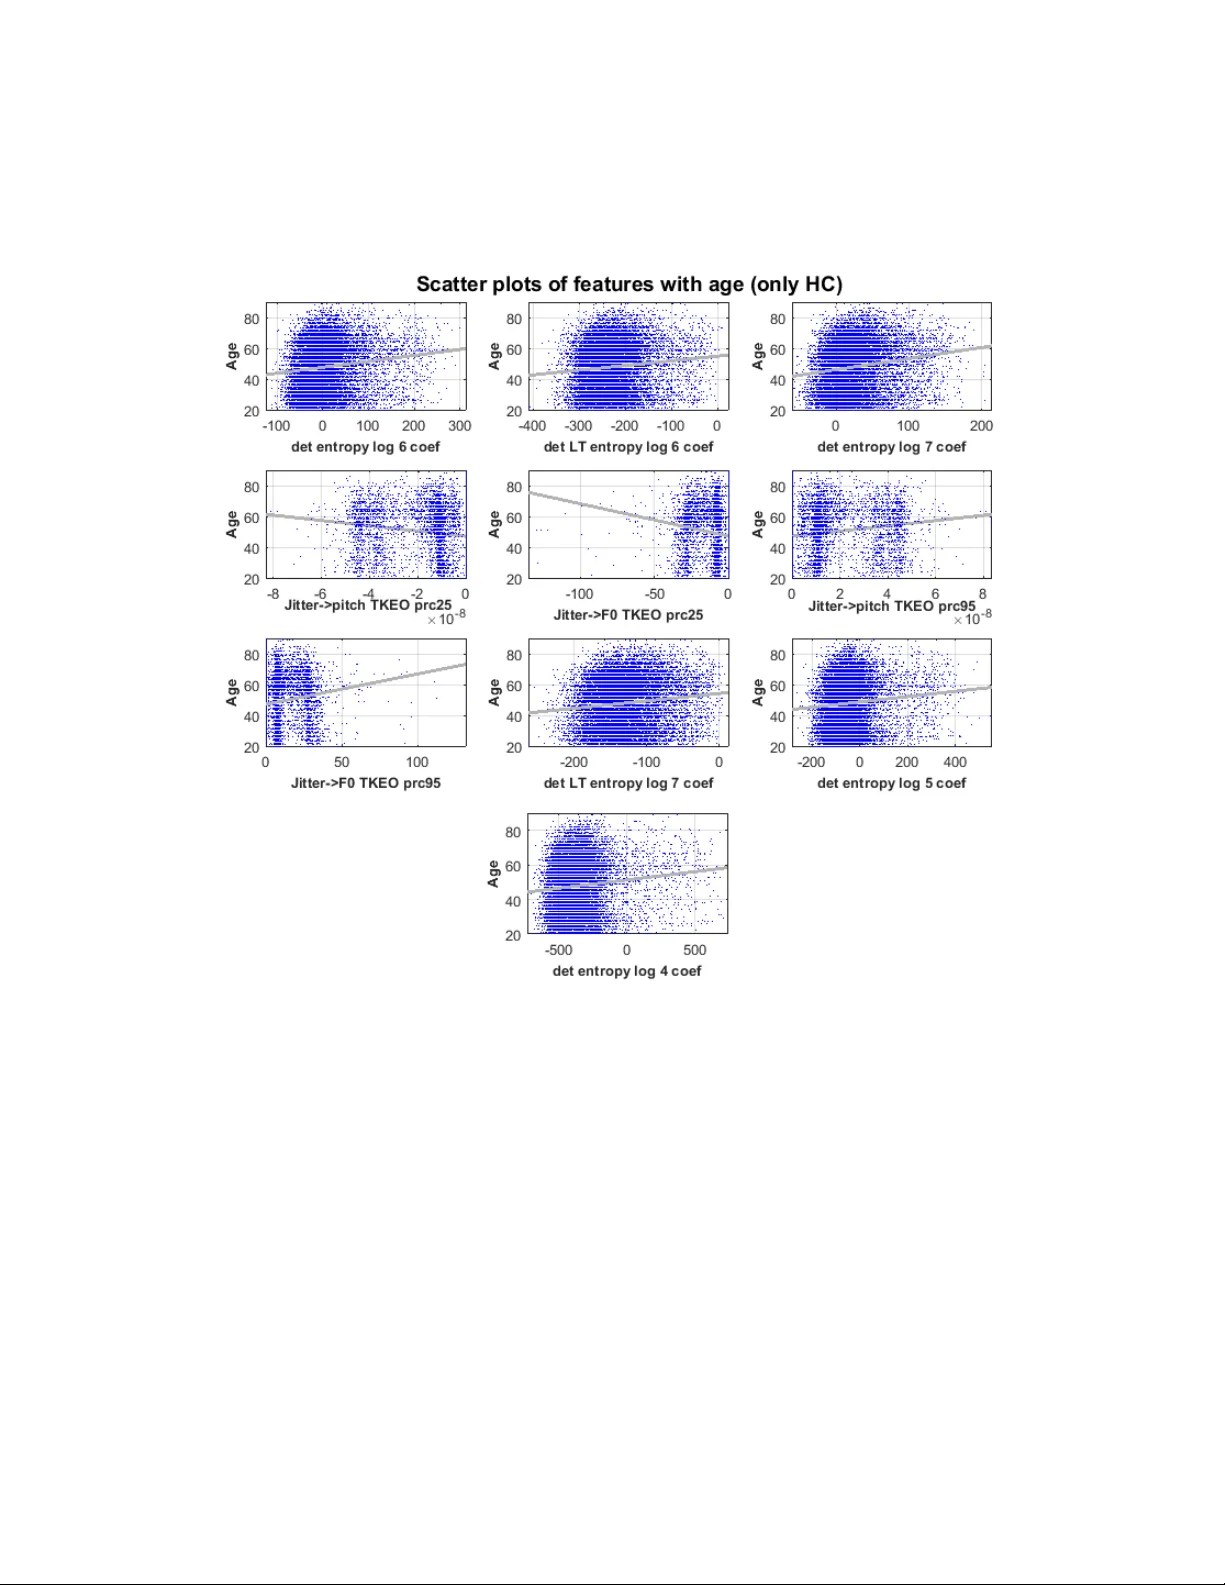
1 Developing a l arge scale popul ation screen ing tool for the assess ment of Parki nson’s disease using telephone-qual ity voice Siddharth Ar ora 1, ¶ , * , Ladan Baghai-R avary 2 , Athanasi os Tsanas 3, ¶ 1 Somerville College , University of Oxford, OX2 6HD, UK 2 Aculab plc, Milton Keynes, MK1 1PT, UK 3 Usher I nstitute of Population Health Sciences and I nformatics, Medical School, University of Edinburgh, EH16 4UX, UK ¶ Denotes equal contribution * Correspond ing Author Siddharth Arora: Siddharth.Arora@maths.ox.ac.uk Contact Inform ation: Siddharth Arora, Somerville College, Woodstock Road, Univer sity of Oxford, Oxford, UK, OX2 6HD Running title: Assess ment of Par kinson’s disease using voice Keywords: Dy sphonia measures; feature selection; Parkinson’s; voice impairment 2 Abstract Recent studies have demonstrated that analysis of lab oratory-quality voice recordings can be used to accurately dif ferentiate people diagnosed with P arkinson’s disease (PD) from healthy controls (HC). These fin dings could help facilitate the development of remote screening and monitoring tools for PD. In this study, w e anal y zed 2759 telephone-quality voice recordings from 1483 PD and 1532 1 recordings from 8300 HC participants. To account for variations in phonetic backgrounds, we acquired data from seven countries. We d eveloped a statistical framework for anal y zing voice, whereb y we computed 307 d y sphonia measures that quantify different p roperties o f voice impairment, such as, breathiness, roughness, monopitch, hoarse voice quality, and ex aggerated vocal tremor. We used feature selection al gorithms to identif y robust parsimonious feature subsets, which were used in combination with a Random Forests (RF) classifier to accurately distinguish PD from HC. The best 10 -fold cross-validation performance w as obtained using Gram -Schmidt Orthogonalization (GSO) and RF, leading to mean sensitivity of 64.9 0% (standard deviation, S D 2.90%) and mean sp ecificity of 67.96% (SD 2.90%). This large-s cale stud y is a step forward towards assessing the development of a reliable, cost-effective and practical clinical decision support tool for screening the population at large for PD using telephone-quality voice. Keywords : Dysphonia measures; feature selection; Parkinson’s; voice impairment. __________________________________________________________________________ 3 I. Introduction Parkinson’s disease (PD) is the second most common neurodege nerative disease, a nd approximately 60,000 people are diagnosed every year in the USA alone; similar incidence rates are reported in Europe (Tanner and G oldman, 1996). Typical characteristic PD sy mptoms include tremor, rigidit y , bradykinesia, and post ural instabilit y ; critically fo r this project, voice and speech qua lity degradation has also been well documented in the PD research literature (Logemann et al., 1978; Harel et al., 2004; Ho et al., 1998; Skodda et al., 2009; Tsanas, 2012; Tsanas et al., 2012; Chen and Watson, 2017). Existing tests for P D assessment and monitoring require the physical presence of the person in the clinic a nd rely on expensive human expertise. It has been estimated that between 2010 and 2030, the number of Medicare beneficiaries a ged over 65 y ears wit h PD in the US A will in crease b y 77% from 300,000 to 530,000 (Do rsey et al., 2013). As the burden of PD is ex pected to shift from developed western countries to developing eastern countries, remote technologies combined with expert neurologist care could considerabl y improve the availability and qualit y of healthcare available to patients. This study proposes i nvestigating novel approaches toward robust, cost-effective, and remote assessment of PD rel ying solel y on voice samples collected over the standard telephone network, hen ce, facilitating its widespread use as a population screening tool. Vocal performance degradation is met in the vast majority of people diagnosed with PD, and may be o ne of the earliest indica tors of disease onset ( Harel et al., 2004). Using high-quality voice re cordings, recent studies have developed technologies to: (1 ) discriminate P D from controls (Little et a l., 2009; Das, 2010; Åström and Koke r, 2011; Luukka, 2011; Tsanas et al., 2012; Chen et al., 2013; Naranjo et al., 2016; Orozco-Arro ya ve 4 et al., 2016; Godino- Llorente et al., 2017; Parisi et al., 2019 ), (2) PD symptom s everity telemonitoring (Tsanas et al., 2011; Eskidere et al., 2012), and (3) monitoring voice rehabilitation in PD (Tsanas et al., 2014b ). Recent studi es have als o investigated the feasibility and efficac y of using smartphone technolog y that extended the u se of voice data to include four additional tests for gait, postural sw ay, dexterit y , and reaction times, to support clinical diagnosis for PD. Specificall y , using a datase t comprising 1 0 PD and 10 HC participants, recorded th ree times dail y for a duration of one mon th using smartphones, an average accurac y of 97% was reported in discriminating PD from HC (A rora et al., 2015 ). A major limitation of that pilot study, however, was that it was conducted with a very small cohort size. The aforementioned studies may be li mited in scaling massively as a pot ential scree ning tool for PD because they rely on expensive specialized equipment to collect the data, t ypically in a labo ratory-based environment. Moreover, these f acilities would not be available in resource-constrained sett ings, thereby limi ting th eir practical use. Also, a vast majorit y of current studies in the research li terature are limi ted in small sample sizes (<100 participants), and t ypica ll y only focus on a group of people from the same phonetic background; pre vious work has emphasized t he need to scale-up results in larg er cohorts and across multiple phonetic backgrounds (Little et al., 2009; Tsanas et al., 2012). In thi s study, we investigate whether telephone -quality voic e recordings collected using readily a vailable standard commer cial c onsumer phones could be used to provide easily accessible, cost-effective means towards r eliable PD assessment. T o the best of our knowledge, this is the largest PD characterization stud y und ertaken using telephone-qu ality voice recordings. 5 The manuscript is organiz ed as follows: in section II we present the proto col used for data acquisition along with data summary. In section III, we pr esent the methods focusing on: (A) data preprocessing, (B) feature ex traction, (C) feature selection (FS), (D) explorator y statistical analy sis, (E) statistical mapping, and, (F ) model ge neralization and va lidation. Section IV presents the out -of-sample 10 -fold cross -validation (CV) results. In s ection V we summarize the key findings of the stud y. II. Data We collected sustained vowel phonations (where participants were prompt ed to pronounce 'aaah …' for as long and as steadily as possible) through telephone -quality digital audio lines, under realistic, non-cont rolled conditions. It is also worth noting that d ysarthria has been commonly associated with PD, as fi rst suggested b y Darley et al. (1969). Interestingly, recent work has also shown that dysarthria can be used to identify participants who are at risk of developing PD, i.e. part icipants with rapid eye movement sleep behavi or disorder (RBD; Rusz et al., 2016). However, given that this stud y involved collecting recordings from participants from 7 different countries, we decided to focus on anal y zing sustained phonations (dysphonia). The r ationale of collecting these vocal sounds lies in the fact that analysing sustained vowel phonati ons circumvents problems associated with running speech, such as accents and linguistic confounds (Titze, 2000). Moreover, the ef ficacy of d y sphoni a analysis for characterizing P D voice has been d emonstrated in our previous work (Tsanas et al., 2010; Tsanas et al., 2011; Tsanas, 2012). The telephone-quality voi ce r ecordings were collected over a standard digital line as part of the Parkinson’s Voice Initiative (PVI) 1 . The vision of PVI was to try and enable radical breakthroughs, through developing voice -based tests as 1 http://www.parkinsons voice.org/ 6 accurate as clinical tests, which can be administered remotely at a low cost. This can be particularly useful for res ource constraint settings. The key obje ctives of PVI are to transform practice by having the following aims: 1) reduce logistical costs associated with diagnosis and monitoring in clinical practice , 2) facilitate high-frequenc y monitorin g that can inform individualized treatment decisions, so as to be able to optimize drug dosage and timing for each individual participants, and, 3) int roduce a cost -effective me ans of m ass recruitment of participants for clinical trials. To collect the recordings, the project advertised a phone number that participants could call within various c ountries, and simple verbal instructions were g iven during the call. Participants provided information rega rding their age, gender, and wheth er a formal clinical diagnosis of PD had been made. An interactive voice response ( IVR) system, using the health insurance portabilit y and accountability act (HIPAA)-compliant Aculab cloud, was used to handle the incoming calls. The calls were anonymous and started with a prompt explaining that the call was going to be recorded for research related to PD , and that more information could be found either by pressing a number on the ke ypad or by g oing to the PVI website. The callers were told to ha ng up the call if they did not want to continue a nd that b y continuing the call the y were giving consent for the use of their dat a for research purposes. They were told that they could end the call at any time if they did not want to continue. Callers were also told that onl y pa rticipants aged 18 or more could take part and a fter asking for their age, an y who were under the age of 18 were thanked and the call ended. Participants with essential tremor we re eli gible to participate and w ere instructed to answer ‘no’ when asked if the y have been diagnosed with P D. The recordings w ere not performed in a clinical context. Participants were entirel y sel f-selected. Further details of the study were made 7 available over the phone on request by t yping a number on the phone’s ke ypad. All recordings were non-ide ntifiable, and no person al information was stor ed. The call lasted about three minutes on average. Two sustained phonations from each participant were recorded, sampled at 8 kHz. The da ta were obtai ned from the following seven geo graphical locations: Argentina (14 4 recordings), Brazil (227 recordings), Canad a (1521 recordings), Mexico (75 recordings), Spain (573 recordings), USA (12675 recordings), and UK (4088 recordings). This resulted in a total of 19,303 voice recordings. Su mmary details about the study w ere made available to pa rticipants b y opti onally p ressing a button when m aking the call; participants were notified that by continuing the call the y would be providing informed consent for their data to be used in this research project. III. Methods III.A Data Pre-processing To determine stated dia gnostic and other participant data, we developed automated speech recognition of some 60,000 responses to prompts (do you have PD, what is your age, what is your gender, etc.). The automated speech recognition was designed using the m el -freque nc y cepstral coefficients (MFCCs) (Mermelstein, 1976) extracted from audio pr ompts and support vector machines (SVMs) . If the accurac y to recognize a prompt using the automated speec h recognition was less than 90% (as quantified using SVMs), we carefully checked each recording manuall y to identify the audio prompts. For feature extraction, we ignored recordings for which the prompt was not clear. Inadequa te len gth of the sustained pho nation can result in some of the 307 features extracted from the voice recordings in being too noisy. Given the low sampling frequenc y of rec ordings (8 kHz), we decided to exclude recordings with phonations less than 2 seconds, as done by previous studies (see Arora et al., 2015; 8 Arora et al., 2018a; Ar ora et a l., 2018b). Af ter sc reening out non-usable recordings, we processed 2759 recordings from 1483 PD participants, and 15321 recordings from 8300 control participants. The s ymptoms (PD/HC) that were s elf-reported by the participants we re treated as the gold standard. Table 1 pr esents the general characteristics and b asic demographics of the parti cipants used in the final anal ysis. The PD and HC cohorts h ad a very similar sex ratio (~44% females). On average the PD participants were older than the controls (Table 1). Usin g the two-sided Kolmogorov-Smirnov test, we could not reject the null h y pothesis that the dist ributions of ag e for the PD and control participants were realizations from the sa me underl y ing dist ribution (at 5% significance level). To investi gate the effect of presb y phonia, we performed additio nal analysis by quantifying the strength of the relationship between the most discriminatory features with participant a ge focusing exclusively on th e HC cohort. Moreover, in order to investigate any pot ential effect of gender differences on classification accuracy, we perf orm analysis for discriminating PD from HC using recordings from: (1) all pa rticipants, (2) onl y female participants, and, (3) onl y male participants. III.B Feature extraction We use the dysphonia measures that we have been rigorously described in our previous studies (Tsanas et al., 2010; Tsanas et al., 2011; Tsanas, 2012). The ra tionale, background, and al gorithms used to c ompute these features are explained in detail in those studies. Here, we summarize these algorithms. For convenience , Table 2 lists the extracted features, grouped together into a lgorithmic “families” of features that share common attr ibutes, along with a brief desc ription of the properties of the speech signals that these alg orithms aim to characterize. The articu lator features extracted from voice recordings characterize the 9 fluctuations and instabilit y of articulators during sustaine d vow el phonation (International phonetic alphabet /a:/), and are not used to characterize dysarthria. A crucial aspect of ex tracting the dysphonia measures is the computation of the fundamental frequenc y ( F0); its computation is often a p rerequisite for the determination of many features. Here, we used the SWIPE algorithm (Camacho and Harris, 2008), which was previously sho wn to be the most robust and ac curate F0 estimation algorithm for sustained vowel /a/ phonations in compre hensive tests using both physiologically pl ausible data obtained using a sophisticated mathematical model, and also using a database with actual phonations where the ground truth was provided by means of electroglottogra phic signals (Tsanas et al., 2014a). Typical examples of features used to characterise sustained phonation s are ji tter and shimmer (Titze, 2000). The motivation for these fea tures is that the voc al fold vibration pattern is nearly periodic in healthy voices wh ereas this periodic pattern is considerably disturbed in pathological cases. Therefore, on average we reasonabl y expect that jitter and shimmer values will be larger in PD participants compared to healthy controls. We remark that there are different definitions of jitter a nd shimmer, sometimes refe rred to as jitter variants and shimmer variants (Tsanas et al., 2011), for example by normaliz ing the dysphonia m easure over a range of vocal fold cycles (time int erval betwe en successive voc al fold collisions). W e investigated many variations of these algorithms that we collectivel y refer to as jitter and s himmer variants (Tsanas et al., 2011; Tsanas, 2012). The study participants did not include individuals with other Parkinsonian or voice-related disord ers. Some of the at ypica l f eature values (such as atypical jitt er and shimme r values) which are broadly associated with voca l impairment cannot thus be used as a biomarke r of PD across 10 the ge neral population based only on the findings of this study. Building on the concept of irregular vibration of the vocal folds, earlier studies have proposed the Recurrence Period Density Entropy (RPDE), the Pitch Period Entropy (PPE), the Glott is Quotient (G Q), and F0- related measures (Little et al., 2009; Tsanas et al. , 2011). RP DE quantifies the uncertainty in the estimation of the vocal fold c yc le duration using the in formation theoretic concept of entropy. P PE uses the log-transformed line ar prediction residual o f the fund amental frequency in order to smooth normal vibrato (normal, small, periodic perturbations of the vocal fold cycle durations which are present in bo th healthy and PD voices), and measures the impaired control of F0 during sustained phonati on. GQ attempts to detect vocal fold cycle durations . Then, we work directly on the variations of the estimated cycle durations to obtain the GQ measures. The F0-related measures (s uch as the standard deviation of the F0 estimates) include the difference in the measured F0 with the expected, healthy F0 in the population for age- and gender-matched controls (Titze, 2000). The second general famil y of dysphonia measures quantifies noise, or produces a signal to noise ratio (SNR) estimate. The physiological motivation for S NR-based measures is that pathological voices ex hibit increased aero-acoustic noise, because of the creation of ex cessive turbulence due to incomplete vocal fold closure. Such measures include the Harmonic to Noise Ratio (HNR), Detrended Flu ctuation Analysis (DFA), Glott al to Noise Excitation (GNE), Vocal Fold Excitation Ratio (VF ER), and Empirical Mode Decomposition Excitation Ratio (EMD-ER). GNE and VFER analyze the full frequency r ange of the signal in bands of 500 Hz (M ichaelis et al., 1997; Tsanas et al., 2011). Additionally, we have created signal to noise ratio measures using energy, nonlinear energy (Teager-Kaiser energy operator) and entr opy concepts whereby the frequencies below 11 2.5 kHz are treated as ‘signal’, and everything above 2.5 kHz treated as ‘noise’ (Tsanas et al., 2011). EMD-ER has a si milar justification: the Hilbert -Huang transform ( Huang et al., 1998) decomposes the original signal into components, where the first components are the high- frequency constituents (in practice equivalent to noise) , and the later components constitute useful information (actual signal). Given the limitations of linear modelling approaches in analyzing speech (Little et al., 2006), we used both linear a nd nonlinear approaches. Finally, Mel Frequency Cepstral Coefficients (MFCC) have long been used in speaker identification and recognition applications, but ha ve shown promise in recent biomedic al voice assessments (Godino-Llorente et al., 2006; Fraile et al., 2009; Tsanas et al., 2011; Tsanas et al., 2014b; Orozco-Arroyave et al., 2016 ). MFCCs do not have a clear physical interpretation regarding the properties of the sp eech signal they capture: broadly they are aimed at detecting subtle changes in the motion of the articulators (ton gue, lips) which can be thought of as complementary additional information to standard vocal fold perturbations (e.g. jitter, shimmer)). Overall, appl y ing the d ysphonia measures gave rise to a 18 080×307 feature matrix . III.C Feature Selection A large numb er of dysphonia measures available in the stud y ma y pot entially lead to performance degradation in the statisti cal mapping phase, a well -known data anal ysis problem known as the curse of dimensionality (Hastie et al., 2009). Although modern state of the art statistical mappin g algorithms are, in general, well-versed in alleviating this problem, even powerful classifiers such as RF ma y suffer in the presence of a high dimensional dataset, and the computational complex ity to train the learners is conside rable. Therefore, it would be particularly useful if the dimensionality of the original set could b e r educed. A reduced 12 feature subset also facilitates inference, facilitating insight into the problem via anal y sis of th e most predictive features (Guyon et al., 2006; Hastie et al., 2009). An exhaustive search th rough all possible feature subsets is computationally intractable, a problem that has led to the development of featu re selection algorithms which offer a rapid, principled approach to reduction of the numbe r of features. FS is a topic of extensive research, and we refer to Guyon et al. (2006) for further details. Combining a s et of different FS al gorithms helps overcome the v ariability associ ated with a single al gorithm (Tsai and Hsiao, 2010). Since each FS technique scores the importance o f features based on a unique criterion, the rankings of the most salient features can va ry subject to the choice of the algorithm. To account for limitations associated with a single FS algorithm, we us ed a range of FS algorithms with a very diffe rent scoring criterion. Specifically, we employed four efficient FS algorithms: (1) minimum Redundancy Maximum Relevance (mRMR) (Peng et al., 2005), (2) Gram-Schmidt Orthogonalisation (GSO) (Chen at al., 1989), (3) RELIEF (Kira and Rendell, 1992), (4) Least Absolute Shrinkage and Selection Operator (LASSO) (Tibshirani, 1996). The mRMR algorithm uses a heuristic criterion to set a trade-off between max imizing relevance (association strength of features with the response) and mi nimizing redundancy (association strength between pairs of features). It is a greedy algorithm (selecting on e feature at a time), which takes int o account onl y pairwise redundancies and neglects complementarity ( joint associa tion of features towards pre dicting the response). The GSO algorithm projects potentiall y useful features fo r selection at each step onto the null space of those features that have already b een selected in previous steps; the feature that is max imally correlated with the t arget in that projection is selected next. The procedure is repeated until the number of desired features has been selected. RELIEF is a 13 feature-weighting algorithm , which promotes features that contribute to the separation of samples from different classes. I t is conceptually related to margin max imization algorithms and has been linked to the k -Nearest-Neighbor classifier (Gilad -Bachrach et al., 2004). Contrary to mRMR, RELI EF us es complementarity as an inher ent part of the FS pro cess. Moreover, we use LASSO that has been shown to have oracle p roperties (correctl y identifying all the ‘true’ features contributing towards predictin g the r esponse) in sparse settings when the featur es are not highl y correlated (Do noho, 2006). However, when the features are correlated, some noisy features (not contributing towards predi cting the response) may still be selected (Meinshausen and Yu, 2009). All aforementioned F S algorithms have shown promising results over a wide range of different application areas. The feature subsets were selected using a cross -validation (CV) approach (see Sectio n III.F), using onl y the training data at each CV iteration, following a votin g methodology that we have previousl y d escribed in Tsanas et al. (2 012; 2014b). We repeated the CV process a total of 10 times, where each time the features ( for each FS algorithm appear in descending order of selection. The feature selection process employed in this stud y comprised of the following ke y stages: (1) Balancing: the fea ture matrix was balanced (b y randomly under-sampling observations from the majority class) to ensure equal representation of recordings from PD and controls, (2) Splitting – the bal anced feature matrix was split into non-overlapping train an d test sets using a 10-fold CV scheme, (3) Selection – the balanced training feature matrix was f ed into the four feature sele ction algorithms specified above (mRMRM, GSO, RELIEF, and LASSO). The above process of balancing, splitting and selection was performed 100 times (10 -fold CV with 10 repetitions). The feature index es which appeared most frequently over the 100 it erations were used to identify the final f eature 14 subset for each FS algorithm. The top-ranked features from each al gorithm were fed as input into the classifier in th e subsequent mapping phase to estimate the b inary outcome. We computed discrimination accuracies using a d ifferent number of top -ranked features to identify the optimum number of features for each FS algorithm. In addi tion, we used the majority voting schem e to combine feature rankings from these four FS algorithms to generate a single composite ranking (Tsanas et al., 2012). W e refer to th e ra nking obtained using this majority scheme as ensemble ranking . III.D Exploratory statistical analysis In order to gain a preliminar y understanding o f th e statis tical properties of the features, we computed the Pearson correlation coe fficient and the mutual information , where the vector contains the value s of a single fe ature for all phonations, and is the associated response. Because the mutual information is not upper bounded, we have follow ed the strategy to obtain the no rmalized mutual information (Tsanas, 2012): the computed was divi ded through with for presentation purposes in order to ensure that it lies between 0 and 1. The l arger the v alue of the no rmalized mut ual information, the stronger th e statistical association between the feature and the response. III.E Statistical mapping The preliminar y exploratory statis tical anal ysis in the previous step provides an indication of the strength of association of each feature with the corresponding re sponse. However, ultimately our aim is to develop a functional relationship , which maps the dysphonia measures , to the response y . That is, we need a binary classifier that will use the dysphonia measures to discriminate HC from PD participants. 15 This particular application is a w ell-studied, hi ghly nonlinear p roblem where simple linear approaches will likely n ot generalize well. Hence, we report finding s using established state of the art ensemble lear ning statisti cal machine learnin g approaches usin g parallel tr ee base learners. The topi c o f en semble learning has received considerable attention in the research literature because of its potential to map highly nonli near settings and p rovide satisfactor y outcomes in complex real-world applic ations (Kuncheva, 2004; Polikar, 2006). S pecifically, we used R F which is extremely robust to the c hoice of its hyper -parameters, and hence we used the default values following Breiman’s suggestion (Breiman, 2001), which g reatl y helped us reduce the computational time associated with the classificati on. Regarding our choice of classifier, in o ur previous studies on objective characterization of PD s ymptoms including voice, we found that the performance of RF to b e quite com p etitive (Arora et al., 2015; Arora et al., 2018a; Arora et al., 2018b; Tsa nas et al., 2011; Tsan as et al., 2012; Tsanas et al., 2014b). Moreover, RF have been shown t o be fa irl y insensitive to the choice o f two hyper-parameters (Breiman, 2001): (a) the nu mber of trees should be fairl y large (due to which we choose 500 trees, which is the default suggestion), and, (b) the number of features considered to construct each bran ch of a given tree (we chose the square root of the total number of features, which again is the default suggestion). It is due to the aforementioned reasons that we employed RF in this study. III.F Model generalization and validation Validation in this context aims at an estimate of the generalization performance of the classification based on the d y sphonia features, when presented with novel , previousl y unse en data. The tacit statistical assumption is that the new, unseen data will have a similar joint distribution to the data u sed to tr ain the classifie r. Most studi es achieve th is validation using 16 either CV or boots trap techniques (Bishop, 2 007; Hastie et al., 2009). In th is study, we used a 10-fold CV scheme, where the original data wa s split into two subsets: a training subset comprising 90% o f the data, and a testing subset comprising 10% of the d ata. The dat a was balanced at each CV iteration to account for the d ifference in PD and HC c ohort size. The 10- fold CV process was repeated a total of 10 times, where on each repetition the original dataset was randoml y permuted prior to splitting into training and testin g subsets. On each repetition, we computed the sensitivit y, specificity, accuracy, and balanced accuracy . Errors over the different CV repetitions were averaged, and the process was repeated for a different number of input features (5, 10, 25, 50, 75, 100, 150, 20 0, 250, 307) select ed using four different FS schemes (mRMR, GSO, RELI EF, LASSO) and an ensemble ranking. Figure 1 summarizes the complete methodology . IV. Results The summary measures differe d sli ghtly between the two groups (PD and HC). The out - of-sample classification accuracy quantified using two different performance s cores (sensitivity a nd specificity) e mplo y ing all, fe male , and male recordings a re presented in Figures 2, 3 and 4, respectively. The se figures show that the best classification accur ac y is obtained using RF-GSO, with overall accurac y figures b eing in the range of 64 -68 % (SD~2%). We quantify the binary classificati on performance for different number of input features, using four FS schemes. Th e discriminati on accuracies obtained using only about 50 - 100 features were compara ble with the accuracy achieved usin g all 307 features (as evident from Figures 2-4). This is encouraging as a reduced feature subs et n ot onl y facilitates inference via analysis of the most pr edictive features, but it a lso increases the likelihood of 17 any diagnostic support tool developed using this framework to have pra ctical relevance b y reducing the associated computational costs. In addition to using a RF classifier, we used a random classifier (naïve classifier) as a benchmark that w e aim to outperform, and this is particularly r elevant in cases of unbalanced data. The random classifier benchmark is akin to diagnosing a subj ect as having PD based on flipping an unbiased coin. Specifically, this c lassifier assumes P PD : P HC = 0.5:0.5, where P PD is the probabilit y of a subject being diagnosed as having PD, while P HC is the probability of a subject being identified as a HC . For example, a subject is classified as having PD if the outcome of a fair coin t oss is head; else, the su bject is identified as a HC . Given that w e balance the d ataset before training and testin g, the chance level for classifying a subject as either PD or control is 50%. The classification accuracy obtained using RF is statistically significantly better than the accurac y obtained u sing the naïve random classifier, which as expected, resulted in an accuracy of ~50%. We perf ormed additional anal ysis to try and gain better insight int o voc al im pairment in PD by identifying a suboptimal feature sub set using high-qualit y voice recordings. Specifically, we ex tracted features from 263 voice samples collect ed from 43 participants (33 PD and 10 controls), whereby the recordings were colle cted in an industrial acoustics company ( IAC) sound-treated booth with a he ad-mounted mic rophone (see Tsanas et al. 2012). As opposed to 8Khz recordings used in this PVI stud y, Tsanas et al (2012) used recordings sampled at 44.1Khz. We selected a subset of 10 highly ranked fea tures fr om the Tsanas et al (2012) dataset and tested the efficac y of these 10 f eatures on the PV I dataset. Using top 10 salient features from the Tsanas et al (2012) dataset, we achieved a me an balanced a ccuracy of 59.2% (SD 2%) on the PVI dataset (as presented i n Table 3). This is 18 very similar to accuracy obtained using top features identified using only the PV I dataset (mean balanced acc uracy of 63.7% (S D 1.8%)). Table 3 provides detail s of the selected feature subsets identified using the FS algorithms in this stud y . We remark that there is some similarity in the top selected features from the di fferent FS algorithms, which inspires some confidence in tentatively interpreting findings. Table 4 summarizes the association strength metrics for the most strongly correlated dysphonia measures with the re sponse. Table 5 summarizes findings in the research literature and this study. The results are presented in the form mean ± standard d eviation where appropriate. In Table 5, SVM stands for support vector machine, GP-EM for genetic programming an d the expectation - maximization algorithm, E-M for expectation max imization algorithm, and RF -GSO for random forests with Gram-Schmidt orthogonalization scheme. Hitherto, all studi es used high- quality data collected where the voice si gnals were recorded under carefully controlled conditions (e.g. head -mounted microphone, and often I AC booths). This study uses a considerably larger database with data collected under highly non-controlled conditions. We remark that, until now, studi es in the r esearch literature t ypically u se high -qualit y voice samples that were recorded in an IAC sound-treated booth with a he ad-mounted microphone; therefore t he results are not directly comparable. Nevertheless, we wanted to survey the res earch literature on the reported accuracy in controlled lab orator y s ettings, since this is the only setting against which the current stud y ’s findings could be contrasted. Table 6 summarizes the classific ation performance result s of this stud y . The best performance using RF and mR MR, an d, RF and RELIEF, was obtai ned using all 307 features, while for RF and GSO, using 100 key identified features gave the best performance (sensitivit y = 64.90%±2.90%; specifi city = 67.96 %±2.90%; ba lanced accurac y = 66.43%±1.83%). Using 19 LASSO, emplo y ing 200 features resulted in the best performance, while ensemble ranking with 100 features resulted in the highest accurac y. Al though the s ex ratio for PD and control cohorts are very similar (0.4322 and 0.4481, respectivel y ), to account for any potential differences in sex, we co mputed sensitivi ty and specificit y separately for all recordings, onl y female recordings, and onl y male recordings ( as presented in Table 6). Using only female recordings (1199 recordings from 641 PD pa rticipants and 6922 recordings from 3719 controls), the highest accurac y was obtained using RF -LASSO with (sensitivity = 65.23%±4.48%; specificity = 63.44 %±3.92%; balanced accurac y = 64.34%±2.98%). Similarly, using only male recordings (1560 recordings from 842 PD participants and 8399 recordings from 4581 c ontrols), the highest accuracy was obtained using RF-GSO with (sensitivity = 67.29%±4.01%; specificity = 70.28%±4.12%; b alanced accuracy = 68.79%±2.75%). As evident from T able 6, the accuracies obtained using all recordings and sex-specific recordings were quite similar. The sensitivit y , sp ecificity, accurac y and bal anced accuracy results differed f rom comparable r esults obtained fr om randomized predictions (denoted as Random Classifier in Table 6) regarding class membership ( p < 0.05, two-sided Kolmogorov-Smirnov test). Moreover, we also checked for potential bias in the results by randomizing the labels ( i.e. dissociating the relationship between the ta rget variable and the co rresponding labels). Randomizing the labels resulted in an average classification accuracy of ~50% (SD 2%). Although the expected chance level for a bina ry classification problem in a balanced dataset is 50%, we felt it was important to validate our findings ag ainst naïve benchmarks (su ch as random classifier, and random forest applied to dataset after randomiz ing labels), as it has been demonstrated that a pplying signal classificat ion to Gaussian random signals can result in 20 accuracies of up to 70 % or hi gher in binar y class problems with small sample sets (Combrisson and Jerbi, 2015). Moreover, as a benchmark, we used a Naïve Ba yes (NB) classifier as it is relativel y eas y to c onstruct, has low computational costs , and has be en shown to be competitive with sophisti cated techniques (Domingos a nd Pazzani, 1997; Kononenko, 1993; Shree and S heshadri, 2018). Using all recordings, the NB classifier achieved the hi ghest average b alanced accuracy of 59.1% (SD 2.3%). Wh ereas, using female and male recordin gs with the NB classifier, the average ba lanced accuracy was 59.7% (SD 3.0%) and 60.9% (SD 4.8%), respectively. For al l pairwise compar isons, the discrimination results obtained usin g RF were considerabl y better than the corresponding accuracies obtained using randomized predictions and a NB classifier (Table 6). Finally, following a r eviewer’s comment we wanted to investigate whether there is an y relationship between the most strongly associ ated features with the clinical outcome (presented in Table 4), to explore whether th ose features might be useful in assessing presbyphonia. Figure 5 suggests that the dysphonia measures explored in this study could potentially be used to assess presb yphonia, and further work could investigate in further detail the differenc e between normative values as a function of a ge across those dysphonia measures and the difference observed in PD. V. Discussion This study investigated the potential of using telephone-qualit y voice recordings for discriminating PD participants from control participants. It is the largest PD charac terization study undertaken usin g telephone-qualit y voic e recordings, and is a step towards establishing the developed methodolo gy for p ractical use in screening the population at large for PD. We remark that pr evious studies in the research literature were considerably more limited in the 21 number of pa rticipants; moreover, the y relied on high-quality data typically recorded under highly controlled condi tions (sound-treated booth, head-mounted microphone, built -for- purpose equipment) and used expert clinical diagnosis as the ground truth. We report a s ensitivity of 64.90%±2.90% and specificit y of 67. 96%±2.90% in differentiating PD from controls on a balanced dataset. This result is considerably worse compared to studies in the literature that reported almost 98% accuracy in the same application using high -quality data (Tsanas et al. , 2012), however, it is crucial to apprec iate that the results reported in this study have been obtained: (1) using data collected in a home environment without an y supervision or prior trainin g, whi ch results in extraneous background noise and a variety of differe nt user behaviors (such as, dista nce of phon e from the mouth, volume of sustained phonation etc.) ; (2) using a standard tele phone network that results in recordings at low sampling frequency (8KHz), which can result s in a small number of observations per r ecording to be used for f eature extraction; (3) f rom participants who self - reported their s ymptoms (as either PD/HC), and thus we cannot rule out the presence of a variety o f clinical-pathologic differences in voice withi n this cohort. We remark that most previous studies have t y pically collected data in a laborator y -environment using high-quality microphones in sound-treated booths that mi nimize background noise, whereby the clinical assessments are done by experts. Despite the simplicity of our experimental desig n, we emphasize that our findings may have a considerable pr actical impact in resource-constrained settings and for readil y available, cost-effective screening of the population for PD when lacking specialized facilities. Compared to other studies that have looked into the same problem, we have found considerably lower correlations between the features and the binary response. For example, 22 Tsanas et al. (2012) h ad reported that some features exhibited correlation c oefficient magnitudes that were over 0.3, i.e. correlations that may be considered statistically strong in the medical domain (Tsanas et al., 2013). Therefore , these exploratory ana l y sis findings already suggested that the classification performance in thi s study would likel y be worse compared to previous studies. We have used four robust, widely studied FS algorithms to identify feature subsets (Table 3). Overall, we note that the algorithms are broadly in agreement towards t he selected features (or feature families). We remark that feature s which are related to F0 and frequenc y variability tend to dominate. This is not surprising, since participants may have been holdin g their phone’s mi crophone at different distances from their mouth, which would have af fected the recorded amplitude (t herefore, dysphonia measures quantif y ing frequenc y aspects that can be considered more robu st). S imilarly , some of the MF CCs were selected, in accordance to previous studi es that have reported that MFCCs empirically work wel l in biomedical signal processing applications (Godino-Llorente et al., 2006; Tsanas et al., 2011). It is difficult to interpret the ph ysica l meaning of MFCCs: broadly, low er MFCCs quantify the amplitude and spectral envelope and higher MFCCs quantif y info rmation about harmonic components. Interestingly, some of the nonlinear me asures which have pr eviously worked ver y well under the controlled setting se tups have not been selected amongst the top choice s of the FS algorithms. We attribute this to the fact t hat the nonlinear d ysphonia measures rel y on highly sensitive characteristics of the speech signals. Further work is warranted to verify th e present study’s finding s and det ermine whether the nonlinear d ysphonia measures suffer in settin gs where we lack hi gh -qualit y voic e signals, and in cases where we have bandlimited and potentially noisy recording environments. 23 We remark that in this study we have focused exclusivel y on the sustained vowel /a/ and the extraction of dysphonia measures . Dysarthria is a key characteristic in PD and can be assessed using conversational speech. It is possible that MFCC might be capturing some of the dysarthric components, which mi ght explain, at least in p art, their success in similar biomedical applications. Future work could look into whether the information extracted from sustained vowels using MFCCs is associated with d y sarthria s ymptoms that can be ex tracted from conversational speech. The statistical mapping used in this stud y falls under the standard sup ervised lea rning umbrella with a binar y classification setting. As such, there is a multitude of available statistical machine learning algorithms (e. g. see Hastie et al., (2009) for an overview) that aim to identify a functional mapping of the feature set to the response (in this study, the bin ary outcome of PD vs controls). Future studi es could ex periment using SVMs, Gaussian processes, boosting approaches (Adaboost and other robust boosting approaches) an d compare th ese results reported usin g RF. It would be potentially interesting to also experiment using the probabilistic outcomes of the various classifiers, and use their outputs as features in the second layer of classifiers. The findings of this study warrant further investigations to better understand the effect of noise and low sampling rate on voice for distinguishing PD and c ontrols. Moreover, future studi es could investiga te automated voice segmentation and noise removal algorithms for preproc essing the voice recor dings collected under non-clinical settings. We envisage this study as a step towards the lar ger goal of technologies for developing diagnostic decision support tools in P D. Furthermore, we remark that the healthy subjects in previous studies did not have an y pathological vocal s ymptoms when assessed b y expert 24 speech scientists (e.g. see Tsanas et al., 2012). One of the major limitatio ns of this study is that it did not include individuals with other Parkinsonian or voice-related disorders that may be more difficult to differentiate from PD. It is, however, possible that thi s stud y might include a cohort of subjects with potential PD -like voca l sy mptoms, who do not qualify for PD diagnosis otherwise. The proposed methodology cannot b e readil y v alidated or used in a general population a s a screening too l for PD, as there a re dif ferent ty pes of dysphonia against which validation needs to be pe rformed. It is also worth highlighting that the vocal pathologies associated wit h PD are complex; differences have been reported recently in voice impairment between participants with idiopathic PD and leucine- rich repeat kinase 2 ( LRRK2 )-associated PD (Arora et al., 2018b), while there is also evidence of sp eech impairment in participants who are at risk of developing PD, i.e. participants with RBD (Rusz et al., 2016). LRRK2 is the greatest known genetic factor associated with PD (Hea l y et al., 2008), while RBD is the strongest known predi ctor for PD (Iranzo et al., 2013). I t can be envisaged that the PD participants who took part in this stud y could eith er be idiopat hic or LRRK2 -associated, while thi s stud y mi ght also include a cohort of control participants with potential PD-like vocal symptoms (including idi opathic RBD), who do not qualify for PD diagnosis otherwis e. Hence, althou gh this study did not ex plicitly foc us on a broad range of vocal pathologies associated with other Parkinso nian or voice-related disorders, one cannot rule out the presence o f PD and control participants who exhibit a variet y of clinical - pathologic diff erences in voice within this cohort . We remark that this study onl y looked into the problem of binar y differentiating PD from HC , which builds upon previous work on voice impairment in PD (see A rora et al., 2015; Åström and Koker, 2011; Guo et al., 2010; Little et al., 2009; Orozco- Arroyave et al,. 2016; Tsanas et al., 2011; Tsanas et al., 2012; Tsanas et al., 25 2014b ). I t would be interesting to use a very large database includin g voices from diverse disorders, where the use of sophisticated dysphonia measures might assist in determining the underlying pathology among st a wide set of possible diagnoses. Ackno wl edgm ents We are grateful to M.A. L ittle who led the PVI where the data for this study was collected. We would like to extend our sinc ere gratitude to all the participant s who took part in the PVI study. The stud y was made possible throu gh generous funding via an EP SRC-NCSML award to SA and AT. Conflict of intere st None to declare. 26 References Arora S., Venkataram an V., Zhan A., Donohue S., Biglan K.M., Dorsey E.R., Little, M.A. “Detecting and monitoring the symptoms of Parkinson' s disease using smartphones: A pilot study”, Parkinsonism and R elated D isorders , Vol.21, 650-653, 2015 Arora S., Baig F., Lo C., Barber T.R., Law ton M.A., Zhan A., Rolinsk i M., Ruffmann C., Klein J.C., Rum bold J., Louvel A., Z aiwalla Z., Lennox G., Q uinnell T., Dennis G., Wade- Martins R., Ben- Shlomo Y., Li ttle M.A., Hu M.T. “Smartphone motor testing to di sting uish idiopathic REM slee p behavior disorde r, controls, and PD”, N eurology , Vol. 91, e1528- e1538, 2018a Arora S., Visanji N.P., Mestre T.A, Tsanas A., AlDakheel A., Connolly B.S., Gasca-Salas C., Kern D.S., Jain J., Slow E.J., Faust-Socher A., Lang A.E., Little M.A., Marras C. “Inv estigating voice as a biomarker for leucine-rich repeat kinase 2-a ssociated Parkinson’s d isease”, Journa l of Parkinson's disea se , Vol. 8, 503- 510, 2018b Åström F., and K oker R. “A parallel neural netwo rk approach to predict ion of Parkinson’s d isease”, Expert Systems w ith Applications , Vol. 38, 1 2470 – 12474, 2011 Bishop C.M. Pa ttern recognition and mach ine learning , Spring er New York, 2007 Breiman L. “Rand om forests”, Mach ine learning , Vol. 45, 5- 32, 2001 Camacho A., Harris J.G. “A sawtooth waveform inspired pitch estim ator for speech and music”, Journal of the Acoustical So ciety of Am erica , Vol. 124, 1638- 1652, 2008 Chen S, Billings S.A., Luo W. “Orthogonal least squares methods and their application to no n-linear system identifica tion”, Internationa l Journal of Contr ol , Vol. 50, 1873- 1896, 1989 Chen H -L., Huang C-C., Yu X-G., Xu X., Sun X ., Wang G., Wang S - J. “An ef ficient diagnosi s system for detection of Parkinson’s diseas e using fuzzy k -nearest neighbor approach”, Exper t Systems with App lications , Vol. 40, 26 3 – 271, 2013 Chen Y- W., Watson P. J. “Speech product ion and sensory i mpairm ent in mild Parkinson's disease”, The Journal of the Acou stical Society o f America , Vol. 141, 3030- 3141, 2017 Combrisson E., J erbi K. “Exceeding chance level by chanc e: The caveat o f theoretical chance levels in brain signal classification and st atistical assessment of decoding accuracy”, Journal of Neuroscience Me thod s, Vol. 250, 126- 36, 2015 27 Darley F.L., Aronson A.E., Brown J .R. “Differential diagnostic patterns of dysarthria”, Journal of Speech and Hearing Resea rch , 12, 246 – 269, 1969 Das R. “A comparison of multiple classification methods for diagnosis of Parkinson disease”, Expert Systems with Appli cations , Vol. 37, 15 68 – 1572, 2010 Doming os P., Pazz ani M. “On the optimality of the simple Bayesian classifier un der zero - one loss”, Machine Learning , 29, 103 – 130, 1997 Donoho D. “For m ost larg e underdet ermined sy stems of equations, the m inimal L1 -norm nea r-solution approximates the sparsest near - solution”, Comm. Pure and Applied Mathematics , Vol. 59, 904-934, 2006 Dorsey E.R., George B.P., Leff B., Willis A.W. “The coming cr isis: Obtaining care for t he growing burden of neurodeg enerative cond itions ”, Neurology , Vol. 80, 19 89-1996, 2013 Eskidere Ö., Ertas F., Hanilçi C. “A comparison of regression methods for remote tracking of Parkinson’s disease progressio n”, Expert Systems wit h Applications , Vol. 39, 5 523 – 5528, 2012 Fraile R., Saenz-Lechon N., Godino-Llorente J .I., Osma- Ruiz V., Fredouille C. “Automatic detection of laryngeal patholog ies in records of sustained vowels by m eans of m el-frequency cepstral coefficient parameters and differentiation of patients by sex”, Folia phoniatrica et logopaedica , Vol. 61, 14 6-152, 2009 Gilad- Bachrach R., Navot A., Tishby N. “Margin based feature selection - theory and algorithm s”, 21st International Con ference on Machin e learning (IC ML), 43-50, 2004. Godino-Llorente J.I., Gomez-Vilda P., Blan co- Velasco M. “Dimensionality reduction of a path ological voice quality assessment system bas ed on Ga ussian mixture models and sho rt-term cepstral p arameters”, IEEE Tra nsactions on Biomed ical Engineering , Vol. 5 3, 1943-1953, 2006 Godino-Llorente, J. I., St attuck-H ufnagel, S., Choi, J. Y., Mor o-Velazquez, L., Gomez-Garcia, A. “Towards the identifica tion of idiopathic Parkinson’s disease f rom the speech. New articulatory k inetic biomarkers”, PLOS One , Vol. 12, e 0189583, 2017 Guo P - F. , Bhattacharya P., Kharma N. “Advances in detecting Parkinson’s disease”, Medical Biometr ics, Lecture Notes in Com puter Science , Vol. 616 5, 306-314, 2010 Guyon I., Gunn S., Nikravesh M., Zadeh L. (Eds.) , Feature Extraction: Foundations and Applica tions , Springer Berlin, 2006 28 Harel B., Cannizzaro M., Snyder P.J. “Variability in fundamental frequency dur ing speech in prodromal and incipient Parkinson’s disease: A longitudinal case study”, Brain and Cognition , Vol. 56, 24-29, 2004 Hastie T., Tibshirani R., Friedm an J. T he elements of statistical learning: data mining, inference, and prediction , Spring er New York, 2 nd ed., 2009 Healy D.G., Fal chi M., O'Sullivan S.S., Bonifati V ., Durr A., Bressman S., Brice A., Aasly J ., Zabetian C.P., Goldwurm S., Fer reir a J .J., Tolosa E., K ay D.M., Klein C., Williams D.R., Marras C., Lang A.E., Wszolek Z.K., Berciano J ., Schapira A.H., Lynch T., Bhatia K.P., Gasser T., Lees A.J., Wood N.W.; International LRR K2 Consortium., “Phenotype, genotype, and worldwide genetic pene trance of LRR K2-associated Pa rkinson's di sease: a case- control study”, Lancet Neurology , Vol 7, 583-590, 2008 Ho A., Iansek R., Marigliani C., Bradshaw J ., Gates S. “Speech impairm ent in a large sample of patients with Parkinson' s disease”, Behavioral Neur ology, Vol. 11, 131- 137, 1998 Huang N.E., Shen Z., Long S.R., Wu M.C., Shih H.H., Zheng Q., Yen N.C., Tung C.C., Liu H.H. “The empirical mode decomposition and the Hilbert spectrum for non-linear and non- stationary time series ana lysis”, Proceedings of th e Royal Society London A , Vol. 454, 903- 995, 1998 Iranz o A., Tolosa E., Gelpi E., Molinuevo J .L., Valldeorio la F., Serradell M., Sanchez-Valle R., Vilaseca I., Lo meña F., Vilas D., Lladó A., Gaig C., Santamaria J. “Neurodegene rative disease status and post-mortem pathology in idiopathic rapid-ey e-movement sleep behav iour disorder: an observational cohort study”, Lancet Neu rology, Vol. 1 2, 443-453, 2013 Kira K., Rendell L. “A pract ical approach to featur e selection”, I n D. Sleeman and P. Edwards (Eds.) Proceedings of the Nin th Internationa l Conference on Machin e Learning (ICML-92), 249- 256, Morgan Kaufm ann San Francisco, 199 2 Kononenko I. “Inductive and Bayesian learning in medical diagnosis,” Applied Artificial Intelligence an International Journ al , 7, 317- 337, 1993 Kuncheva L.I . Combining pattern classifiers: methods and algorithms , Wiley Ne w Jersey, 2004 Little M.A., McSharry P.E., Hunter E.J., Spielman J ., Ramig L.O. “Suitability of dysphonia measurem ents for telemonitoring of Parkinson’s di sease”, IEEE Transactions Biomedical Engineering , Vol. 56, 10 15- 1022, 2009 29 Little M.A., McSh arry P.E., Moroz I.M., Robert s S.J. “ Testing the assumptions of linear prediction analysis in normal vowels”, The Journal of the Acoustical Society of America , Vol. 119, 549- 558, 2006 Loge mann J.A., Fisher H.B., Boshes B., Blonsky E.R. “Frequency and coocurrence of vocal tr act dysfunctions in the speech of a l arge sample of Parkinson patients”, Journal of Speech and Hearing Disorder s , Vol. 43, 47- 57, 1978 Luukk a P. “Feature selection using fuzzy entropy measures with similarity classifier”, Expert Systems with Application s , Vol. 38, 4600- 4607, 2011 Meinshausen N., Yu B. “Lasso -type recovery of sparse representations for hig h - dimensional data”, Annals of Statist ics , Vol. 37, 246- 270, 2009 Me rmelstein P. Distance measures for speech reco gnition, psychological and instrumental , in Pat tern Recognition and Artificia l I ntelligence, C. H. Chen, Ed., Academ ic, New York, 374 -388, 1976 Michaelis D., Frohlich M., Strube H. W. “Glottal to noise excitation r atio - a new measure for describing pathological v oices”, Acustica/ac ta acustica , Vol. 83, 700-706, 1997 Naranjo L., Pérez C.J., Campos- Roca Y., Martín J . “Addressing voice recording replications for Parkinson’s dis ease detection”, Expert Sys tems with A pplications , Vol. 46, 286- 292, 2016 Orozco-Arroy ave J. R., Hönig, F., Arias-Londoño J. D., Varg as-Bonilla J. F. , Daqrouq K., Skodd a S.,Rusz, J. Nöth E. “Autom atic detection of Parkinson’s disease in running speech spoken in three different languages”, The Journal of t he Acoustical Society of America , Vol. 139, 481 - 500, 2016 Parisi L., RaviChandran N., Lyne Manao g M. “Feature -driven machine l earning to i mprov e ear ly diagnosis of Park inson’s disease”, Expert Sy stems with Appli cations , Vol. 110, 182- 190, 2019 Peng H., Long F., Ding C. “Feature selection based on mutual i nform ation: criteria of max -dependency , max-relev ance, and min- redundancy”, IEEE Transactions on Pattern Analysis and Machine Intelligence , Vol. 27 , 1226-1238, 2005 Polikar R. “Ensemble based systems in decision making ”, I EEE Circuits and Systems Magazine , Vol. 6, 21-45, 2006 30 Rusz J., Hlavni čka J ., Tykalová T., Buškov á J., Ulmanová O., Růžička E., Šonka K. “Quanti tative assessment of m otor spee ch abnorm alities in idiopa thic REM sleep beha viour di sorder” , Sleep Medicin e , 19, 141 – 147, 2016 Shree S.R.B., Sheshadri H.S. “Diagnosis of Alzheimer’s disease using naive Bay esian classifier”, Neural Computing and Ap plications , 29, 123 – 132, 2018 Skodda S., Rinsche H., Schlegel U. “Progression of dysprosody in Parkins on’s disease over time – A longitudinal study ”, Movement Disorders , Vo l. 24, 716- 722, 2009 Tanner C.M., Goldman S.M. “Epidem iology of Parkinson's di sease”, Neu rologic Clinics , V ol. 14, 317 - 335, 1996 Tibshirani R. “Regression Shrinkage and Sele ction via the LASSO”, Journal of the Royal Statistica l Society B , Vol. 58, 267- 288, 1996 Titze I.R. Principles of Voice Product ion . Na tional Center for V oice and Spe ech, Iow a City, US, 2 nd printing, 2000 Tsai C.F., Hsiao Y.C . “Com bining multiple featur e selection methods for stock prediction: Union, intersection, and m ulti- intersection appr oaches”, Decision Suppor t Systems , Vol. 5 0, 258-269, 2010 Tsanas A., Little M.A., McSharry P.E., Ramig L.O. “New nonlinear markers and insights into speech signal degrada tion for effective t racking of Park inson’s disease symptom severity”, International Sympos ium on Nonlinear Th eory and its Appl ications (NOL TA), 457-460, Krakow, Poland, 2010 Tsanas A., Little M.A., McSharry P.E., Ramig L.O. “Nonlinear speech analysis al gorithm s mapped to a standard metric achieve clinically useful quantification of average Parkinson’s disease symptom severity”, Journal of the Roya l Society Interface , Vol. 8, 842- 855, 2011 Tsanas A., Little M.A., McSharry P.E., Spielman J., Ramig L.O. “Novel speech signal processing algorithms for high- accuracy classification of Parkinson’s disease”, IEEE Transactions on Biomedical Enginee ring , Vol. 59, 1264- 1271, 2012 Ts anas A. Accurate telemonitoring of Parkinson's disease symptom severity using nonlinea r speech signal processing and statistical machine learning , D.Phil. thesis, Univ ersity of Oxford, UK, 2012 31 Tsanas A., Little M.A., McSharry P.E. A methodology for the analysis of medica l data , in Handbook of Systems and Com plexity in Health, Eds. J.P. Sturmberg, and C.M. Martin, Springer New York, pp. 113- 125 (chapter 7), 2013 Tsanas A., Zañartu M., Little M.A., Fox C., Ramig L.O., Clifford G.D. “Robust fundamental freque ncy estimation in sustained vow els: detailed algorithmic com parisons and information fusion with adaptive Kalman filtering”, Journal of the Acoustical Society of America , Vol. 135, 2885 - 2901, 2014a Tsanas A., Little M.A., Fox C., Ramig L.O. “Obj ective auto matic assessm ent of rehabil itative spe ech treatment in Park inson’s disease”, I EEE Transactions on Neural Systems and Rehabili tation Engineering , Vol. 22, 18 1-190, 2014b 32 TABLE 1 B ASELINE CHARACTERISTICS OF ALL STUDY PARTICIPANTS Characteristics Parkinson’s Disease Par ticipants Control Participants A. All participants # of participants 1483 8300 Mean age (standard dev.) 62.87 years (11.41 years ) 47.74 years (15.69 years ) % Female 0.4322 0.4481 # of voice rec./participant 1.86 1.85 # total usable recording s 2759 15321 B. Female participants # of participants 641 3719 Mean age (standard dev.) 62.05 years (11.61 years ) 49.90 years (15.02 years ) % Female 1 1 # of voice rec./participant 1.87 1.86 # total usable recording s 1199 6922 C. Male par ticipants # of participants 842 4581 Mean age (standard dev.) 63.49 years (11.22 years ) 45.98 years (16.01 years ) % Female 0 0 # of voice rec./participant 1.85 1.83 # total usable recording s 1560 8399 33 TABLE 2 B REAKDOWN OF THE 307 DYSPHONIA MEASURES USED IN THIS STUDY Family of dysphon ia measures Brief description Number of measures Jitter var iants F0 perturbat ion 28 Shimmer var iants Amplitude pe rturbation 21 Harmonics to noise ratio (HNR) and noise to harmonics ratio (NHR) Signal to noi se, and noise to signal ratios 4 Glottis quo tient (GQ) Vocal fol d cycle duration cha nges 3 Recurre nce period density e ntropy (RPDE) Uncertai nty in estimation of fundamental frequenc y 1 Detrende d fluctuation an alysis (DFA) Stochasti c self-similarity o f turbulent noise 1 Pitch per iod entropy (PPE) Inefficienc y of F0 control 1 Glottal to noise excitati on (GNE) Extent of n oise in speech us ing energy and nonlinear energy concepts 6 Vocal fol d excitation ratio (VFER) Extent of n oise in speech us ing energy, nonlinear energy, and entr opy concepts 9 Empirical mode decompositi on excitation r atio (EMD-ER) Signal to noi se ratios using EMD-base d energy, nonlinear energy and entropy 6 Mel Freque ncy Cepstral Coe fficients (MFC C) Amplitude and spectral fl uctuations 42 F0 -related meas ures Summary stat istics of F0, Di fferences from expected F0 in age- and sex- matched co ntrols, variatio ns in F0 3 Wavelet de composition measur es Decomposit ion of the F0 co ntour to derive transient c haracteristics 182 Algorithmic expression s for the 307 measur es summarized here are described in detail in Tsanas (2012). F0 re fers to fundamental frequency e stimates. 34 TABLE 3 S ELECTED FEATURE SUBSETS AND CLASSIFICATI ON PERFORMANCE M RMR GSO RELIEF LASSO E NSEMBLE R ANKING T SANAS ET AL 2012 mean HNR {17} 6 th delta M FCC {12} HNR {17} J itter (TKEO 25% pitch) {4} HNR {17} 10 th detailed wavelet coef. std TKEO {176} Log energy (M FCC) {49} 6 th detail ed wavelet coef. log entro py of F 0 {1}the F0 Log energy (M FCC) {49} J itter (TKEO 95% pitch) {6} Log energy (M FCC) {49} 4 th detailed wavelet coef. std TKEO {170} Jitter (TKEO o f 25% F 0 ) {5} Standard dev iation of the TKEO of 1 st approximate wavelet c oef. {168} J itter (TKEO 95% pitch) {7} Jitter mean TKEO pitch {222} J itter (TKEO 95% pi tch) {6} VFER SNR-TKEO {73} J itter (TKEO 95% pi tch) {6} Standard dev iation of the TKEO of 2 nd approximate wavelet c oef. {166} J itter (TKEO 25% pitch) {4} J itter (TKEO 5% pitch) {269} J itter (TKEO 25% pi tch) {4} HNR {17} Jitter (TKEO o f 95% F 0 ) {7} 0 th MFCC coef {28} 6 th detail ed wavelet coef. lo g (F 0 ) entropy {2} Jitter st d. TKEO pitch {285} Jitter (TKEO o f 25% F 0 ) {5} VFER SNR-TKEO {71} J itter (TKEO 25% pi tch) {4} J itter (TKEO 95% pi tch) {7} 6 th detail ed wavelet coef. lo g entropy of F 0 {1} Jitter abs olute pitch {146} 6 th detail ed wavelet coef. log entro py of F 0 {1} GNE std. {61} 6 th detail ed wavelet coef. log entro py of F 0 {1} 4 th MFCC coef . {27} Jitter (TKEO o f 95% F 0 ) {7} Jitter pi tch PQ5 {304} Jitter (TKEO o f 95% F 0 ) {7} 12 th MFCC coef . {94} 6 th detail ed wavelet coef. Energy of lo g F 0 {177} 1st delt a MCC coef. {13} 7 th detail ed wavelet coef. lo g (F 0 ) entropy {8} 1 st detail ed wavelet coef. Ener gy of log F 0 {304} Jitter abs olute pitch {146} 6 th detail ed wavelet coef. mean TKEO {162} 6 th detail ed wavelet coef. Energy of F 0 {261} 9 th MFCC coef . {40} 7 th detail ed wavelet coef. (F 0 ) entropy {3} 10th delt a-delta MFCC {109} Jitter pi tch PQ5 {304} 11 th MFCC coef . {32} Mean TKEO of 6 th detaile d wavelet coef. {201} Difference F 0 and age- & gender-matched F 0 {18} Jitter (TKEO o f 25% F 0 ) {5} 9th delt a-delta MFCC {114} Jitter mean TKEO pi tch {222} Jitter pi tch PQ5 {304} 60.1%±1.9% 63.7%±1.8% 59.4%±2.0% 60.1%±2.1% 60.9%±2.1% 59.2%±2.0% The last row present s the % balan ced accuracy (computed as the mean of specificity and sensitivity) when the top ten selected features from each algorithm are fed into the classifier. The results are given in the form mean ± standard deviation an d ar e out of sa mple compu ted u sing 10 -fold cross validation with 10 repetitions using a balanced dataset. The number in curly brackets ‘{}’ indicates th e rank of the correlation of the feature with the binary outcome (PD vs HC ) wh en computin g the correlation coefficient for all 307 f eatures, e.g. {2} would sugg est that this was the second most correlated feature with t he outcome. 35 TABLE 4 S TATISTICAL ANALYSIS OF THE DYSPHONIA FEATURES Dysphonia measure Correlation coefficient Entropy of the 6 th detail wavelet dec omposition coefficient ο f the F0 0.11±0.00 Entropy of the 6 th detail wavelet dec omposition coefficient ο f the l og-transformed F0 0.10±0.00 Entropy of the 7 th detail wavelet dec omposition coefficient ο f the F0 0.10±0.00 Jitter TKEO 25 th percentile of pitch -0.09±0.00 Jitter TKEO 25 th percentile of F0 -0.09±0.00 Jitter TKEO 95 th percentile of pitch 0.09±0.00 Jitter TKEO 95 th percentile of F0 0.08±0.00 Entropy of the 7 th detail wavelet dec omposition coefficient ο f the l og-transformed F0 0.08±0.00 Entropy of the 5 th detail wavelet dec omposition coefficient ο f the F0 0.08±0.00 Entropy of the 4 th detail wavelet dec omposition coefficient ο f the F0 0.08±0.00 Ten features most strongly associated with the respons e, sorted u sing the magnitude o f the correlation coefficient. All reported correlation s were statistically s ignificant (p < 0.001) . We used a ja ck-knife appro ach by randomly sampling the over-pop ulated class to obtain balanced datasets and compute th e correlati ons; the results are in the form mean± std from 100 repetition s. Also, the results of th e Mann Whitney statistical te st suggest all r elationships are statistically significant (p < 0.001 ) . The response was ‘0 ’ for healthy con trols and ‘1’ f or people with Parkin son’s disease. Thus, positive correlation coef ficients suggest that th e dysphonia measure take s, in general, large r valu es for Parkinson’s disease p honations. 36 TABLE 5 C LASSIFICATION ACCURACY OF STUDIES IN THE LITERATURE AND THIS P APER Study Study population an d brief details Learning and validation scheme Reported accuracy (%) Little et al., 2009 31 participants (23 PD ), 195 phonations recorded in an IAC sound-treated booth using a head-mounted microp hone. Use of sustained /a/ vo wels Support vector machine (SVM), bootstrap with 50 replicates 91.4 ± 4.4 Guo et al., 2010 31 participants (23 PD ) from the study of Little et al. (2009). Genetic programming an d expectation maximization (GP-EM), 10-fold cros s- validation 93.1 ± 2.9 Das, 2010 31 participants (23 PD ) from the study of Little et al. (2009). Neural Network, 65% data for training, rest for testing 92.9 Åström and Koker, 2011 31 participants (23 PD ) from the study of Little et al. (2009). Neural Network, 60% data for training, rest for testing 91.2 Tsanas et al., 2012 43 subjects (33 PD), 263 phonations, recorded in an IAC sound-treated b ooth using a head-mounted microphone. Use of sustained /a/ vowels SVM, 10-fold cross - validation 97.7 ± 2.8 Chen et al., 2013 31 participants (23 PD ) from the study of Little et al. (2009). Principal component analysis and fuzzy k - nearest neighbour b ased model, 10-fold cro ss- validation 96.07 Orozco-Arroyave et al ,. 2016 Data from Spanish, German, and Czech cohorts. 100 n ative Spanish speakers (50 P D), 176 German speakers (88 PD), 36 Czech speakers (20 PD) . Use of continuous speech, and pa/ta/ka tests SVM, 10 -fold cross - validation, and leave one speaker out 85 to 99 This study* 9783 subjects (1483 PD ), 18080 phonations colle cted under non -controlled conditions using the stan dard telephone system. Use of sustained /a/ vowels RF -GSO, 10-fold cro ss- validation 66.4 ± 1.8 37 TABLE 6 C LASSIFICATION ACCURACY USING SELECTED FEATURE SUBSETS AND DIFFERENT CLASSIFICATI ON SCHEMES USING ALL RECORDINGS C LASSIFIER + F EATURE S ELECTION M ETHOD S ENSITIVITY S PECIFICITY A CCURACY B ALANCED A CCURACY A. ALL RECORDINGS RF -mRMR (307 Features) 63.9 %±3.0% 67.4 %±3.0% 65.7 %±2.2% 65.7%±2.2% RF -GSO (100 Features) 64.9%±2.9% 68.0%±2.9% 66.4%±1.8% 66.4%±1.8% RF -RELIEF (307 Features) 63.9%±3.0% 67.4%±3.0% 65.6%±2.2% 65.6%±2.2% RF -LASSO (200 Features ) 64.1%±2.9% 68.0%±2.4% 66.1%±1.8% 66.1%±1.8% RF -Ensemble Ranking (100 Features) 64.1%±2.6% 68.3%±2.2% 66.2%±1.6% 66.2%±1.6% Naïve Bayes-GSO 60.9%±3.8% 57.2%±3.7% 59.1%±2.2% 59.1%±2.3% B. FEM ALE RECORDINGS RF -mRMR (307 Features ) 65.1%±4.8% 63.4 %±4.2% 64.2 %±3.3% 64.2%±3.3% RF -GSO (150 Features) 64.9%±4.4% 63.7%±4.7% 64.3%±3.1% 64.3%±3.2% RF -RELIEF (307 Features) 65.1%±4.8% 63.4%±4.2% 64.2%±3.3% 64.2%±3.3% RF -LASSO (150 Features ) 65.2%±4.5% 63.4%±3.9% 64.3%±2.9% 64.3%±3.0% RF -Ensemble Ranking (307 Features) 65.1%±4.8% 63.4%±4.2% 64.2%±3.3% 64.2%±3.3% Naïve Bayes-GSO 52.8%±4.8% 66.5%±3.9% 59.6%±3.1% 59.7%±3.0% C. MALE RECORDINGS RF -mRMR (307 Features ) 64.4%±4.0% 69.8 %±3.7% 67.1 %±2.6% 67.1%±2.6% RF -GSO (25 Features) 67.3%±4.0% 70.3%±4.1% 68.8%±2.8% 68.8%±2.8% RF -RELIEF (150 Features) 64.2%±3.8% 70.1%±3.6% 67.1%±2.5% 67.1%±2.5% RF -LASSO (150 Features ) 65.8%±3.7% 69.0%±3.7% 67.4%±2.5% 67.4%±2.5% RF -Ensemble Ranking (150 Features) 65.1%±3.8% 70.4%±3.8% 67.7%±2.7% 67.8%±2.7% Naïve Bayes-GSO 47.5%±16.8% 74.4%±8.8% 60.4%±5.3% 60.9%±4.8% The results are presented in th e form mean ± standard deviation where appropriate. For each feature selection scheme, the number of key f eatures that give th e b est classification results (as quantified using the balanced accuracy) are reported in brackets. Model performance (in %) was quan tified using sensitivity = TP/(TP+FN), specificity = TN/(TN+FP), accu racy = (TP+TN)/(TP+FP+FN+ TN), and balanced accu racy = (sensitivity + specificity)/2, where TP d enotes tru e positive, TN denotes true n egative, FP d enotes false p ositive, an d FN denotes false negative. For a given perfor mance measure, the h ighest classification a ccuracy is highlighted in bold . 38 F IGURE C APTIONS Figure 1 . Schemat ic diagram illustrating the procedure for collect ing voice recordings (sustained vowel ‘ aaah ’), using a stand ard telephone network, along with the major steps involved in the statistical dat a analysis. Step 1 involves collecting voice samp les fro m controls and part icipants with PD. The raw voice recordings are pre -processed in order to ident ify the participant prompts and discard non-usable recordings (unclear prompts or insufficient phonation length). Step 2 involves extract ing features (or summary measures) that quantify key properties of voice such as: reduced loudn ess, breathiness, roughness, monop itch, and exaggerated vocal tremor, which are commonly associated with voice impairment in PD. Step 3 identifies t he key features, using four feature selec tion techniques. Step 4 involves mapping the key id entified features onto a clinical assessment (PD/Control). Th e o ut- of -sample classification accuracy is measure d using a 10 -fold cross-validation scheme on a balanced dat aset. Abbreviations: DFA = detrended fluctuation analysis; = fund amental f requency; P D = Parkinson’s disease; RPDE = recurrence period density entropy. Figure 2 . Ou t- of -sample comparison of the feature selection algorithms obtained using all recordings (2759 recordings from 1483 PD participants, and 15321 recordings from 8300 control par ticipants), ba sed on learner perf ormance (binary -class classification datasets) using Random Forests ( RF). The classificat ion accuracy is computed o n a balanc ed -dataset u sing 10- fold cross-validation scheme with 10 repetitions. The classification accura cy is quantified usin g sensitivity (%) and specificity (%), whereby sensitivity = TP/(TP+FN) and specificity = TN/(TN+FP), where TP denotes true positive, TN denot es true n egative, FP denotes false positive, and FN denotes false negative. The horizontal ax is denotes the different nu mber of features (10, 25, 50, 75, 100, 15 0, 200, 250, 307) selected across all four feature selection algorithms and the ensemble ranking scheme. 39 Figure 3 . Out - of - sample comparison of the feature selection algorithms obt ained u sing only female recordings (1199 recordings f rom 641 PD p articipants, and 69 22 recordings from 37 1 9 control p articipants), based on learner performance (binary-class classific ation datasets) using Random Forests ( RF). The classificat ion accuracy is computed o n a balanc ed -dataset u sing 10- fold cross-validation scheme with 10 repetitions. The classification accuracy is quantified using sensitivity (%) and specificity (%). The horizontal axis denotes the different number of features (10, 25, 50, 75, 100, 150, 200, 250, 307) selected across all four feature selection algorithms and the ensemble ranking scheme Figure 4 . Out - of - sample comparison of the feature selection algorithms obt ained u sing only male recordings (1560 recordings f rom 842 PD part icipants, and 8399 recordings f rom 4581 control p articipants), based on learner performance (binary-class classific ation datasets) using Random Forests ( RF). The classificat ion accuracy is compute d o n a balanc ed-dataset u sing 10- fold cross-validation scheme with 10 repetitions. The classification accuracy is quantified using sensitivity (%) and specificity (%). The horizontal axis denotes the different number of features (10, 25, 50, 75, 100, 150, 200, 250, 307) selected across all four feature selection algorithms and the ensemble ranking scheme Figure 5 . Scatter plots to visually assess the relationship between the most strongly associated dysphonia measures with clinical outcomes (summarized in Table 4), to explore whether those could be used to assess presbyphonia. 40 F IGURE 1. 41 F IGURE 2. F IGURE 3. 42 F IGURE 4. 43 F IGURE 5.
Original Paper
Loading high-quality paper...
Comments & Academic Discussion
Loading comments...
Leave a Comment