Quality-based Pulse Estimation from NIR Face Video with Application to Driver Monitoring
In this paper we develop a robust for heart rate (HR) estimation method using face video for challenging scenarios with high variability sources such as head movement, illumination changes, vibration, blur, etc. Our method employs a quality measure Q…
Authors: Javier Hern, ez-Ortega, Shigenori Nagae
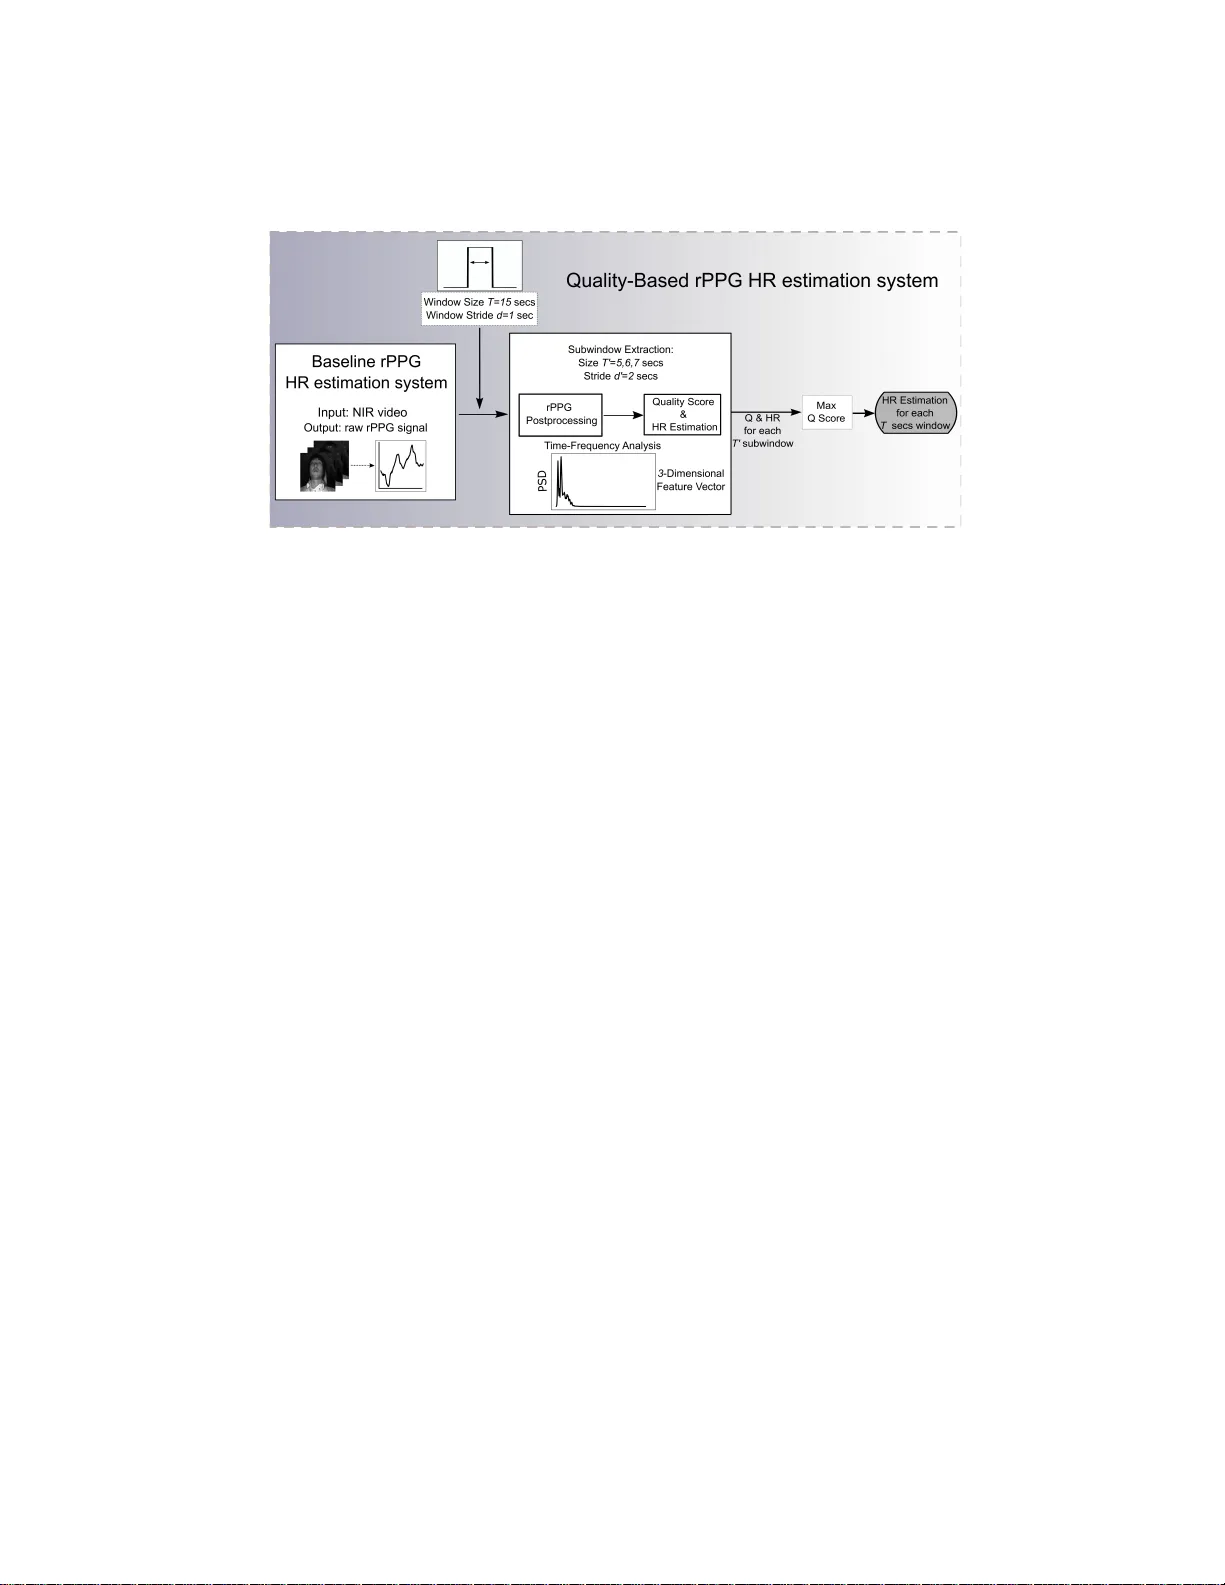
Qualit y-based Pulse Esti mation from NIR F ace Video with Applicatio n to Driv er Monitoring Javier Hernandez-Or tega 1[0000 − 0001 − 6974 − 3900] , Shigenori Nagae 2 , Julian Fierrez 1 [0000 − 0002 − 6343 − 5656] , and Aythami Mor ales 1 [0000 − 0002 − 7268 − 4785] 1 Universidad Autonoma de Madrid, Madrid, Spain { javier.h ernandezo, julian.fi errez,aythami.morales } @uam.es 2 OMRON Corporation, Kyoto, Japan shigenori.nag ae@omron. com Abstract. In t his p aper w e develop a robu st for heart rate ( HR) esti- mation metho d using f ace video for c h allenging scenarios w ith high v ari- abilit y sources such as head move ment, illumination changes, v ibration, blur, etc. Our meth o d employs a qu alit y measure Q to extract a remote Plethysmo graphy (rPPG) signal as clean as p ossible from a sp ecific face video segment. Our main mo tiv ation is developing robust tec hnology for driver monitoring. Therefore, for our exp eriments w e use a self-collected dataset consisting of Near Infra red (NIR) videos acquired with a camera mounted in the dashboard of a real moving car. W e compare the p er- formance of a classic rPPG algorithm, and t he p erformance of the same metho d , but using Q for selecting whic h v id eo segments present a lo w er amount of v ariabilit y . O ur results sho w that using the v ideo segments with the highest quality in a realistic driving setup improv es the H R estimation with a relativ e accuracy impro vemen t larger than 20%. Keywords: Remote Plethysmogr aphy · Driver Monitoring · H eart R ate · Qualit y Assessment · F ace Biometrics · NIR Video 1 In t ro duction T raffic accidents hav e b eco me one of the main non-natural causes of death in to day’s s o ciety . The W orld Health Orga nization (WHO) published a rep or t in 2018 [18] declar ing that 1 . 35 millions o f pe o ple die annually all over the w orld due to traffic acciden ts, even b ecoming the main caus e of death a mo ng young po pulation (those under 30 years old). Some types of traffic accidents can not b e predicted by a ny manner b ecause they o ccur due to exter nal factor s such as bad w eather, ro ads in p o or condition, mechanical issues, etc. How ever, there is still a high amount o f accidents caused by human factors that c a n be av oided [14]. F or example, fa tigue is one of the most common causes of accidents, and it is also one o f the most preven table. Drivers ex per iencing fatigue hav e a decr ease in their vis ual p erception, reflexes, and psychomotor s k ills, and they may even fall asleep while driving. 2 J. Hernandez-O rt ega et al. In order to reduce the num b er of accidents, driver monito ring has a ttracted a lot o f r esearch attention in the recent years [12,7,3]. A driver mo nito ring sys tem m ust b e able to detect the presence of signals rela ted to fatigue, a llowing to take pr e ven tive actions to av o id a pos sible acc ident. Some of these actions ar e recommending the driver to stop in a rest area unt il he is fully recov er ed, and displaying a coustic and luminous w arnings inside the car to keep the dr iver aw ake until he ca n stop. Driver monito r ing systems may follow different ways for achieving their tar - get. Some of them use infor mation abo ut the wa y the driver is conducting the car, i.e. mov ement s of the steering wheel, status o f the pe da ls, etc [11]. Physio- logical signa ls such a s the heart rate (HR), the blo o d pres sure, the brain activity , etc, can a lso b e used to detect fatigue in the driver [10]. A monitoring s ystem capa ble of e s timating physiological comp onents suc h as the hea rt ra te, or the blo o d pressure , may present a dditional b enefits. Thes e systems could b e able not only to detect signs o f fatigue, but also changes in the dr iver’s gener al hea lth co ndition. This kind of mo nitoring systems allow to acquire a nd pr o cess health infor ma tion daily and non-intrusiv ely . The ca ptured data can b e used to help do ctors to ma ke b etter dia gnostics, or even for rec om- mending the driver to visit a practitioner if a p otential health is s ue is detected. The accur ate extraction of physiological sig nals in a re a l driving scenario is still a challenge. There exist differen t appro a ches dep ending of the a cquisition metho d, i.e. contact-based and imag e-based, each one with its own strengths and weaknesses. In this pa per w e fo cus in improving the p erfor mance of an image- based metho d by introducing a quality a s sessment algo rithm [2]. The ta r get o f this alg orithm is selecting the video s equences mor e favorable to a sp ecific hea rt rate estimation metho d, in a kind of quality-based pro ce ssing [6]. The r est of this pap er is or ganized as follows: Section 2 intro duces dr iver monitoring techniques, with fo cus in r emote photoplethysmography and its chal- lenges. Section 3 d escrib es the prop osed system. Section 4 summarizes the dataset used. Section 5 descr ibe s the ev alua tion pro to c ol and the results o btained. Fi- nally , the co ncluding remarks and the future work ar e drawn in Section 6. 2 Driv er Monitoring T e c hniques Early research in driver monitoring was mostly based on acquiring accurate ph ysiologic a l sig nals fr om the drivers using contact sensor s (e.g . E CG, EE G, or EMG), but this a pproach may re sult uncomfor table and imprac tica l in a realistic driving environment. Some par ameters that can b e obtained this wa y are the heart rate, respiratio n, brain activity , muscle activ ation, corp ora l temper ature, etc. Some works re la ted to this appr oach are [10] and [16]. Contactless approaches are more conv e nie nt for its use in r eal driver monitor- ing without b other ing the driver with ca bles and other uncomforta ble dev ices. Regarding this approximation, computer v ision techniques result really pr acti- cal since they use ima ges acq uir ed non-inv as ively from a camera mounted inside the vehicle. These images can b e pro cess ed to analyze physiological par ameters Quality-based rPPG HR Estimation for Driver Monitoring 3 T able 1. Se lection of works related to pulse extraction and/or driv er monitoring using contac t sensors or images. Method Type of Data Parameters Extracted Per formance T arget Brandt et al. 2004 [4] RGB and NIR Video Head Motion and Eye Blinking N/A Driver F atigue Shin et al. 2010 [16] ECG Heart Rate N/A Driver F atigue Jo et al. 2011 [9] NIR Video Head Pose and Eye Blinking Accuracy = 98.55% D river Drow siness and Distraction Poh et al. 2011 [15] RGB Video Heart and Breath Rate, HR V ariab. RMSE = 5.63% Physiologi cal Measurement Jung et al. 2014 [10] ECG Heart Rate N/A Driver Drowsi ness T asli et al. 2014 [17] RGB Video Heart R ate, HR V ariab. MAE = 4.2% Physiologi cal Measurement McDuff et al. 2014 [13] RGB-CO Video Heart and Breath Rate, HR V ariab. Correlation = 1.0 Physiologi cal Measurement Chen et al. 2016 [5] RGB and NIR Video Heart Rate RMSE = 1.65% Physiologi cal Measurement Present W ork NIR Vi deo Heart Rate MAE = 8.76% Driver Monitoring using re mo te pho topleth ysmogra phy (rPPG). With this technique it is p ossi- ble to estimate the hear t r ate, the oxygen satura tion, and other pulse related information using o nly video sequence s [15]. 2.1 Remote Photoplethysmograph y Photoplethysmography (PPG) [1] is a low-cost technique for meas uring the car - diov ascular Blo o d V olume Pulse (BVP) throug h changes in the amount of lig h t reflected or absor be d b y human vessels. PPG is often used at hospitals to mea- sure ph ysiologica l pa rameters like the hea rt r ate, the blo o d pressure, or the oxygen sa turation. PPG signals are usually b e measure d with co ntact sensors often placed at the fingertips, the chest, or the feet. This type of contact mea- surement may be suitable for a c linic environment, but it can b e unco mfo r table and inconvenien t fo r daily driver mo nito ring. In recent works like [15], [17], [13], and [5] r emote photoplethysmography techn iques hav e bee n used for measuring ph ys io logical s ignals from face video sequences captured at dista nce. These works used s ignal pro cessing techniques for analyzing the images, and loo king for slig ht c o lor and illumination c hanges related with the BVP . How e ver, using these methods in a real moving vehicle is not straig htforward due to all the v ariability sources present in this t ype of video sequences. A selection of works related to driver monitoring and photo- pleth ysmogra ph y is s hown in T a ble 1. 2.2 Challenges and Prop osed Approac h A moving vehicle is not a p erfect environmen t for obtaining hig h accuracy when using rPP G a lgorithms. Images a cquired in this scenario ma y present e x ternal illumination changes, low illumination levels, noise, mov emen t of the driver, o cclusions, and vibrations o f the ca mer a due to the mov ement of the vehicle. All these factor s can make the p e rformance of the rP PG algor ithms to dr o p significantly [2]. In this work we prop ose a system for pulse estimation for driver monitor ing that trie s to overcome some of these challenges. W e use a NIR c amera with active infrared illumination mounted in the dashboa rd of a real moving ca r. The NIR 4 J. Hernandez-O rt ega et al. sp ectrum band is highly inv ar iant to ambien t light, pr oviding r obustness a g ainst this external source of v a riability a t a low cos t. This also allowed us to extend the a pplication of hea rt ra te estimation to very low illumination en vironments, e.g. nig h t co nditions. Regarding to the presence of o ther v ariability factors such as mov emen t or o cclusions, a quality-based appro a ch to rP PG could b e a de q uate [6]. With a short-time analys is, small video s egments witho ut enough quality for extra cting a robust rP PG signal could b e dis c arded without a ffecting the g lobal p erformance of pulse es tima tion. T o a ccomplish this ta rget, we have pro po sed a quality metric for s hort se gments o f rPP G signa ls. Summarizing, in this work: i) we p er formed pulse estimation using NIR active illumination to be robust to external illumination v a riability; ii) w e prop osed a quality metric for classifying sho r t rPP G segments and deciding which ones can be used and which one s should be discarde d in or der to obtain a robust hear t rate estimation; and iii) we co mpa red the per formance of a classic rPP G algo rithm and our qua lity-based appr oach. 3 Prop osed System In this section, we descr ibe the improv e men ts we hav e done to a base line rP PG- based heart r ate es timation system to increase its p erfor mance in a real dr iving scenario. Class ic r PPG systems dra stically degrade when facing the v a riability sources men tioned in the previo us sections. This p erformance problem is ca used by the low quality of the extracted rPP G signals which may b e affected (in their totality or only in some fragments) by v ariability source s that the rPP G metho d do es no t know how to deal with. Having this into mind, we thoug h t that computing a quality measure for knowing the amount of v ar ia bility in eac h tempo r al segment of a rPPG signa l could b e useful for de c iding which seg men ts a re more suitable for extracting a robust heart r ate es timation. In the next subsection we describ e the v a nilla rP PG system we used to obtain the ba seline results. This metho d c o rresp onds to the system s hown in Figure 1 . In the seco nd subsection we des crib e the additio n of a quality metric to the baseline s y stem. That appro ach is s hown in Figure 2 . In the third subs e ction we descr ib e how we have obtained the groundtruth of the hea rt rate for our exp eriments. 3.1 Baseline rPPG S ystem The basic metho d is based in the one used in [8], and co nsists of the ne x t three main steps: – F ac e dete ction and ROI trac king: The fir st step co nsists in detecting the face of the driver on the first frame of the NIR video. W e used the Matlab implemen tation of the Vio la -Jones a lgorithm. This a lgorithm is known to Quality-based rPPG HR Estimation for Driver Monitoring 5 NIR V ideo S equence Fig. 1. Architecture of the basel i ne rPPG system for HR estimation . Given a facial NIR video, the face is detected and the rPPG signal is ext racted from the ROI. The ra w rPPG signal is window ed and p ostpro cessed in order to ob t ain an individual HR estimation for eac h video segment. per form reasona bly well and in rea l time when dealing with fro ntal fac e s , as in our cas e . After the recognitio n stag e we selected the left cheek a s the Re- gion Of Interest (R OI), since it is a zo ne lowly affected by ob jects like hats, glasses, b eards , or mustac hes. The next step consis ted o f detecting cor ners inside the ROI for tr acking them over time using the Ka na de-Lucas-T o masi algorithm, als o implemented in Ma tla b. If at so me p oint of the video the R OI is lost, the face will b e redetected, a nd after tha t also the ROI and the corners. – rPPG signal extraction: F or each frame from the video, we ca lculated its raw rPPG v a lue as the av eraged intensit y of the pixels inside the R O I. The final output for each video sequence is a rPPG temp oral signal comp osed by the c o ncatenation of these averaged intensities. – rPPG p os tpro cessing : W e wan ted to estimate a HR v alue each d seconds. In order to achieve that target, we extra cted windows of T seconds from the r PPG signal, with a s tride of d s e conds b etw een them. The length of the window ( T ) is config urable in or der to p erform a time dependent analy- sis. F or each window we p ostpro cess ed the raw rPP G sig nal and we obtained an estimation of the HR. This p os tpro cessing metho d consists of three filters: • Detrending filter: this temp oral filter is employ ed for reducing the sta- tionary par t of the rPPG s ignal, i.e. eliminating the cont ribution from environmen ta l lig h t and r educing the s low changes in the r PPG level that are not par t of the exp ected pulse sig nal. 6 J. Hernandez-O rt ega et al. Quality-B ased rP PG HR estimatio n system Q & HR for each T' subwin dow Fig. 2. Architecture of the quality-based rPPG system for HR estimation . W e extracted some features from su bwindow s of t he p ostpro cessed rPPG signal. These features w ere used to compute a quality metric for estimating the presence of noise, head motion, or ex ternal illumination v ariability in the rPPG signal. F or each T seconds windo w we selected the T ′ seconds subwi ndow with the highest quality . • Moving-av erag e filter: this filter is des igned to eliminate the r andom no is e on the rP PG sig nal. That noise may b e caused by imp erfections on the sensor and inaccur acies in the captur ing pro cess. This filter consists in a moving average o f the rPP G v alues (size 3). • Band-pass filter: we co nsidered tha t a regular human hea rt r ate uses to be into the 40 -180 b eats p e r minut e (bpm) r a nge, which cor resp onds to signals with frequencies b etw ee n 0 . 7 Hz a nd 3 Hz approximately . All the rPPG frequency comp onents outside that rang e are unlikely to cor re- sp ond to the re al pulse s ig nal so they are discar ded. After this pro cessing stag e we transfor med the signal from the time doma in to the frequency domain using the F ast F ourier T ransform (FFT). Then, we estimated its Pow er Sp ectral Density (PSD) distribution. Finally , we searched for the ma ximum v alue in that PSD. The frequency co rresp ondent to that maximum is the estimated HR of that sp ecific video segment. 3.2 Prop osed Quali t y-Based Approac h The baseline metho d is able to o btain robust HR es timations in controlled sce- narios without to o muc h v aria bilit y o r noise in the recor dings. How ever, the raw rPPG signals acquired in a realistic dr iver monitoring scenario use to hav e high v ariations due to exter nal illumination changes, and frequent movemen ts of the drivers head. The r e are also other s ources of noise, e.g. noise inherent to the acquisition sensor. Quality-based rPPG HR Estimation for Driver Monitoring 7 (a) Frontal Pose (b) Partial Occlusion (c) Lateral Pose Fig. 3. Images e xtracted from the OMR ON database : (a) shows a image with a low leve l of v ariabilit y . A high qu alit y rPPG signal could b e extracted from a video composed by t his type of images; (b) and (c) show ex amples of images with h igh v ariability , such as o cclusions and head rotation resp ectively . All the mentioned factors make the pe r formance of the bas eline rP PG a lg o- rithm to dramatica lly fall. In o rder to ma ke it a s ro bust as p ossible, we decided to develop an new appr o ach, consisting of an evolution of the basic system com- bined w ith a quality metric o f the raw rPPG sig nals. A scheme of the pro po sed quality-based metho d c a n b e seen in Figur e 2. The target of using the quality metric is selecting the temp or al subwindo w of T seco nds with the highest quality from all the subwindows av ailable inside each T seconds window. The cr iteria for determining the best quality consis ts in lo oking for the rPPG segment with the less presence of noise, head motion, and external illumination v ariability , i.e. the r PPG s ig nal closest to one that has bee n c a ptured with a co nt act sensor . In order to compute the quality lev el, we divided each window in to several subwindo ws of T seco nds, with a stride of d s econds b et ween them (b oth par a m- eters a re configurable). Then we p erformed the pro cessing of the rPPG signal in the same way done in the bas e line system. F rom each pro ce s sed rPPG sub- window we extr acted s everal features, and we combined them to obtain a sing le nu merical quality meas ure ( Q ) repr esentativ e of how clo s e is the rPPG signal of each subwind ow to one acquir ed in p erfect conditions. Finally , from each T seconds window, we selected the segment of T seconds with the hig hest Q , and we estimate the user ’s HR with tha t rPPG se g ment . This wa y we disca rded the rP PG frag ments that may b e more affected by v ariability . This v a lue of the HR is used as the fina l HR estimation for the whole T seconds window. 4 Dataset 4.1 OMRON Database W e tested our method with a self-collected dataset called OMRON Database . The data in the dataset is comp osed by Near Infrared (NIR) active v ideos of 8 J. Hernandez-O rt ega et al. T able 2. Left: F e atures ex tracted to compute the qual ity of the rPPG p ostpro- cessed signals. Right: Fi nal configuration of the parame ters of the quality-based metho d . *F r om e ach window of T se c onds, we extr acte d subwindows of T ′ = 5 , 6 , and 7 se c onds of dur ation, and we sele cte d the one with the hi ghest Q value. F eature Description Parameter V alue Signal Noise Ratio (S N R) Po wer of the maximum v alue in the PSD and its tw o first harmonics, divided by the rest of the p ow er. Window Size T 7 seconds Bandwidth (BW) Bandwidth containing the 99% of the p owe r, centered in t h e maximum value of the PSD. Window Stride d 1 second Ratio Peaks (R P) Po wer of the highest peak in the PSD divided by the p ow er of second highest p eak. Subwindo w Size T’ 5, 6, and 7 seconds* Subwindo w Stride d’ 2 seconds F eature V ector SNR, BW, and RP the dr iver’s faces, recor ded with a camer a mounted in a car dashboar d. The images were captur e d at a sampling rate of 2 0 fps, and a resolution of 1 280 × 720 pixels. The P PG signals used for the gr oundtruth were captured using a B VP fingerclip sensor with a sa mpling rate of 500 Hz, and then do wnsampled to 20 Hz to synchronize them with the imag es from the camer a. The dataset is comprise d of 7 male users, with differ e nt ages, skin tones a nd some of them wearing g lasses. Ea ch participa n t was in front of the camera during a s ingle session w ith a differ ent duration for each one. The sessio ns wen t from 20 min utes to 60 minutes long. The full database contains 40 0 , 000 ima ges with a n av er a ge of 57 , 00 0 images for e ach sub ject. The re c ordings try to repres en t a rea l driving scenar io inside a moving car. They present differen t types of v a riabil- it y such as head mov emen t, o cc lusions, car vibration, o r external illumination. These v a riations mean different levels of quality in the estimated rPP G signals. Examples of ima g es fro m this databa se can be seen in Fig ure 3. 5 Ev aluation In this se ction we compare the p erformance o f the hear t rate estimations ob- tained us ing the quality-based rPP G metho d with the p erformanc e obtained using the bas eline rP PG metho d. 5.1 Setting quality parameters and features The quality-based metho d has several parameters to b e co nfig ured: the window size T , the subwindo w size T , the window stride d , and the subwindo w stride d . It is also necessa ry to de c ide which features to extr act from the rPPG signals, as they must co n tain information ab out the q uality level o f each subwindo w T ′ . F or this work we extracted 3 different featur e s that can g ive us infor mation ab out how clos e/far is a rPPG sig na l from the one ca ptured in p erfect conditions. The fea tur es and their de s criptions ca n b e seen in T able 2 (left). The final quality metric is computed as the ar ithmetic mean of these 3 features a fter no rmalizing them to the [0,1 ] ra ng e using a tan h nor ma lization [6]. Quality-based rPPG HR Estimation for Driver Monitoring 9 T able 3. Results of HR estimation for the rPPG baseline metho d and the qualit y- based approach. The results comprehend th e indiv idual Mean Absolute Errors (MAE) with resp ect to the groundtru th HR. The mean v alue and the standard deviation of the MAE for the whole ev aluation d ata has b een also compu t ed. The relative improv ement of th e MAE is sh own b etw een p aren theses. MAE [bpm] Vid eo Number 1 2 3 4 5 6 7 8 9 10 11 Baseline Metho d 11.9 15.9 7.5 12.6 11.2 12.5 9.6 8.0 9.2 9.6 10.1 Proposed Metho d 9.1 9.9 7.5 8.1 10.9 8.2 7.9 8.7 5.7 5.8 10. 5 MAE [bpm] Vid eo Number 12 1 3 14 15 16 17 18 19 Mea n St d Baseline Metho d 8.8 14.6 10.3 13.1 7.9 11.1 9.8 15.2 11.0 2.4 Proposed Metho d 9.3 7.6 7.0 7.9 8.4 9.1 11.2 12.7 8.7 ( 21% ) 1.7 ( 29% ) Based on our own previo us rPPG ex per iment s, we decided to test v alues o f T going fro m 5 seco nds to 15 seco nds, with 1 second of incr ement for the lo o p. F rom our pr evious work [8] we know that T = 5 seconds was the low es t v a lue that g av e go o d HR estimation with fav orable conditions , and using windows longer than 1 5 se c onds did not show to improv e the r esults. F or setting the subwindo w dura tion T , we decided to test v alues going fro m 5 seconds (limited by the minimum p ossible T size), to the corr esp ondent T v alue in each case. W e a lso incremented the T ′ v alues using a step of 1 second. The stride d is set to 1 seco nd in order to give an estimation of the HR for each second of the input v ideo. T he stride d , i.e. the tempo ral step be tw een each subwindo w, to ok v alues g oing fro m a minimum of 1 seco nd to a maximum of 5 seconds (when po ssible), with 1 se c ond of incr ement . After this initial configura tion exp er iments the b est r esults were o btained for the para meters shown in T able 2 (r ig ht ). T o c o mpute the per formance o f heart rate estimations we decided to use the Mean Absolute Er r or (MAE) betw e e n the gro undtruth hea rt rate in b eats p er min ute (bpm), and the one estimated with the rPPG algo rithm. 5.2 Results F or the final ev aluation of b oth metho ds (base line and pr op osed quality-based), we pro cessed 19 NIR videos o f 1 min ute duration ea ch one from the OMRON Database. W e used the co nfiguration of parameters s hown in T a ble 2 (right) for b oth metho ds (only T and d in the cas e of the baseline system). W e firs t computed the Mean Abso lute E rror (MAE) fo r each NIR video separ ately . W e did this to ha ve an idea of which videos are w o rking b etter and which ones a r e working worse. W e a lso computed the mean a nd standard deviatio n of the MAE for the who le ev alua tion datas et. As can b e seen in T able 3, using the qualit y-based rPPG approa ch we ob- tained a MAE v alue av eraged acro s s video s o f 8 . 7 b eats per min ute (bpm), and a sta ndard deviation o f 1 . 7 bpm for the whole ev alua tion datas et. Compared to 10 J . Hernandez- Ortega et al. Fig. 4. Quality Scores obtained from T ′ seconds windows. W e hav e selected those videos with a mean MAE und er 8 b pm as representativ e of high quality v ideos, and those with a mean MAE over 10 bpm as lo w quality v ideos. The h istograms show tw o different distributions, with the high q ualit y videos presenting a higher mean val ue of th e quality score Q . this result, the base line sys tem (without the quality appr o ach) obtained a MAE of 1 1 . 0 bpm and a MAE standard deviation of 2 . 4 bpm for the 19 min utes. This difference in the p erformance repr esents a relative improvemen t of a 21 % in the mean v alue, and o f the 29% in the s tandard dev ia tion of the Mean Absolute Erro r . T able 3 also shows the MAE v a lues for each NIR v ide o of the ev aluation dataset, b oth using the baseline and the quality-based metho ds. It ca n b e se e n that for some sp ecific video s the baseline result is o btaining a more accura te es- timation of the HR, but in gener al, the MAE v alues obtained using the q ua lity- based appro ach ar e low er. The sp ecific cases in which the qua lit y-based metho d is working worse coincide with thos e videos with long sequences with high v ari- ability , wha t ma kes difficult to find clean seg men ts. In Figure 4 we are s howing the quality scor es Q we o bta ined fo r a s election of the ev alua tion videos . W e dec ided to show the dis tr ibution o f Q scores from those videos with a MAE v alue (obtained with the quality-based metho d) lower than 8 bpm, and those with a MAE v alue higher than 10 bpm. The his tograms show tw o different distr ibutions, with the b e s t p er forming videos (i.e., MAE ¡ 8 bpm) pr e s ent ing a higher mean v alue of the quality scor e Q . The results of this section ev idenced that, a t least with the data from the OMRON Datas et, the quality metric Q has s hown to b e an effective way to discard segments of video tha t may impa ct nega tively to the general p erfor mance in rP PG, a nd therefor e obta ining an improvemen t of the global accura cy o f HR estimation. Quality-based rPPG HR Estimation for Driver Monitoring 11 6 Conclusion and F u ture W ork In this pap er we developed a metho d for impr oving heart rate (HR) estimation using r emote photo pleth ysmogra phy (rP PG) in challenging scenario s with mul- tiple sources of high- v ariability a nd degrada tion. O ur metho d employs a q ua lit y measure to e x tract a rPPG signa l as clean a s p ossible from a sp ecific face video segment, trying to obtain a more robust HR estimation. Our main motiv atio n is developing robust technology for contactless driver monitoring using computer visio n. Therefore, in our exp er imen ts we emplo yed Near Infrar ed (NIR) video s acquir ed with a camera mounted in a ca r dash- bo ard. This t y pe of videos present a high n umber of v aria bilit y sources such as head mov ement, ex ternal illumination c hanges, v ibration, blur, etc. The targ et of the quality metr ic Q we have pr op osed consis ts in estimating the amount of presence of those factors . Even tho ugh our exp erimental framework is around driver monitoring, o ur metho ds may find applica tion in other high-v aria bility face-based human-computer in teraction scenario s such as mo bile video- chat. W e have compar e d the p erfor mance of tw o different metho ds for HR estima- tion us ing rP P G. The first o ne consisted in a cla ssic r PPG algor ithm. The second metho d consisted in the sa me alg orithm, but using the quality measure Q fo r s e- lecting which video segments present a lower amount of v ar iability . W e used those segments for extracting rPP G sig nals and their a sso ciated HR estimations . The quality metric Q show ed to b e a reliable estimation o f the amount of v a riability . W e achiev e d b etter p erforma nce in HR es tima tio n using the video seg ment s with the highest p ossible quality , co mpared to using a ll the video frames indistinctly . Our solution is based o n defining the qualit y Q as a co mb ination o f hand- crafted features. As future work, o ther definitions of qua lit y could b e also in- vestigated. A different set of features that may co rrelate mo re accur a tely to the presence of noise factors in the rPP G s ig nal can b e studied. T ra ining a Deep Neural Netw or k (DNN) for ex tr acting Q from the video sequences is also a n int eresting p ossibility . This type of netw orks may b e able of estimating the qua l- it y level b y lear ning which factors ar e more relev ant for obtaining robust rPPG signals dir e ctly from tr aining da ta. How ever, the la ck of lab eled data sets makes it difficult to train DNNs from scr atch, so it would b e a lso b eneficial to acquir e a larger databas e. This new database may contain a higher num b er of user s, and it may also prese nt mor e challenging c onditions for testing our quality-based rP PG algorithm, e.g. v ariant a m bient illumination, motio n, blur , o cclusio ns, etc. 7 Ac kno wledgemen t s This work was supp or ted in part by pro jects B IBECA (R TI2018 -1012 48-B-I00 from MICINN/FEDER), a nd B ioGuard (Ayudas F undacio n BBV A). The work was c o nducted in part during a resear ch stay of J. H.-O. at the Vision Sensing Lab orator y , Sensing T echnology Res earch Center, T echnology a nd In tellectual Prop erty H.Q .,OMRON Corp or ation, Kyoto, Japa n. He is also suppo rted b y a PhD Scholarship from UAM. 12 J . Hernandez- Ortega et al. References 1. Allen, J.: Photoplethysmography and its application in clinical physiologica l mea- surement. Physiologica l measurement 28 (3), R1 (2007) 2. Alonso-F ernandez, F., Fierrez, J., Ortega-Garcia, J.: Quality Measures in Biometric Systems. IEEE Secu rity Priv acy 10 (6), 52–62 (2012) 3. Awasek ar, P ., Ra vi, M., D oke, S ., Shaikh, Z.: D river fatigue detection and alert system using n on-intrusiv e eye and ya wn d etection. Int. Journal of Computer Ap - plications 975 , 88–87 (2019) 4. Brandt, T., Stemmer, R., Rakotonira iny , A.: Affordable visual driver monitoring system for fatigue and monotony . In: IEEE Int. Conf. on Systems, Man and Cy- b ernetics. p p. 6451–6456 (2004) 5. Chen, J., Chang, Z., Qiu , Q ., Li, X., Sapiro, G., Bronstein, A., Pietik¨ ainen, M.: RealSense = real heart rate: Illumination inv arian t heart rate estimation from videos. I n: Image Processing Theory T ools and Applications (IPT A ) (2016) 6. Fierrez, J., Morales, A., V era-Ro driguez, R., Camacho, D.: Multiple classi fiers in biometrics. p art 2: T rends and challenges. In formation F usion 44 , 103–112 ( Nov em- b er 2018) 7. Flores, M.J., Armingol, J.M., de la Escalera, A.: Real-time warning system for driver drows iness detection using visual information. Journal of Intelligen t & Rob otic Systems 59 (2), 103–125 (2010) 8. Hernan d ez-Ortega, J., Fierrez, J., Morales, A ., T ome, P .: Time Analysis of Pulse- based Face Anti-Sp o ofing in Visible and N IR. In: IEEE CVPR Computer So ciety Workshop on Biometrics ( 2018) 9. Jo, J., et al.: Vision-based metho d for d etecting driver drow siness and distraction in driver monitoring sy stem. O ptical En gineering 50 (12), 127202 (2011) 10. Jung, S .J., Shin, H .S., Chung, W.Y.: Driver fatigue and d ro wsiness monitoring system with embedded electrocardiogram sensor on steering wheel. IET Intellige nt T ransp ort Systems 8 (1), 43–50 (2014) 11. Kang, H.B.: V arious approac hes for driver and drivin g b ehavior monitoring: a review. In : IEEE I nt. Conf. on Computer Vision W orkshops (2013) 12. Lal, S.K., et al.: Development of an algorithm for an EEG-based driver fatigue countermeas ure. Journal of Safet y Researc h 34 (3), 321–328 (2003) 13. McDuff, D., Gontarek, S., Picard, R.W.: Improv ements in remote cardiopulmonary measuremen t using a five band digital camera. IEEE T ransactions on Biomedical Engineering 61 (10), 2593–2601 (2014) 14. Pakgohar, A ., T abrizi, R .S., Khalili, M., Esmaeili, A.: The role of human factor in incidence and severit y of road crashes based on the CAR T and LR regression: a data mining approach. Proced ia Computer Science 3 , 764–769 (2011) 15. Poh, M.Z., McDuff, D.J., Picard, R.W.: A dv ancements in noncontact, multiparam- eter physiolog ical measurements using a w ebcam. IEEE T ransactions on Biomedi- cal Engineering 58 (1), 7–11 (2011) 16. Shin, H.S., Jung, S.J., K im, J.J., Chung, W.Y.: Real time car driver’s condition monitoring sy stem. I EEE Sensors pp. 951–954 (2010) 17. T asli, H.E., Gud i, A ., den Uyl, M.: R emote PPG based vital sign measurement u s- ing adaptive facial regions. I n: IEEE International Conference on Im age Pro cessing (ICIP). pp . 1410–14 14 (2014) 18. WHO: Global status rep ort on road safet y . https://ww w.who.int /violence _injury_prevention/road_safety_status/2018/en/ (2018)
Original Paper
Loading high-quality paper...
Comments & Academic Discussion
Loading comments...
Leave a Comment