Performance of Kriging Based Soft Classification on WiFS/IRS- 1D image using Ground Hyperspectral Signatures
Hard and soft classification techniques are the conventional ways of image classification on satellite data. These classifiers have number of drawbacks. Firstly, these approaches are inappropriate for mixed pixels. Secondly, these approaches do not c…
Authors: Sumanta Kumar Das, R, hir Singh
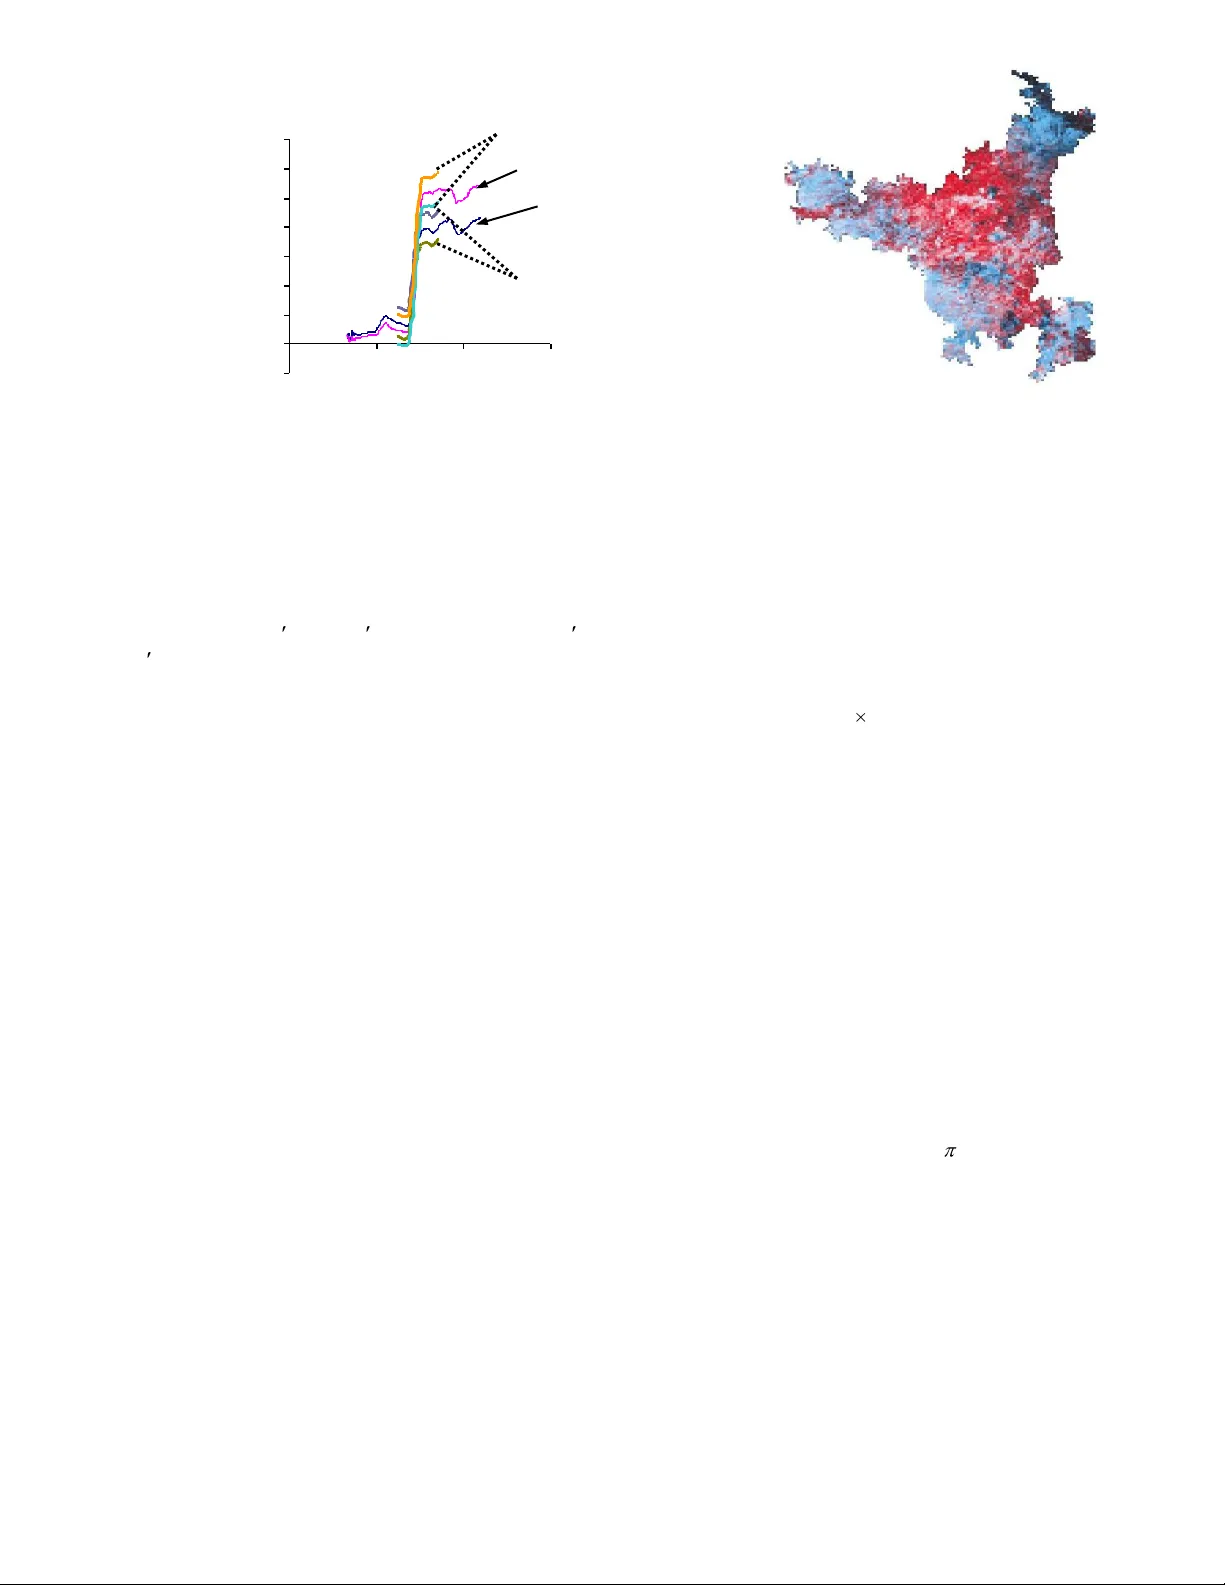
Abstrac t — Hard /soft cla ssific atio n tec h niques a re the conv ention al way s o f image cl ass ificat ion on s atellite d ata . The se class ifiers hav e number o f draw backs. F irs tly, these approach es are i napp ropria te for mixed pix els. Secondly, these approach es do n ot consider s pati al varia bility . K rig ing ba sed soft classi fier (KBSC ) is a no n-parame tric geos tatisti cal metho d. It exploits the spatia l var iab ility o f the classes wi thin the i mag e. This lett er com pares t he per form ance of KBSC with other co nventio nal hard/so ft c lassif ication te chni ques . The s ate llite da ta us ed in this study is the Wide Field Senso r (WiFS) from the Indian Remo te Sensing S atelli te - 1D (I RS -1D ). The gro und hyper spectr al signatu res acq uired f rom the agr icultura l fiel ds by a hand held spectro radio meter are u sed t o detect subpix el target s f rom the satelli te images . Two meas ures of closen ess have been used fo r accuracy as sessmen t o f th e K BSC to th at o f the conv entional class ifications . The results prov e that t he KBSC i s statistical ly mo re accura te th an the o ther conv entional techn iques. Index Terms — E n tropy , ima ge c lassif ication , kriging , maximum lik elihoo d estima tion, subpi xel tar get d etectio n. I. INTRO DU CTION ONVEN TIONAL w ay s of image classific ati on of satellite data ar e base d on class discriminatio n using hard/so ft classif ication technique s. Hard classif ication technique has a numbe r of dra w bac ks th at limit its practical applic ati o ns. It wo rks at a pi xel lev el w ith out allow ing esti mation at subpix el lev el. Mo st of the har d classif ie r s r ely on a Gaussi an distribut ion fo r the spectral signatures of the traini ng data that ofte n exhibits a n on Gauss ian distrib ution. Hard classif iers do not quantify th e li keliness (or prob ab ilit y ) th at a pixel actually be l ongs to a pre-def ined class; n ei ther do they conside r spatial variab ility . An alte rnative to th e h ard classif icatio n is sof t classific ation that has be en widely used for actual asses sment of cla ss propo r tio n s of a mixed pixel. Mos t c ommo n ly used soft classif ication tec hniques a re base d on pi xel u nmixing (e. g. Linear mixi n g model (LM M) [1]), softe n ve r sion of maximum likelihoo d [2], fuzzy logic [3 -4], neural n etw o r k [5], ke rnel no n parametric method [6], vary ing -ti me-regressio n mode l [7], multilogi t m ode l [7]. T h e LMM i s th e basic a n d w idel y u s ed pixel-unmix ing t ec hnique to dec ompo se mixed pixels int o a co llectio n of disti nct end memb ers along w ith the ir abunda nces. This mode l ha s so me lim itatio n s : 1) ―co ndition of identifiab ility ‖[8]; 2) a ssu mptio n fo r know n an d co nstant end memb ers spectra [8]; 3) a ssu mptio n of lin ear mixing [9]; 4) high co rr el ati o n of h y perspec tr al bands [10 -11]. Some of t h e fe atur e extraction (o r dime n sional ity r eduction) techni que s that h ave been used to improv e th e LMM are principal co mponents tra nsfo rm , discrete wav ele t tran sfo rm [11 -12], Fishe r linear di sc riminat transfo rm, spectral band selecti on and singula r v alue deco mpos ition (SVD)[13] , use of vicinal info rmation [8]. Incide n tally , n one of th ese class ifiers co n side r the spat ial va r iab ility ; even -th oug h t his is an impo r ta n t fact or of satellite image s. Satellite sensors collec t data a t a range of r eso lutions. These are spatial ly auto correlated . A classif ier that use s spatia l info rmation ([14-15]) o f th e satellite dat a is alw a y s mor e favo rable t han the conve n tio nal classif ie r s. In additio n, if the classif ier can predict th e abu n dances of en d m emb ers along w ith their spatial locatio n wit hin the pixel then it beco mes much superior . Mo r eove r, if the cl assif ier is scale free, i .e. i t wo rks on b o th small (dow n scale or subpixe l) a s w ell as large (upscale or group of pixels) scales the n i t seems t o be most usef ul classifier. T o a lar ge extent the k ri gi ng base d soft classif ier (KB SC) satisf ies all o f th ese crite r i a [ 15 -16]. Eve ry feature on the earth has its ow n unique spect ral sig n atu r es in the elec tr om agnetic spect rum. The grou nd hy perspectral signatu r es (GH S) are of t en collec ted a n d store d in a spec tr al li b r ar y so th at they can be used for comparing th e hy perspectral sig natu r es from sa tellite i magery for pixel identific ation. Ge n e rally th e GH S a r e collec ted with a high precisio n in a labo r a tory like e nvironme nt, w her e as the satellite data are not free from a tmosp heric scattering an d abs orption. As a result b efo r e apply in g the GH S fo r pi xe l identific ation, the sat ellite data is be in g correcte d for th e atmo spheric scatte ring and abso r pti on. The pr esent l et ter ev aluates the perfo rman ce of t h e KBSC, in co mparison to o t h er co n ve nti o n al classif iers such a s maximum likeli hood, Ba y e sian, Demps ter-S ha fe r, f uzzy classif iers. So far the KBS C h as bee n used fo r mineral mappi n g from the hy perspec tral data like t he Airbo r n e Visib le/In f r ar ed Imag ing Spectromete r (AVIR IS) [16] or fo r the simulated image data [17] succ es sfull y ; still its perfo rman ce fo r extracti n g th e c lass fe atur es (spe cially agricultu ral) f r om n onhy perspectral co ar se spatial resoluti on data like the WiFS / IRS 1- D has not b een explo red previo usly. The main ob jective of thi s study i s to ev alua te the perfo rman ce of K BS C using the GHS in o r der to per form sub pixel target detectio n . The Performa nce of th e KB SC is validate d by appl y i ng this cl assifie r for area estimatio n of agricultu ral c r ops f r om a n onhy perspec tr al se n so r da ta like WiFS f rom IRS 1D s atellite. Sumanta Kum ar Das a nd Ra n dhi r S ingh Performance of Kriging Based Soft Classification on W iFS/I RS - 1D image usin g Ground H y persp ectra l Si gnatures C II. MATER IALS AND METHODS The study ar ea is th e sta te of H ar y a n a in India, which is loc ated betwee n 74 o 25 t o 77 o 38 E lo n gitudes and 27 o 40 t o 30 o 55 N latitudes. Th e WiFS data f r om th e IRS-1D [18] is used in this study ; it ha s spatial r eso luti on of 188 m t hat cove r s the entire state (Fig. 1(b)). The date of acquiring the data is the February 16, 1998. The WIFS h as two spectral bands; o ne in visible r ed ba nd (RED) i.e.620 -680 nm and the other in inf rar ed r egio n (IR) i.e.77 0-860 n m and its sw a th is 810 km. Since the pixel si ze of data is l arge (around 188 m × 188 m), man y pixels ar e of m ixed co mposition. The sat el lite data is georefe r enced usin g gro und refe ren ce points ob t ained from a glo bal posit ioning sy stem (GPS). Main agricultu ral c r ops of th e stat e during this seaso n are w in te r w h eat ( Tri ticum aestivum L .) and mus tard ( Brass ica juncea L .). Af ter visually observing t h e s a tellite d a ta, i t is found that water, buildi ngs and r oad features ar e easily identifiab le f rom the sa tellite d ata. H owev er, it is n ot e asy to distinguis h w h eat and m usta rd p ixels from the pixels co vered by ve g etations. Thoug h , most of th e satellite’s pi xels are of mixed ty pe, a soft classificatio n of th e satelli te data will be appropria te. Labo r atory base d spectral signat ures curves are deve lope d an d used to train t h e s atellite dat a. Spe ctral sig n atu r es of w heat and mustard (f r om 75 wheat and 65 mustard fields) ar e acquired f r om agricultu r al f ields spr ead across the study ar ea. The h y perspec tr al dat a a r e c ollec t ed using an A naly tical Spe ctral Dev i ce Fieldspec® handhe ld spec tr oradio meter [19], in orde r to obtain pu re end memb er sig n atu r es, w h ic h h ave 700 spectral ba n ds that are sampled a t 1 n m ov er th e range o f 400 to 110 0 nm w ith a spec tral resolutio n of 10 n m. A 25 o insta n ta n eo us-f ield-of-view foreo ptic is use d, the i n strume n t is se t to a ve ra ge t en sig n atu r es to pr oduc e each sample signature, and the senso r is held nadir at a pproxi mately 4 ft above th e ve getat ion canopy . Sig n atu r es are collec ted for 2 classes, n amel y : 1) wint e r wheat ( Triticum a estivum L .) ; and 2) mustard ( Br assica junc ea L .). The Natio n al Sample Sur vey Organizatio n (NSSO ), India , co llects th e crop cutti ng expe r iment (cce ) and GH S da ta und er the general c rop estimatio n survey s (GCES)[20]. A stra tifi ed multistage r an dom sampli n g design is adopted i n th e se survey s where th e b loc ks (t w o or three dist ricts to gether) co nstit ute the st rata. A sample of villages is se lec ted f r om diffe r ent strata in propo r tio n to th e ar ea unde r crop, base d on the pa st y ear data. Fr om each se lecte d v illa ge, tw o fields ar e sele cted r andomly an d from each field, a plot of fixed size, generally measur ing 10 m 5 m; i s sele cted. Geographical loc ations of e ach samp led fie lds are r ec orded by a GPS. All the spect ra co l lecte d from sampled fields of wheat and mustard, are averaged t o co n stitute a single r eprese ntative spec tr um (Fig. 1(a)). Th e sampled fields are n ot nece ssari ly of pure classes as few (appr oxi mately 40 %) of th em are mi xed. The r elativ e pr opo rt io n s of di fferent grou nd classes in mixed fie lds are reco rded by th e ob se r ve r’s ey e estimatio ns. The WiFS da ta taken from IRS – 1D is n ot free from th e atmo spheric eff ects. The dar k ob jec t subtra ction model (DOS) deve lope d by Cha ve z 1998 [23] is applied fo r a tmosp h eric co rr ection of th e satellite data. This algorit hm is availab le wit h the ATMOSC module of c ommerci al image proce ssin g sof t ware IDRIS I [21]. In o rder t o co r r elate the h y perspec tr al reflec tan ce field data w i th the satel lite’s DNs (Digital Numb er), t he hy p erspectral ref lectan ce da ta a re r educe d t o satellite’s DN using two parameters (gain and bias prov ided w ith the s atellite dat a) using t h e fo llowing equatio n s [ 22 ]: L ( i ) = [ R ( i ) * ( E sun . sin ( SE ))] /( . d 2 ) (1) DN ( i ) = [ L ( i ) - bias ( i )] / gain ( i ) (2) w her e L : at satellite r adiance in mW cm -2 sr -1 µm -1 ; i = ba n d numbe r; R : at-satelli te r efle ctance (unit less); E sun = mean so lar exo atmo spheric irradiance in m W cm -2 sr -1 µm -1 ; SE : sun elev a tion an gle (in degree s) an d d: ear th -sun di sta nce in astronomica l unit. Gain in m W cm -2 sr -1 µm -1 and bias in mW cm -2 sr -1 µm -1 , values are prov ided w ith the h eade r file of t he satellite d ata. Le t t he digital numbe rs (DNs) of a r emo tely sensed satellite imagery a r e the realiz ati o n s of independent and ide ntical l y distributed ( iid ) sp atial random va riables (r v) (Z ( x )) of a random proc es s; where x is the locatio n. Two stati o n ar y Fig.1. (a) S pectral sig nature curve o f wheat and mustard c ollecte d from field experime nts using a handheld s pectro ra diom eter , (b) Fal se Color Comp osite o f WiFS o f 16 th Feb.199 8 usin g red and infrared bands. (b) -0 . 1 0 0 . 1 0 . 2 0 . 3 0 . 4 0 . 5 0 . 6 0 . 7 0 500 1000 1500 Wa vel eng t h(nm) Re fl e c t a n c e Fa c t o r ( % ) 95 % Confid ence i nterval 95 % Confid ence i nterval Wheat Mustard (a) S TEP I: S UPPOSE A BLOCK OF S IZE 3 X 3 ( O R MORE ) IS SELECTED FROM T HE BAND A (6 20 - 680 NM ) AND B AND B (7 70 - 860 NM ) D ATA OF WI FS FR OM T HE IRS -1 D . N UMBER IN THE CELL IND ICATES THE DIGITAL NUMBERS (DN S ). S TEP II: E XTRACT THE UPPER ( U i ) A ND LO WER ( L i ) LI MITS OF THE DN IN THE SPECTR AL B AND i (= A, B) FR OM THE GROUND HYPE RSPECTRAL SIGNATURES . e.g. C L ASS 1:W HEAT L A < DN A < U A ; L B < DN B < U B S TEP III: T RA NSFORM BA ND DATA TO B INARY DATA (1 IF BELOW THE THRESHOLD AND 0 IF ABOVE THE THRESHO LD ) B AND A B AND B 1 1 0 0 0 1 1 1 0 0 0 1 1 1 0 0 1 1 1 0 0 1 0 1 0 0 0 1 1 1 1 0 0 0 1 1 U PPER L OWER U PPER L OWER S TEP IV: A PP LY KRIGING THROUGH VARIOGRAM MODEL FITT ING ; ( USE ANY OUTPUT BLOCK SIZE ) B AND A B AND B U PPER L OWER U PPER L OWER S TEP V: I NTEGRATE UPPER AND L OWER LIMITS ( DEGREE OF FUZZ INESS OF DN VALUES WITHIN SPECTRAL RAN GE ; FROM THE EQUATION 5) B AND A B AND B S TEP VI: C ALCULATE T HE JOINT PROBAB ILITY ( FROM THE EQUATION 6) Fig. 2. Pictorial descri ption o f the KBSC assumptio ns are made to al low statistical in fe rence: 1) expe cted v alue ( m = E { Z ( x )} ) exists a n d is indepe ndent of x ; 2) The in te r -depe n dence betwee n an y two-point loc ations (e.g. variog ram; ] )} ( ) ( [{ ) ( 2 2 h x x h E Z E ) is exp r esse d a s a functio n of la g ( h ; sepa rating distance and directio n ). The bes t linear unbiased estimator (BL U E) of th e value of th e variable at any un know n loc ation ( x 0 ) usi n g the values o f know n loc ations x 1 ,… x k , ca n be ob tained by kr iging es timato r k l l l x Z x Z 1 0 ) ( ) ( ˆ (3) w her e k l l 1 1 (4) The entire met h odo l ogy of the KBSC is describe d thr oug h a schematic diagram i n Fig. 2. In mos t of the hy perspectral imagery classific ati on, basic step is t o identify th e ke y bands w her e a particula r class fe ature is highl y distinguis ha ble . This step is n ot r equired h er e bec ause v egetati on f eature is h i gh l y distinguis hable in t h e RED and IR bands of th e WiFS/IR S 1 - D. Le t U i and L i r efe r to th e uppe r and l ow er confide n ce inte r vals of DN, at % confide nce level for band i . These ar e def in ed as: n s t x i α,n i , whe r e i x and i s are the m ea n and standa rd dev iation of DNs for band i ob tain ed from the g r ou n d data, t ,n is the area under the Stude n t’s t- distrib ut ion with lev el of sign ifica n ce an d n is the deg rees of free dom (num b er of bands of th e GHS w ithin the band l imits of WiFS). B y inte r polati ng the bi nar y m aps fo r t h e upper limit, we obtain a map r ep resenti n g th e probab i lit y th at the value of a training bloc k lies be l ow th e indicated upper limit (say e vent E 1 ). Th e inte r polatio n f o r the lowe r limi t r esults in a map r ep r ese nting the prob abilit y that the blo ck value lies a bo ve th e low er limit (say eve n t E 2 ). Combi ning these we obtain th e prob abilit y that the bloc k DN value is h i ghe r tha n the lowe r limit and smal le r than th e upper limit (e.g., th e prob ability of a blo ck h aving a spec tr al DN value in b etw e en the p redef in ed range co rr espo n ding to t h e spec tral respo nse of th e c r op o f i nt e rests). Though eac h DN is assumed as a r ealiz ati o n of iid r v Z( x ) , E 1 and E 2 , ar e indepe n de nt, the co m pound pr ob abilit y e ve nt is simply def in ed as Pr { map i } = Pr { E 1 E 2 } = Pr { E 1 } + Pr { E 2 } - Pr { E 1 } Pr { E 2 } (5) The KB SC h as the flexib ilit y to de fine the size of a pi xel to produce output and it is not nece ssary to be of th e same size a s the input pixel size. This prov ides a means of extrapolati ng to areas la r ger tha n t h e pixel size o r interpolati ng to areas smal ler than the pixe l size. Repe ating this proce dure fo r all key ban ds results in a set of pr ob a bility maps (one fo r each ban d), w h ic h can be in t eg rated by calculating the jo in t prob ability tha t i s a measu re f o r t he l ikeliness t hat a pixel be longs t o a ce r ta in class. The jo in t prob ability is obtained as (assumi n g that each bands a r e li nearly in depe n dent) Pr { joint }= Pr { map i } Pr { map j } Pr { map k }… Pr { map b } (6) w her e map i t o map b ar e t h e maps represe nting prob ability maps fo r key bands i to b used. This image is used as input fo r the classificatio n . By setting tolerances on the minimu m prob ability acquir ed fo r each cl ass, pixel can be classifie d with a prede fined acc uracy . Th e lev el of accura cy of t he classif ication is propo r tio n al t o th e average pr opo r tion of a bloc k area chose n as a t hr eshold lev el. The perfo rm ance of th e KB SC is compared w ith fo ur co nventional hard/sof t classifiers. These al gorit h ms ar e availab le with the MAXL IKE, BA YCLA SS, BELCL ASS an d B AND A 60 59 60 63 53 36 58 45 40 B AND B 55 32 30 57 70 125 52 115 85 1 0.9 0.6 0.1 1 0.9 0.5 0.1 0.8 0.7 0.2 0 0.4 0.3 0 0 0 0 0.6 0.9 0 0.2 0.8 1 0 0.2 0.8 1 0.8 0.9 1 1 1 0.9 0.4 0.1 0.9 0.7 0.5 0.1 1 0.5 0.1 0 0.9 0.6 0.2 0 0 0 0.4 0.8 0 0.1 0.3 0.8 0.8 0.5 0.6 1 0.4 0.9 0.9 1 1 0.9 0.84 0.91 1 0.92 0.9 1 0.8 0.76 0.84 1 0.4 0.93 1 1 1 0.9 0.64 0.82 0.9 0.73 0.65 0.82 1 0.75 0.64 1 0.94 0.96 0.92 1 1 0.81 0.53 76 0.74 62 0.9 0.67 16 0.58 5 0.82 0.8 0.57 0.53 76 1 0.37 6 0.89 28 0.92 1 B AND B B AND A, DN U A L A U B L B FUZ ZYCLAS S mo dules of co mmercial im age-proc essin g sof t ware IDRIS I 32 ([21]). The MAXLIKE is the m aximu m likelihoo d classifie r . It a ssig n s each pixel to t h e most l ike l y class. Th e BAYCL ASS employ s Baye sian p r ob a bility t h eory to express t h e degree of membership of a pixel to an y class. The BELCL ASS employ s D empster-Shafer theo r y of ev idence using belief functions and plausib ility r easo nin g. It is used to combine se parate pi ec es of i nformatio n (ev idence) t o calculate th e prob ability of an e ve nt . I t is a v ariant o f th e BA YCLA SS. It estim ates the b elief inte r val, as a measu r e of classif ication unce rtainty . Th e be lief in terval is the dif ference be t w een be lie f (the degree to which ev idence pr ov i des support for a h y pothesis) a nd plausib i lity (th e degree t o w h ich the ev idence does not r efute tha t hy p othesis). The FU ZZ YCLASS is base d on supervised fuzzy classifier develo ped by Wan g in 1990[4]. The FU ZSIG m odule i s use d to deve lop the fuzzy sig n atu r es (th e fuzzy mean an d th e fuzzy cov ar iance matrix [4]) f r om training pixels . The FUZ SIG creates the sig natures from info rmation co nt ai n ed i n the remote ly sensed images from the training samples. Th ese signatures are u sed to perfo rm a supe rvised classif ication o f th e r emo t ely sens ed imagery us in g th e B AYCLA SS, BEL CLASS a n d th e FUZ ZYCLAS S module s. F or the KBS C, class pr opo r tions of each sub pixel loc ations a r e de te rmined b y kriging. T h e KR IGECLAS S (algorithm deve loped fo r the KB SC) uses kriging bas ed class pr ob a bility ( from equati on 6) and the grid distance ( h ) for the va r iog ram m ode l fitting to deve l op KBSC results. As th e lar ge port io n s of th e image are co mposed of mixed pixel, an accu r a cy assessment based on pur e pixel will no t prov ide full or adequate description of classif ication s perfo rman ce. The Linear Imaging Self Scanner (LISS III, [18]) data is used for a cc ur acy assess ment, which is obtained from th e same satellite f or th e same day and loc ati o n . T h e LISS III da t a has a spatial reso luti on o f 23.5 m. Th e LISS III data i s classif ied using MAX LIKE, BA YCLAS S, BELCL ASS, FUZ ZYCLAS S a n d KRIG ECLASS . The so ft classif ied LISS III data is up scaled (passing t hr oug h a mean filter of 8 8 w in dow ) t o 188 m r eso l ution to compare w ith the sof t classif ied WiFS data . Foo dy et al. [3] have sh ow n that usual method of accuracy asses sment (co nfusio n matrix) is n ot capable of measur ing the accuracy of soft classif ication. The clo seness of prob a bility distribut ion of different cl assifiers on the WiFS data and th e LISS III dat a is done by t hr ee cr iterio ns: mea ns square erro r , cross entr opy an d co rr elation analy sis. A. Me an Squar e Error : C c c c e e C S 1 2 2 1 1 (7) w her e e 1c is the propo r t io n of class c in a pixel from the LISS III data and e 2c is th e propo r tio n of the class c in a pixel from th e WIFS da ta, c de notes th e numbe r of classes in t h e data set . B. Cross entrop y : x x x f x f x f x f f f D ) ( log ) ( ) ( l og ) ( ) , ( 1 2 1 2 2 1 2 1 (8) f 1 is the propo rtion from the L ISS III dat a and f 2 is the propo r tio n s f rom t h e WiFS d ata. III. RES ULTS AND DISCUS SION Table I s h ow s th e dist ri butio n of S and D for different classif iers. A low value of S an d D is an indicativ e of good represe n tatio n of classified da ta to t hat o f the true data. Examini ng the Table I it is found that the KBS C i s a be tter classif ier co mpared to other co n ve nt ional classif iers. The WiFS data is classified at sub pixel leve l by vary in g the gr id distances ( h = 23.5 , 47 m, 188 m , Tab le I). Th e maximu m eff iciency of t h e KBSC i s ob tai n ed when th e gri d distanc e ( h =188 m) i s equ al to the spatial r eso lution of th e image . Th e eff iciencies of th e KB SC g o d own (still co mparable to t h e other methods ) whe n classific ation i s made a bo ve/below t he spatial r eso l ution of th e s atellite data. Table II s h ow s th e values o f the corr el ation co efficie n ts ( R 2 ) be t w een t h e propo rt ions of classes on the WiFS data and propo r tio n s of classes on the LISS III data. Analy z in g th e se value s of R 2 for di ffe ren t sof t classifiers, it can be said that th e accuracy of t he KBS C is significantly better from other classif iers. A comparison of th e per ce n tage dev iation (PD) of MAXL IKE, B AYCLA SS, BELCL ASS and KRIGECL ASS area estimates wit h the usual GCES estimate is given in Table III. Acco r din g to the GCES base d a creage es tim ates , wheat and musta r d cove r 45.72% an d 13.99% of th e t otal geo graphi cal area (437, 3861 ha) o f the state. The r esults s how that th e entire satellite base d ar ea esti mation techniqu es underestima te the area as compa r ed to GCES es timates . F or wh eat in a ll the cases, it i s l ess than 16 % and in case of mustard, it is less th an 18 %. The ov erall PDs of MAXL I KE were o ver 15.74% to 17.41% f or w heat and m usta rd respec tively . If th e PDs of K RIG ECLASS , BA YCLASS an d BEL CLAS S estima tes ar e compa r ed i t is f o un d that KBS C estimate s ha ve les s PD. T h e PD of K RIGECL ASS based estimate with va r y i n g g rid distances ( h ) i s also studie d. IV. C ONCLUSION The results ve r ify that t h e K BS C performs w ell compar ed to other conve ntional classifie r s fo r classify in g n o nh y per spec t r al satellite data like W iFS from IRS-1D w i th th e help of GHS. In addition, KB SC is scale independe n t that means this can be used for both within (subpixel) or beyo n d (mac r opixe l) the spatial reso luti o n o f t h e satellite data. Alt hough, KBSC perfo rms be tter for sub pixel level in co mpare to t h e mac r opixe l lev el. R EFERENCES [1] J.J. Settl e an d N .A. Drak e, ―Linear mi xing a nd t he estimatio n of ground proportio ns,‖ In tern ation al Jou rna l o f Re mote S ens ing, v ol. 14, pp. 115 9-117 7, 19 93 . [2] G. M. Foo dy, N. A. Ca mpb ell, N . M. T rodd a nd T. F. Wood, ―Derivati on a nd a ppli cations o f probabili sti c measures of class membershi p from t he maximu m likelihood cla ssification,‖ P ho togra mmetric En gine ering and Remote S ensing, vol. 58, pp. 1 335 - 134 1, 1992 . [3] G. Foo dy, ― Approac hes for th e production a nd e valuati on of f uz zy land cov er classifi cations from r emotely - se nsed d ata,‖ In terna tiona l Jou rnal of Remote Se nsin g , vo l. 17 , pp. 131 7 – 1 340, 199 6. [4] F. Wa ng, ―Fu zzy Su pervi sed Cla ssificat ion of R emot e S ensing Images,‖ IEEE Tran sac tions on Geoscie nce a nd Re mote Sensin g , vol. 28, pp. 194 -201, 19 90. [5] A. M oody, S. G o pal a nd A. H. Strahler, ―Sensiti vity of n eural networks to su b pixel lan d -cover mixture s in coar se-resolut ion satellite data,‖ Rem ote Se nsing of En viron men t , vol. 58 , pp. 3 29 – 34 3, 1996. [6] I. Keramitsogl ou, J. Mitchley, N . Sifakis, C. Kontoes, and P. Xofi s, ―Kernel base d r e -classificatio n of Eart h obser vation data for fin e scale habitat mapping,‖ Jour nal for Na ture Conse rvation , vol. 1 3, p p - 91 - 99, 20 05 . [7] H. Cardot, R. Faivr e, and M. Gou lar d, ―Functional approa ches for predicting la nd use with th e tempora l evoluti on of coar se resolution remote s ensing data,‖ Jo urn al of Applied Statistics , vol. 3 0 , pp - 1185 - 119 9, 2003 . [8] L. Jun wu, R. L . Kin g and N. You nan, ―An u nmixing a lg orithm base d on v ic inal i nfor mation,‖ Geo scien ce a nd Remo te Sen sing S ymp osium, 200 2. IGARSS '02 . 2002 IEEE In tern ation al, vol. 3, pp. 145 3 – 1 455 2002 [9] G. M. F oody, R. M . Luca s, P. J. Curra n an d M. Honzak, ―N on -linear mixure modeling with out e nd members using an arti ficial n eural network,‖ In terna tiona l J our nal of Remo te S en sing , vol. 1 8, pp. 93 7 – 953 , 1997. [10] L. J iang, L . M. B ru ce, ―I mproving the accura cy of lin ear pix el unmixing v ia ap propria te endm emb er di mensionality r edu ction,‖ Adva nce s in Techniq ues for Ana lysis of Remote ly S ens ed Data , 20 03 IEEE W orks hop on 27 -28 Oct. pp . 157 – 16 2, 200 3. [11] L. Jia ng, B. L. M. Bruce a nd A. Mathur, ―Wa velet tran sform for dimensionalit y r edu ction in hyp erspectral linear unmixi ng,‖ Geos cienc e and Remo te S en sing S ymposium, 2002 . IGARSS '02. 2002 IEEE Intern ation al, vol. 6, pp. 35 13 – 35 15, 24-28 Ju ne 200 2. [12] L. M. Bru ce, C. Morgan a nd S. Lar sen, ―Aut omat ed det ection o f subpixel h ypersp ectral tar get s wit h conti nuous a nd discrete wavelet transfor ms,‖ IEE E Tran sac tions on Geoscience and Remo te Sen sing , vol. 39 , pp. 2217 – 22 26 , 2001. [13] J. E. Ball, L. M. Bruce, N.H . Y ounan, ― Hyp erspectral Pix el Unmix ing via Spectra l Band Selection a nd DC -Insensitiv e Singula r Valu e Decompo sition, IEE E Tra nsa ction o f Ge oscie nce a nd Re mote Se nsin g Letters , v ol. 4, pp . 382 – 38 6, 2007. [14] J.A. B enediktsson, J. A. Pal ma son, a nd J .R. Sveinsson, ―Cla ssificatio n of hyperspectral data fro m u rban areas based on extende d morphological pro files, IE EE Tran sac tions o n Ge oscience and Remote S ensin g , vo l. 43 , pp. 48 0 – 491 , 2005. [15] F. Va n D er M eer, ―Cla ssification of hi gh spectra l r esoluti on i magery using an indicator kriging b a sed te chnique,‖ In Geostatist ics Troia ’92, vol. 2 , pp. 82 9-840 , 1993 . [16] F. V a n De r Meer , ―Ex tra ction of mineral absorptio n fe atur e s fro m high – s pectral r esolution data usin g non -para metric geo statistical techniqu es,‖ Interna tiona l Journal of Remote Sensing , vo l. 15, pp. 2198 -2214, 1994 . [17] F. Va n Der Meer, ―P erforma nce of in dicator classifier o n simulat ed image data,‖ In tern ation al Journa l of Remote Sensing , vol. 17 , p p. 621 -627, 1996. [18] http:// www.nr sa.gov.in /satellite s/irs -1d.html [19] http:// www.a sdi.co m/product s -fshh-fshhp.asp [20] R. Singh, P . D. Semwal, A . Ra i, and R . S . C h hikara, ―Small ar ea estimation of crop yi eld u sing r em ote sensing satellit e data,‖ Intern ation al Journ al of Remo te Se nsing , vol. 23, p p. 49 - 56, 2002 . [21] IDRISI 32, relea se 2 , G uide to G IS a nd Image Processin g , vol . 1 , Clark labs, USA, 200 1, pp. 1 - 171. [22] J. C. Pri ce, ―Sp ecial i ssue on ra diom etric calibratio n of satellit e data,‖ Remote S ensin g of Env ironm ent , vol. 22 (1), pp. 1 -158, 19 87. [23] P. S. C havez, ― An impr oved dark object sub straction t echnique for atmospheri c scattering correcti on of multispectral data,‖ Remo te Sen sing and Environ ment, vol . 24 pp. 45 9-479 , 198 8. TABLE II CORRELATION COEFFICIENTS ( ST ATISTICALLY D IFFERENT AT α = 0.0 5 ) AS A MEASURE OF ASSOCIATI ON BETWEEN WIF S CLASSIFIED DATA AND LISS III CLASSI F IED DATA CLASSIFIER MXL BAY CLASS BEL CLASS FUZZY CLASS KRIGE CLASS Wheat 0.75 0.78 0.76 0.76 0.82 Mustard 0.76 0.75 0.76 0.73 0.82 Other Veg etation 0.76 0.76 0.72 0.75 0.71 Shallow Wat er 0.75 0.72 0.75 0.76 0.81 Deep Water 0.76 0.72 0.72 0.76 0.81 Building s 0.75 0.82 0.72 0.72 0.81 Road 0.75 0.75 0.78 0.75 0.81 T ABLE III E STIMATED CROP AREA UN DER WHEAT AND MUSTARD FR OM WIFS / IRS 1D FOR THE STATE OF H ARYANA , I N DIA DURING F EBRUARY 16, 1998 ( ha ) Classifier Wheat % Dev 1 Mustard % Dev 2 GCES 200 0,000 612 ,000 MAXLIKE 1,68 4,582 -15.770 9 508 ,235 -16.955 1 BAYCL ASS 1,84 4,554 -7.7723 522 ,576 -14.611 8 BELCL ASS 1,84 5,392 -7.7304 528 ,348 -13.668 6 KRIGECLA SS h = 10 00 m 1,85 8,456 -7.0772 536 ,035 -12.412 6 h = 23 5 m 1,89 4,683 -5.2658 557 ,525 -8.9011 h = 188 m 1,89 8546 -5.0727 585 ,341 -4.3 560 1 Cal culated as: % Deviati on= [GCE S+/Wh eat)×10 0] -100; 2 Cal culated as: % Deviati on= [GCE S+/Mu stard)×10 0] -100 ; -1 - 0 ( f) (g) (h) (i) (j) (a) (b) (c) (d) (e) Fig. 3. Ima g es of t wo clo seness measure s: (a -e) the mean squa re error ( S, fi r st ro w) & (f-j) the cross entrop y ( D, se cond ro w) u sing M AXLI KE, BAYCL ASS, BELCL ASS, FUZZYCL ASS, KRIGECL ASS r espectivel y. TABLE I T HE MEAN , MEDIAN AND STANDARD DEVIA TION (SD) OF THE DISTR IBUTIONS OF TWO C LOSENESS MEASURES (S & D) F OR DIFFERENT CLASS IFICATIONS . Measure o f closenes s Classifier S (Mean Square Erro r) D (Cross Entr opy) Mean Median SD Mean Median SD MAXLIKE 0.09 64 0.09 46 0.06 65 0.08 45 0.08 45 0.06 45 BAYCL ASS 0.08 45 0.08 56 0.05 56 0.07 12 0.07 10 0.06 54 BELCL ASS 0.07 66 0.07 61 0.07 51 0.06 51 0.06 95 0.05 14 FUZZYCL ASS 0.06 89 0.06 78 0.05 35 0.04 14 0.05 42 0.06 02 KRIGECLA SS h = 23.5 m 0.02 053 0.02 075 0.02 62 0.02 10 0.02 11 0.02 47 h = 1000 m 0.03 063 0.03 119 0.02 68 0.03 46 0.03 34 0.03 90 h = 188 m 0.01 766 0.01 824 0.02 83 0.01 12 0.01 02 0.02 59
Original Paper
Loading high-quality paper...
Comments & Academic Discussion
Loading comments...
Leave a Comment