The utility of a convolutional neural network for generating a myelin volume index map from rapid simultaneous relaxometry imaging
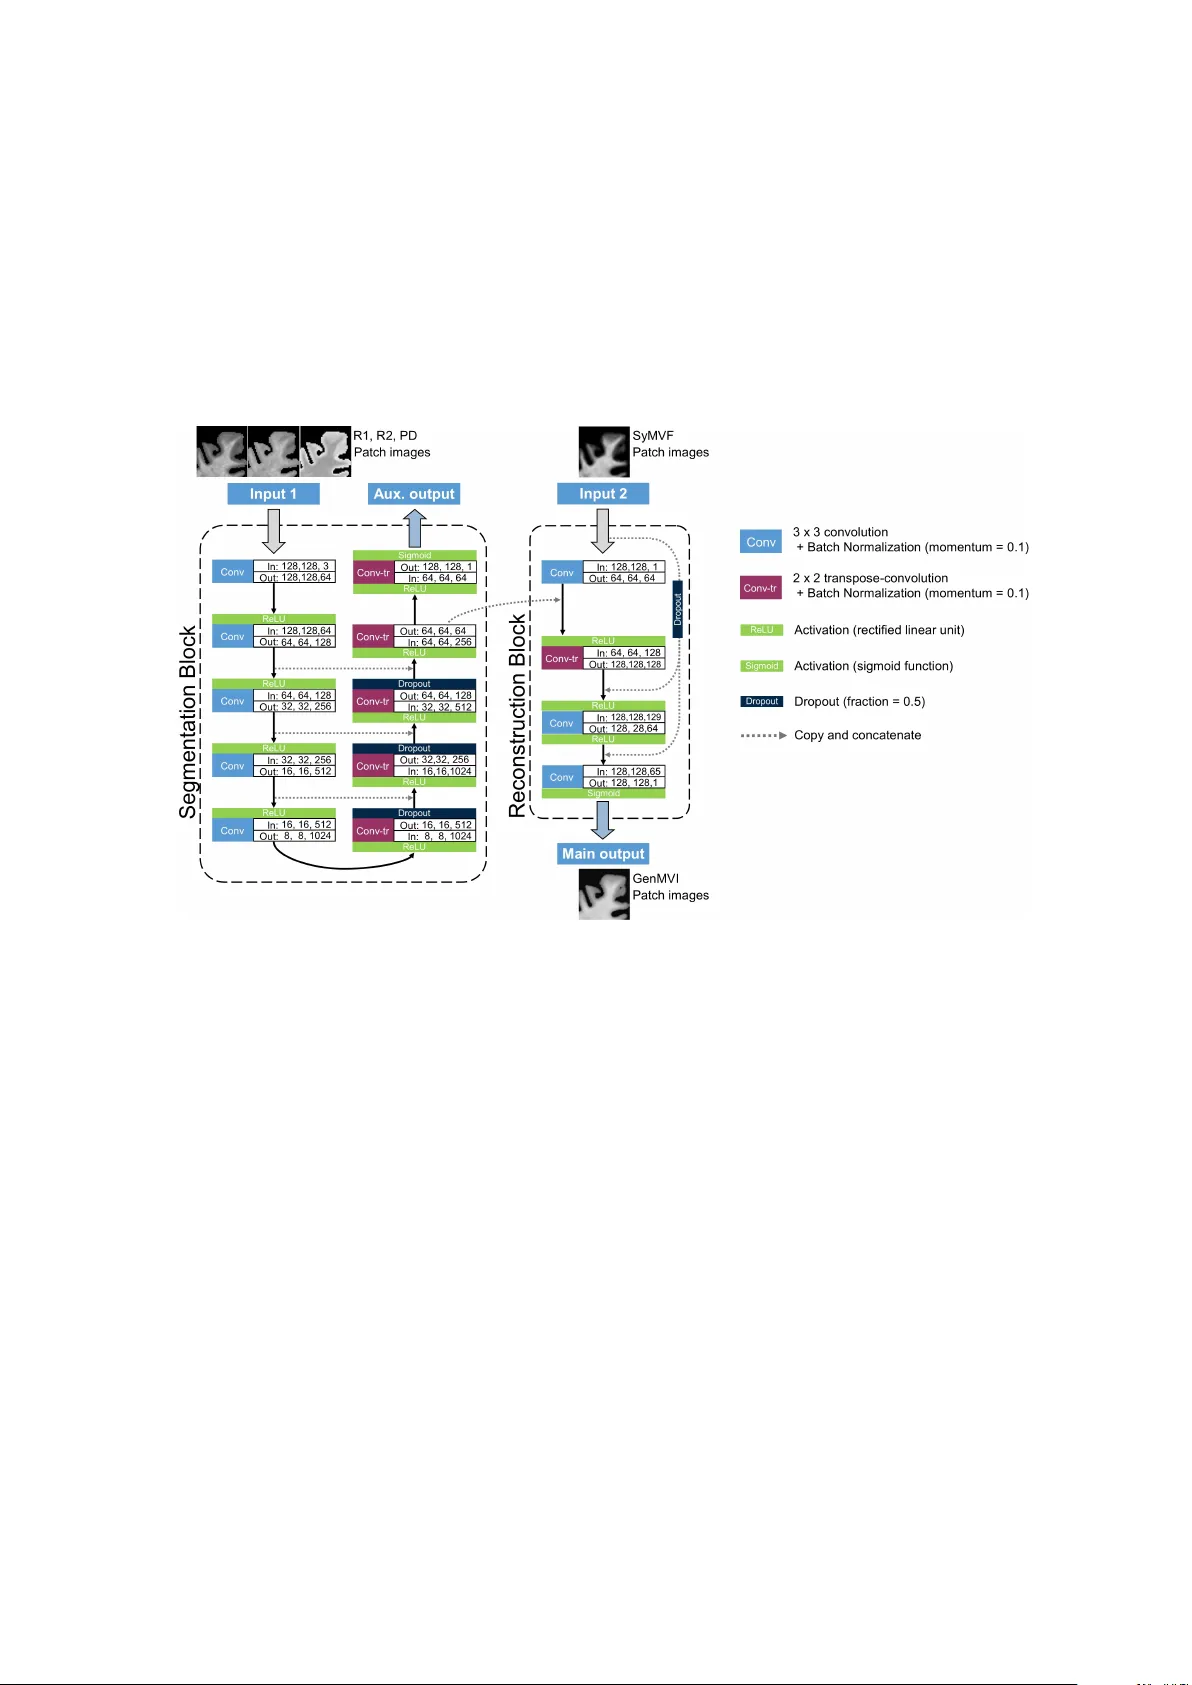
Background and Purpose: A current algorithm to obtain a synthetic myelin volume fraction map (SyMVF) from rapid simultaneous relaxometry imaging (RSRI) has a potential problem, that it does not incorporate information from surrounding pixels. The pur…
Authors: Yasuhiko Tachibana (1, 2), Akifumi Hagiwara (2
The utilit y of a con v olutional neural net w ork for generating a m y elin v olume index map from rapid sim ultaneous relaxometry imaging Y asuhik o T ac hibana 1 , 2 , Akifumi Hagiw ara 2 , 3 , Masaaki Hori 2 , Jeff Kersha w 1 , Misaki Nak aza wa 2 , T okuhik o Omatsu 1 , Riw a Kishimoto 1 , Kazumasa Y ok oy ama 4 , Nobutak a Hattori 4 , Shigeki Aoki 2 , T atsuy a Higashi 1 , and T ak a yuki Obata 1 1. Department of Molecular imaging and Theranostics, National Institute of Radiological Sciences, QST, 4-9-1, Anaga w a, Inage-ku, Chiba, Japan, 263-8555 2. Departmen t of Radiology , Jun tendo Univ ersit y Sc ho ol of Medicine, 2-1-1, Hongo, Bunky o-ku, T okyo, Japan, 113-8421 3. Departmen t of Radiology , Graduate Sc ho ol of Medicine, The Universit y of T okyo, 7-3-1, Hongo, Bunky o-ku, T okyo, Japan, 113-8655 4. Departmen t of Neurology , Jun tendo Universit y School of Medicine, 2-1-1, Hongo, Bunky o-ku, T okyo, Japan, 113-8421 Email: tachibana.y asuhiko@qst.go.jp Abstract Bac kground and Purpose: A curren t algorithm to obtain a synthetic my elin v ol- ume fraction map (SyMVF) from rapid sim ultaneous relaxometry imaging (RSRI) has a potential problem, that it do es not incorporate information from surrounding pixels. The purp ose of this study was to dev elop a metho d that utilizes a conv olu- tional neural net w ork (CNN) to ov ercome this problem. Metho ds: RSRI and magnetization transfer images from 20 healthy volun teers w ere included. A CNN was trained to reconstruct RSRI-related metric maps in to a my elin v olume-related index (generated m yelin volume index: GenMVI) map using the m y elin volume index map calculated from magnetization transfer images (MTMVI) as reference. The SyMVF and GenMVI maps w ere statistically compared b y testing ho w w ell they correlated with the MTMVI map. The correlations were ev aluated based on: (i) av eraged v alues obtained from 164 atlas-based ROIs, and (ii) pixel-based comparison for ROIs defined in four different tissue types (cortical and sub cortical gray matter, white matter, and whole brain). Results: F or atlas-based R OIs, the ov erall correlation with the MTMVI map was higher for the GenMVI map than for the SyMVF map. In the pixel-based com- parison, correlation with the MTMVI map w as stronger for the GenMVI map than for the SyMVF map, and the difference in the distribution for the volun teers was significan t (Wilco xon sign-rank test, P < .001) in all tissue t yp es. Conclusion: The prop osed metho d is useful, as it can incorp orate more sp ecific information ab out lo cal tissue prop erties than the existing metho d. 1 1 Intro duction Measuring my elin v olume using MRI is useful for ev aluating the developmen t and aging of h umans and for assessing the progression of degenerativ e or demy elinating diseases [1-3]. How ev er, MRI-based metho ds remain problematic because none of the existing tec hniques can replace pathological measurement, and moreo v er, its length y scan-time [1]. Recen tly , rapid sim ultaneous relaxometry imaging (RSRI) was dev elop ed to measure the longitudinal relaxation rate (R1), transv erse relaxation rate (R2), proton densit y (PD), and the lo cal B1 field from a single scan within an acceptable scan-time [4]. The metrics can b e used to estimate the my elin volume fraction using a commercial soft- w are pac k age (SyMRI) [5]. The my elin volume fraction estimated with SyMRI (i.e. SyMVF) was rep orted as b e ing highly correlated with a widely used measure of m yelin obtained from magnetization-saturation imaging (MTsat) [6, 7], namely the magnetiza- tion transfer-based my elin v olume index (MTMVI) [1]. The usefulness of SyMVF has already b een noted in several applications [8-11]. Ho wev er, there migh t be room for impro vemen t in the algorithm used to estimate a SyMVF map. The SyMVF metric is determined pixel-b y-pixel from a lo okup-table that connects combinations of R1, R2, and PD v alues to a my elin volume fraction [9], meaning that a pixel with a certain com- bination of R1, R2, and PD v alues is alwa ys assigned the same my elin volume fraction without considering any lo cal properties. As tissue structure differs in different areas of the brain (e.g. neuron count [12], neuron fib er radius [12, 13], iron deposition), this could lead to inaccuracy when generating the SyMVF map. Adding information ab out lo cal tissue prop erties ma y strengthen the accuracy and reliability of the output m yelin v olume fraction map. Recen tly , the con volutional neural net w ork (CNN) technique achiev ed great success for image segmen tation of man y areas in the h uman b o dy [14-17]. As the shap e of the data of each lay er of a CNN is generally unrestricted, taking the pro cessing stream from one CNN and adding it to the function of another CNN is p ossible (e.g. [15-17]). Based on this idea, this study combines a CNN for segmen tation with another simple CNN designed for general non-linear reconstruction so that the finally generated my elin v olume index (GenMVI) is more sp ecific to the c haracteristics of the tissue in eac h pixel. The purp ose of this study was to ev aluate the usefulness of this metho d for estimating m yelin-v olume in h uman brain. 2 Materials and Metho ds This is a retrosp ectiv e study . The data used in this study was originally acquired for another previous study [1]. This study w as approv ed by the IRB of Juntendo Univ ersit y . W ritten informed consent was obtained from all participants. 2 2.1 Study pa rticipants Tw ent y healthy v olun teers, nine males (25 to 67 years, mean 53.2 years) and elev en females (44 to 71 y ears, mean 57.0 years), without neurological or psyc hological history , w ere included as sub jects. Images acquired from the sub jects w ere screened by tw o b oard-certified radiologists (Y.T. and A.H., 12 and 5 years of exp erience interpreting brain MRI, resp ectively) to confirm that no mo derate-to-severe white-matter isc hemic lesions (F azek as grade 2 or more [18]), asymptomatic cerebral infarction, or regional brain atrophy existed. 2.2 Image acquisition and data p ro cessing to generate SyMVF and MTMVI maps All scans in this study w ere p erformed by 3T MRI scanner (MAGNETOM Prisma, Siemens Healthcare, Erlangen) using a 64-channnel head coil. Images w ere acquired using the QRAPMASTER imaging sequence [1], whic h has t wo differen t TEs (i.e. 22 and 99 ms) and four differen t saturation delay times (i.e. 170, 620, 1970, and 4220 ms) in a single scan. The other ma jor parameters for QRAPMASTER were: TR 4250 ms; field of view 230 × 186 mm; matrix 320 × 186; slice thickness /gap 4.0 /1.0 mm. The acquired images w ere pro cessed using SyMRI 8.0 soft ware (Syn theticMR, Linkoping, Sweden) to obtain R1, R2, PD, and SyMVF maps. A brain-area probabilit y map (BAP) and syn thetic T1-w eigh ted image were also automatically generated during this pro cess. Imaging with magnetization-transfer (MT) w eighting was p erformed as a first step to obtain MTMVI images. Images w ere acquired using FLASH sequence with T1-, PD-, and magnetization transefer-weigh tings. TR and excitation flip angle were set at 10 ms and 13 degrees for T1-weigh ted images, and 24 ms and 4 degrees for PD- and MT- w eighted images. An off-resonance Gaussian-shaped RF pulse (frequency offset from w ater resonance 1.2 kHz, pulse duration 9.984 ms, and nominal flip angle 50 degrees) w as adopted for the MT-w eighted images. The other ma jor parameters were: field- of-view 224 × 224 mm; matrix 128 × 128; slice thic kness 1.8 mm. The MTsat map w as calculated from the images as describ ed in a previous rep ort [1], and it was then scaled as describ ed in the next tw o sections to generate a final MTMVI map. 2.3 ROI definition The Johns Hopkins Univ ersity (JHU) ICBM-DTI-81 WM lab els atlas [19, 20] and Automated Anatomical Lab eling (AAL) atlas [21, 22] were used to define 48 lo cal ROIs for the WM area, and 108 and 8 R OIs for the cortical and sub cortical GM areas, resp ec- tiv ely . Lo cal R OIs of the atlases w ere registered to SyMVF v olumes for eac h v olunteer. First, the synthetic T1-w eighted image volume of a v olunteer was registered to the MNI152 template using the FMRIB Softw are Library (FSL) linear and non-linear image registration to ols (FLIR T and FNIR T) [23, 24]. The warp function defined in this registration was then in verted to w arp the atlas ROIs (total 164 lo cal R OIs) to fit the v olunteer’s SyMVF space. In addition, the w arp ed ROIs w ere group ed and merged to 3 form another set of R OIs: cortical GM (R OI cGM ), sub cortical GM (R OI sGM ) and WM (R OI WM ). These three R OIs were eroded once with an eight-connected-neigh b orho o d rule to av oid partial-v olume effects at the margins of eac h tissue type. Note that when using one of the 164 local R OIs in the analysis, pixels within the ROI that had b een ero ded from either R OI cGM , ROI sGM , or ROI WM w ere remo v ed for the same reason. In addition, a whole brain R OI (R OI WB ) w as created b y merging R OI cGM , ROI sGM , and R OI WM . F urthermore, lo cal ROIs corresp onding to the genu, b o dy , and splenium of the corpus-callosum were merged to form a single ROI for the corpus-callosum (ROI CC ). R OI definition for the MTsat vol ume w as p erformed in the same wa y as for the SyMVF map, except that a 3D T1-weigh ted image volume w as used instead of a synthetic T1-w eighted image v olume. 2.4 MTMVI maps MTsat v olumes w ere scaled to create the MTMVI map so that all m y elin-related map images in this study are on the same scale. F or each MTsat and SyMVF v olume pair, pixels in the WM area were extracted and a v eraged using the R OI WM defined for eac h volun teer in the previous section. The MTMVI volume was created by multiplying MTsat v olume by a constan t scaling v alue so that the av erage v alues of pixels in R OI WM w ere equal for the SyMVF and MTMVI volumes. Finally , eac h MTMVI v olume w as nonlinearly registered to the SyMVF volume space of the same volun teer. The Adv anced Normalization T o ols (ANTS, antsRegistrationSyN- Quic k.sh, h ttp://stna v a.github.io/ANTs/) pack age [25] was used for this purp ose. 2.5 Deep-lea rning-based method to obtain my elin volume index 2.5.1 Image prepa ration Computing pro cedures described in this section w ere p erformed using our in-house soft ware running on MA TLAB 2017b R (Mathw orks, Natick). T o create a dataset for training, first, 32 × 32-pixel patch images w ere randomly subsampled from eac h slice of all image v olumes (i.e. R1, R2, PD, BAP , SyMVF, and MTMVI) corresp onding to eac h v olunteer. Patc hes including brain area (defined from BAP map as pixels with proba- bilit y > 0.95) of less than half of the whole area were excluded. Finally , appro ximately 6000 patch sets w ere subsampled from eac h v olunteer. All subsampled patc hes were resized to 128 × 128. T o create another dataset for testing, a similar subsampling pro cedure was rep eated for eac h volun teer. F or testing data, the patc hes w ere not randomly subsampled but regularly in five-pixel strides. 2.5.2 CNN training and generating GenMVI volumes The designed CNN net work consists of a segmentation blo ck for acquiring local in- formation from R1, R2, and PD maps, and a reconstruction blo c k for adding that infor- mation to the corresp onding SyMVF map. Details are describ ed in Figure 1. 4 Figure 1: The net work arc hitecture designed for this study . The netw ork con- sisted of a segmentation blo ck and a reconstruction blo ck. The segmentation blo ck has a contracting pathw a y on the left side and an expanding pathw a y on the right side. The blo c k w as designed to extract lo cal information from the R1, R2, and PD maps. The reconstruction blo ck reconstructs the corresp onding SyMVF map into a new map image (generated my elin volume index: GenMVI). The n um b ers indicated at eac h con volu- tional (Con v) or transp ose-conv olutional (Con v-tr) lay er describ e the size of the input and output images (rows, columns, and channels) for the lay er. 5 T o create a GenMVI map for a particular v olunteer, data from the other 19 w ere used to train a CNN for that volun teer (leav e-one-out cross-v alidation). The 19 volun- teers were randomly assigned to tw o groups of 15 and 4 sub jects to create training and v alidation data sets. Gaussian noise was added to the training data to a void ov erfitting. T raining w as p erformed using the T ensorflow-gpu (version 1.8.0) [26] platform with Keras [27] (version 2.1.6). Calculations were p erformed b y computer equipp ed with: dual CPU, Intel Xeon R E5-2623v4; dual GPU, Nvidia TitanX R Pascal, 12GB GDDR5X; 128 GB random access memory; Ubun tu 16.04L TS. R1, R2, and PD patches w ere input to the segmen tation blo ck, and the SyMVF patches w ere input to the reconstruction blo c k. As loss-function, the ro ot-mean-square-error (RMSE) with respect to MTMVI w as obtained for b oth main output and auxiliary outputs, and then summed after mul- tiplying RMSE of the auxiliary output b y 0.2. The Adam algorithm [28] w as applied for optimization, where the learning rate started from 0.0001 at the first ep o ch and then decreased according to the hyperb olic function, lr ( n ) = tanh (1 . 8 − 0 . 3 n ) + 1 2( tanh (1 . 5) + 1) where l r ( n ) is the learning rate for epo ch n umber n . The maxim um num b er of ep o chs for training w as set at 10, but training was ab orted when the loss obtained at the end of each ep o ch using the v alidation data did not decrease for three consecutive ep o c hs. After completion of training, a GenMVI map w as generated for each volun teer by test dataset. The dataset for each v olunteer w as input to a trained CNN (i.e. trained by the other 19 volun teers for each volun teer) to obtain main output as GenMVI patches. The output patches were re-orientated to form a whole GenMVI volume. 2.6 Statistical analysis 2.6.1 Analysis based on averaged value of pixels inside ROIs The 164 lo cal ROIs were separately applied to the MTMVI, SyMVF, and GenMVI maps of the v olunteers. The v alues of the pixels included in eac h ROI w ere a veraged and recorded. The absolute difference of the a v eraged v alues of the SyMVF and MTMVI maps were calculated for eac h lo cal R OI (∆Sy), and the same was done for the GenMVI and MTMVI maps (∆Gen). ∆Sy and ∆Gen were statistically compared for each of the following four regions: (i) cortical GM (consisting of 108 ROIs), (ii) sub cortical GM (consisting of 8 R OIs), (iii) WM (consisting of 48 ROIs), and (iv) whole brain (consisting of all 164 ROIs). The Wilco xon signed-rank test was applied and P < .05 was considered significan t. F or further comparison, Pearson’s correlation analysis was p erformed b etw een MT- MVI and SyMVF, and b etw een MTMVI and GenMVI for the a v eraged v alues calculated for a total of 3280 lo cal ROIs (164 ROIs from each of the 20 v olunteers). 6 Figure 2: T ypical MTMVI, SyMVF, and GenMVI maps obtained from the same v olunteer. Visually , the con trast of the GenMVI map is more similar to MTMVI than that of the SyMVF map (See the corpus callosum area as a particular example). 2.6.2 Pixel-based comparison within ROIs R OI cGM , R OI sGM , R OI WM , and ROI WB w ere applied to each volun teer. The pixels in these four R OIs w ere extracted and used to calculate a pixel-based Pearson’s correlation co efficien t for b oth SyMVF and GenMVI in comparison to MTMVI, for each v olunteer. Distributions of SyMVF-based and GenMVI-based correlation co efficients for the 20 v olunteers were compared statistically for all four ROIs. Wilco xon signed-rank test was applied for this purp ose and P < .05 was considered significant. In addition, a similar pixel-based comparison was p erformed for R OI CC . 3 Results Examples of MTMVI, SyMVF, and GenMVI maps from the same volun teer are sho wn in Figure 2. 3.1 Results based on averaged value of pixels inside ROIs The distribution and relationship b etw een the av eraged v alues of the MTMVI, SyMVF, and GenMVI maps for the 164 lo cal ROIs are illustrated in scatterplots (Figure 3). The median and minimum to maximum ranges of these metrics for cortical GM, sub cortical GM, WM, and whole brain areas are indicated in T able 1. The median and range of 7 Figure 3: Scatter plots of the a verage v alues in the 164 lo cal ROIs: correlation b et w een (left) the MTMVI and SyMVF maps (R=0.77), and (right) the MTMVI and GenMVI maps (R=0.86). Overall, the v alues are more consistent b etw een maps for the latter comparison. the absolute differences with resp ect to MTMVI (i.e. ∆Sy and ∆Gen) are also shown in T able 1. The median v alue of ∆Gen w as smaller than that of ∆Sy for all areas, with all differences being significant (P < .001). P earson’s correlation co efficient obtained from all lo cal R OIs from the 20 v olunteers w as larger for MTMVI and GenMVI (R=0.86) than for MTMVI and SyMVF (R=0.77) (Figure 3). Both correlations w ere significan t (P < .001). T able 1: The absolute errors b et ween the SyMVF and MTMVI maps ( ∆ Sy), and b et ween the GenMVI and MTMVI maps ( ∆ Gen) cortical GM Sub cortical GM WM Whole Brain MTMVI 0.23 [0.08, 0.39] 0.24 [0.19, 0.30] 0.32 [0.17, 0.49] 0.25 [0.08, 0.49] SyMVF 0.10 [0.06, 0.15] 0.20 [0.14, 0.28] 0.32 [0.19, 0.43] 0.11 [0.06, 0.43] GenMVI 0.24 [0.14, 0.35] 0.25 [0.21, 0.31] 0.32 [0.20, 0.45] 0.26 [0.14, 0.45] ∆Sy 0.13 [0.00, 0.29] 0.04 [0.00, 0.11] 0.02 [0.00, 0.12] 0.10 [0.00, 0.29] ∆Gen 0.02 [0.00, 0.15] 0.01 [0.00, 0.06] 0.01 [0.00, 0.11] 0.02 [0.00, 0.15] P-v alue < .001 < .001 < .001 < .001 Results are presented as median [min, max]. 8 Figure 4: The b o x plots show the distribution of pixel-wise correlation co- efficien ts obtained by comparing the SyMVF and GenMVI maps with the MTMVI map for the four R OIs corresp onding to the cortical GM, sub cortical GM, WM, and whole brain (i.e. R OI cGM , ROI sGM , ROI WM , and ROI WB ), for all 20 v olunteers. The median v alues are higher for the GenMVI map than for the SyMVF map, and the differences of the distributions are significant in all four areas (Wilco xon signed-rank test, P < .001). 3.2 Results of pixel-based comparison within ROIs Distributions of pixel-based correlation-co efficien ts for the 20 v olunteers for eac h of R OI cGM , R OI sGM , R OI WM , and ROI WB are illustrated in b ox-plot graphs (Figure 4). Strong correlation betw een MTMVI and GenMVI w as found for all four R OIs, where median v alues of the correlation co efficients were alwa ys higher than 0.80. On the other hand, those for SyMVF were lo wer than 0.7 except for ROI WM , for which the v alue was 0.70. Distributions for SyMVF and GenMVI w ere significan tly differen t for all four R OIs (P < .001). The result of an additional pixel-wise comparison for ROI CC is also illustrated in a b o x-plot graph (Figure 5). The correlation w as moderate for GenMVI (median v alue 0.56), but it w as stronger than that for SyMVF (median v alue 0.21). The difference in distributions was significant (P < .001). 4 Discussion This study was designed to ev aluate the usefulness of a CNN-based metho d for estimating a m yelin-v olume index map from RSRI images. Com bining the ov erall results, it seems that the metho d prop osed in this study successfully reconstructs the contrast 9 Figure 5: The b o x plots sho w the distribution of pixel-wise correlation co effi- cien ts obtained b y comparing the SyMVF and GenMVI maps with resp ect to the MTMVI map using the corpus-callosum ROI (ROI CC ). The correlation co efficien t obtained for a GenMVI map is alwa ys higher than that obtained for the cor- resp onding SyMVF map. The difference is significant (P < .001, Wilco xon signed-rank test). of a SyMVF map of health y brain in to a new contrast that is more strongly related to the corresp onding MTMVI map. 4.1 CNN a rchitecture The segmentation blo ck aimed to comp ensate for the p otential w eak p oint of a SyMVF map, namely , not containing an y information ab out lo cal tissue structure. The segmen tation blo ck consists of many con volutional lay ers b etw een input and output, whic h means that the v alue assigned to a pixel at the output incorp orates information from a relatively wide area surrounding the pixel in the input image (i.e. maxim um 32 × 32-pixel area). This blo ck w as designed based on U-net [14], which is a netw ork that has ac hieved great success when used to segmen t v arious anatomical and histological images [29-31]. The o v erall CNN designed in this research aimed to utilize the high capability of CNN for flexible image segmen tation and reconstruction, while at the same time designing the net work so that the priority of the SyMVF map as input is relativ ely high (e.g. shortcuts in reconstruction block that sent SyMVF images to later lay ers without being merged with the input from the segmentation blo ck). The design aimed to lessen the blac k b o x problem [32, 33] as muc h as p ossible by using SyMVF, whic h has a logical foundation (i.e. Blo c h sim ulation), as basic starting point and giving more priority in the o v erall net work design. 4.2 Compa rison of SyMVF and GenMVI with resp ect to MTMVI Visually , the con trast of the GenMVI map w as closer than the contrast of SyMVF to that of MTMVI (Figure 2). In particular, characteristics of the corpus callosum w ere 10 b etter repro duced in the GenMVI map than in the SyMVF map. The corpus callosum w as where the contrast was esp ecially different b etw een the SyMVF and MTMVI maps in a previous study [1]. The metho d prop osed in this study app ears to hav e impro ved this problem. F rom analysis using the av eraged v alues of the 164 lo cal R OIs, v alues of the GenMVI map were more similar to the MTMVI map for different brain areas than those of the SyMVF map (Figure 3, T able 1). In addition, even though the correlation for SyMVF w as also strong (R=0.77), whic h is consisten t with a previous study [1], the o verall linear correlation with MTMVI was higher for GenMVI (R=0.86) (Figure 3). The results of the pixel-based comparisons further support the results of the atlas- based comparison, namely , that the GenMVI map has a stronger correlation with MT- MVI than the SyMVF map do es (Figure 4). Pixel-based comparison w as added b ecause the results using a veraged v alues for eac h R OI are p oten tially biased by a p ossible dif- ference in pixel num b er in eac h R OI. The pixel-based comparison p erformed for the corpus callosum indicated higher cor- relation for GenMVF ov er SyMVF, with a statistically significan t difference b etw een the t wo distributions (P < .001) (Figure 5). This result is consisten t with the visual ev aluation of the region (Figure 2). Curren tly , one of the great adv an tages of SyMVF ov er simpler and less time-consuming m yelin-related indices ma y b e its high correlation with the widely used MTMVI map [1]. The prop osed GenMVI maps may improv e on the adv antages of the SyMVF maps to expand the capabilit y tow ards possible clinical use. How ever, MTMVI is still not a golden standard that is comparable to pathology . Thus, the fact that the contrast of the GenMVI map was closer than the SyMVF map to the MTMVI map does not directly mean that the GenMVI map is more accurate than the SyMVF map. F urther study using pathology-based measures of m yelin v olume as a target during training is desir- able. Moreov er, since the GenMVI map has the limitation that its logical foundation is relativ ely w eak, further clinical v alidation is also imp ortant. A p ossible impro vemen t for the prop osed metho d would be to include new infor- mation in addition to the current input. The most promising candidates are v arious diffusion-related metrics [34, 35], suc h as apparen t diffusion co efficient (ADC), fractional anisotrop y (F A), and other metrics obtained from diffusional kurtosis imaging (DKI). It is well established that these parameters are closely related to the lo cal micro-structure and my elin v olume conten t in some tissues including dem y elinating lesions [34]. The ad- ditional information may help to appropriately estimate my elin v olume esp ecially when the target will b e expanded to pathological brains. As a limitation of this study , the MTMVI maps were warped to register the images to R1, R2, PD and SyMVF maps obtained from RSRI. A small mis-registration migh t ha ve affected the training, as well as the final results of the statistical analysis. 11 5 Conclusion In conclusion, the deep-learning-based method proposed in this study generated a m yelin-v olume index from RSRI that incorp orates more sp ecific information ab out lo cal tissue properties than the existing technique. How ever, further w ork is necessary to v alidate the prop osed metho d so that it might b e emplo y ed for clinical use. Ackno wledgement The authors appreciate the assistance of Hirok o Kamada and Etsuko Mitsui during the study . This work was supp orted b y AMED under grant n um b er JP18lk1010025; ImP A CT Program of Council for Science, T echnology , and Inno v ation (Cabinet Office, Go vern- men t of Japan); JSPS KAKENHI grant num b er 17K10385; JSPS KAKENHI gran t n um- b er 16K19852; JSPS KAKENHI gran t num b er JP16H06280, Grant-in-Aid for Scientific Researc h on Innov ativ e Areas– Resource and T ec hnical Supp ort Platforms for Promot- ing Research “Adv anced Bioimaging Supp ort”; and the Japanese So ciety for Magnetic Resonance in Medicine. References [1] Hagiwara A, Hori M, Kamagata K et al (2018) Myelin Measuremen t: Compari- son Betw een Simultaneous Tissue Relaxometry , Magnetization T ransfer Saturation Index, and T1w/T2w Ratio Metho ds. Sci Rep 12:10554 [2] Alonso-Ortiz E, Levesque IR, Pike GB (2015) MRI-based m yelin w ater imaging: A tec hnical review. Magn Reson Med 73:70-81 [3] Mezer A, Y eatman JD, Stiko v N et al (2013) Quantifying the local tissue volume and comp osition in individual brains with magnetic resonance imaging. Nat Med 19:1667-1672 [4] W arntjes JB, Leinhard OD, W est J, Lundb erg P (2008) Rapid magnetic resonance quan tification on the brain: Optimization for clinical usage. Magn Reson Med 60:320-329 [5] Hagiwara A, W arn tjes M, Hori M et al (2017) SyMRI of the Brain: Rapid Quan- tification of Relaxation Rates and Proton Densit y , With Synthetic MRI, Automatic Brain Segmentation, and Myelin Measurement. Inv est Radiol 52:647-657 [6] Helms G, Dathe H, Kallenberg K, Dechen t P (2008) High-resolution maps of magne- tization transfer with inherent correction for RF inhomogeneity and T1 relaxation obtained from 3D FLASH MRI. Magn Reson Med 60:1396-1407 12 [7] Campb ell JSW, Lepp ert IR, Nara yanan S et al (2017) Promise and pitfalls of g-ratio estimation with MRI. Neuroimage 182:80-96. [8] Hagiwara A, Hori M, Y ok oy ama K et al (2017) Synthetic MRI in the Detection of Multiple Sclerosis Plaques. Am J Neuroradiol 38:257-263 [9] W arntjes M, Engstrom M, Tisell A, Lundb erg P (2016) Mo deling the Presence of Myelin and Edema in the Brain Based on Multi-P arametric Quantitativ e MRI. F ront Neurol 7:16 [10] Andica C, Hagiwara A, Hori M et al (2018) Automated brain tissue and my elin v olumetry based on quantitativ e MR imaging with v arious in-plane resolutions. J Neuroradiol 45:164-168 [11] Hagiwara A, Hori M, Y oko yama K et al (2017) Analysis of White Matter Damage in Patien ts with Multiple Sclerosis via a Nov el In Vivo MR Metho d for Measuring My elin, Axons, and G-Ratio. Am J Neuroradiol 38:1934-1940 [12] Stiko v N, Campb ell JS, Stroh T et al (2015) In vivo histology of the my elin g-ratio with magnetic resonance imaging. Neuroimage 118:397-405 [13] Harkins KD, Xu J, Dula AN et al (2016) The microstructural correlates of T1 in white matter. Magn Reson Med 75:1341-1345 [14] Ronneb erger O, Fischer P , Brox T (2015) U-Net: Conv olutional Netw orks for Biomedical Image Segmentation. In: arXiv. Accessed 2018.12.01 [15] Litjens G, Ko oi T, Bejnordi BE et al (2017) A survey on deep learning in medical image analysis. Med Image Anal 42:60-88 [16] C ¸ i¸ cek ¨ O, Ab dulk adir A, Lienk amp SS, Bro x T, Ronneberger O (2016) 3D U-Net: Learning Dense V olumetric Segmentation from Sparse Annotation. In: arXiv. Ac- cessed 2018.12.01 [17] Perone C, Calabrese E, Cohen-Adad J (2018) Spinal cord gray matter segmentation using deep dilated conv olutions. Sci Rep 13:5966 [18] F azek as F, Cha wluk JB, Ala vi A, Hurtig HI, Zimmerman RA (1987) MR signal abnormalities at 1.5 T in Alzheimer’s demen tia and normal aging. Am J Roentgenol 149:351-356 [19] Hua K, Zhang J, W ak ana S et al (2008) T ract probability maps in stereotaxic spaces: analyses of white matter anatom y and tract-sp ecific quantification. Neuroimage 39:336-347 [20] W ak ana S, Caprihan A, Panzen b o eck MM et al (2007) Repro ducibilit y of quan tita- tiv e tractograph y methods applied to cerebral white matter. Neuroimage 36:630-644 13 [21] Tzourio-Mazoy er N, Landeau B, P apathanassiou D et al (2002) Automated anatom- ical lab eling of activ ations in SPM using a macroscopic anatomical parcellation of the MNI MRI single-sub ject brain. Neuroimage 15:273-289 [22] Schmahmann JD, Doy on J, McDonald D et al (1999) Three-dimensional MRI atlas of the human cereb ellum in prop ortional stereotaxic space. Neuroimage 10:233-260 [23] Jenkinson M, Bannister P , Brady M, Smith S (2002) Improv ed optimization for the robust and accurate linear registration and motion correction of brain images. Neuroimage 17:825-841 [24] Jenkinson M, Bec kmann CF, Behrens TE, W oolrich MW, Smith SM (2012) Fsl. Neuroimage 62:782-790 [25] Afzali M, F atemizadeh E, Soltanian-Zadeh H (2017) Sparse registration of diffusion w eighted images. Comput Metho ds Programs Biomed 151:33-43 [26] Abadi M, Barham P , Chen J et al (2016) T ensorFlow: a system for large-scale ma- c hine learning. URL http://tensorflo w.org/. Soft ware av ailable from tensorflow.org. Accessed 2018.12.01 [27] Chollet F, others. a (2015) URL. https://k eras.io. Accessed 2018.12.01 [28] Kingma DP , Lei Ba J (2017) AD AM: a metho d for sto c hastic optimization. In: arXiv. Accessed 2018.12.01 [29] Norman B, Pedoia V, Ma jumdar S (2018) Use of 2D U-Net Con volutional Neural Net works for Automated Cartilage and Meniscus Segmen tation of Knee MR Imaging Data to Determine Relaxometry and Morphometry . Radiology 288:177-185 [30] Dev alla SK, Renuk anand PK, Sreedhar BK et al (2018) DRUNET: a dilated-residual U-Net deep learning net work to segment optic nerve head tissues in optical coher- ence tomography images. Biomed Opt Express 9:3244-3265 [31] Li J, Sarma KV, Chung Ho K et al (2017) A Multi-scale U-Net for Semantic Seg- men tation of Histological Images from Radical Prostatectomies. AMIA Annu Symp Pro c 2017:1140-1148 [32] Litjens G, Ko oi T, Bejnordi BE et al (2017) A survey on deep learning in medical image analysis. Medical Image Analysis 42:60-88 [33] T achibana Y, Obata T, Kersha w J et al (2017) Deep-Neural-Netw ork based image diagnosis: comparing v arious image prepro cessing strategies to achiev e higher ac- curacy and understanding of the decision. Pro ceedings of ISMRM 2018: Num b er 0265 [34] T achibana Y, Obata T, Y oshida M et al (2015) Analysis of normal-app earing white matter of multiple sclerosis b y tensor-based t wo-compartmen t model of w ater dif- fusion. Eur Radiol 25:1701-1707 14 [35] T achibana Y, Obata T, Tsuchiy a H et al (2016) Diffusion-tensor-based metho d for robust and practical estimation of axial and radial diffusional kurtosis. Eur Radiol 26:2559-2566 15
Original Paper
Loading high-quality paper...
Comments & Academic Discussion
Loading comments...
Leave a Comment