Speech Dereverberation Using Fully Convolutional Networks
Speech derverberation using a single microphone is addressed in this paper. Motivated by the recent success of the fully convolutional networks (FCN) in many image processing applications, we investigate their applicability to enhance the speech sign…
Authors: Ori Ernst, Shlomo E. Chazan, Sharon Gannot
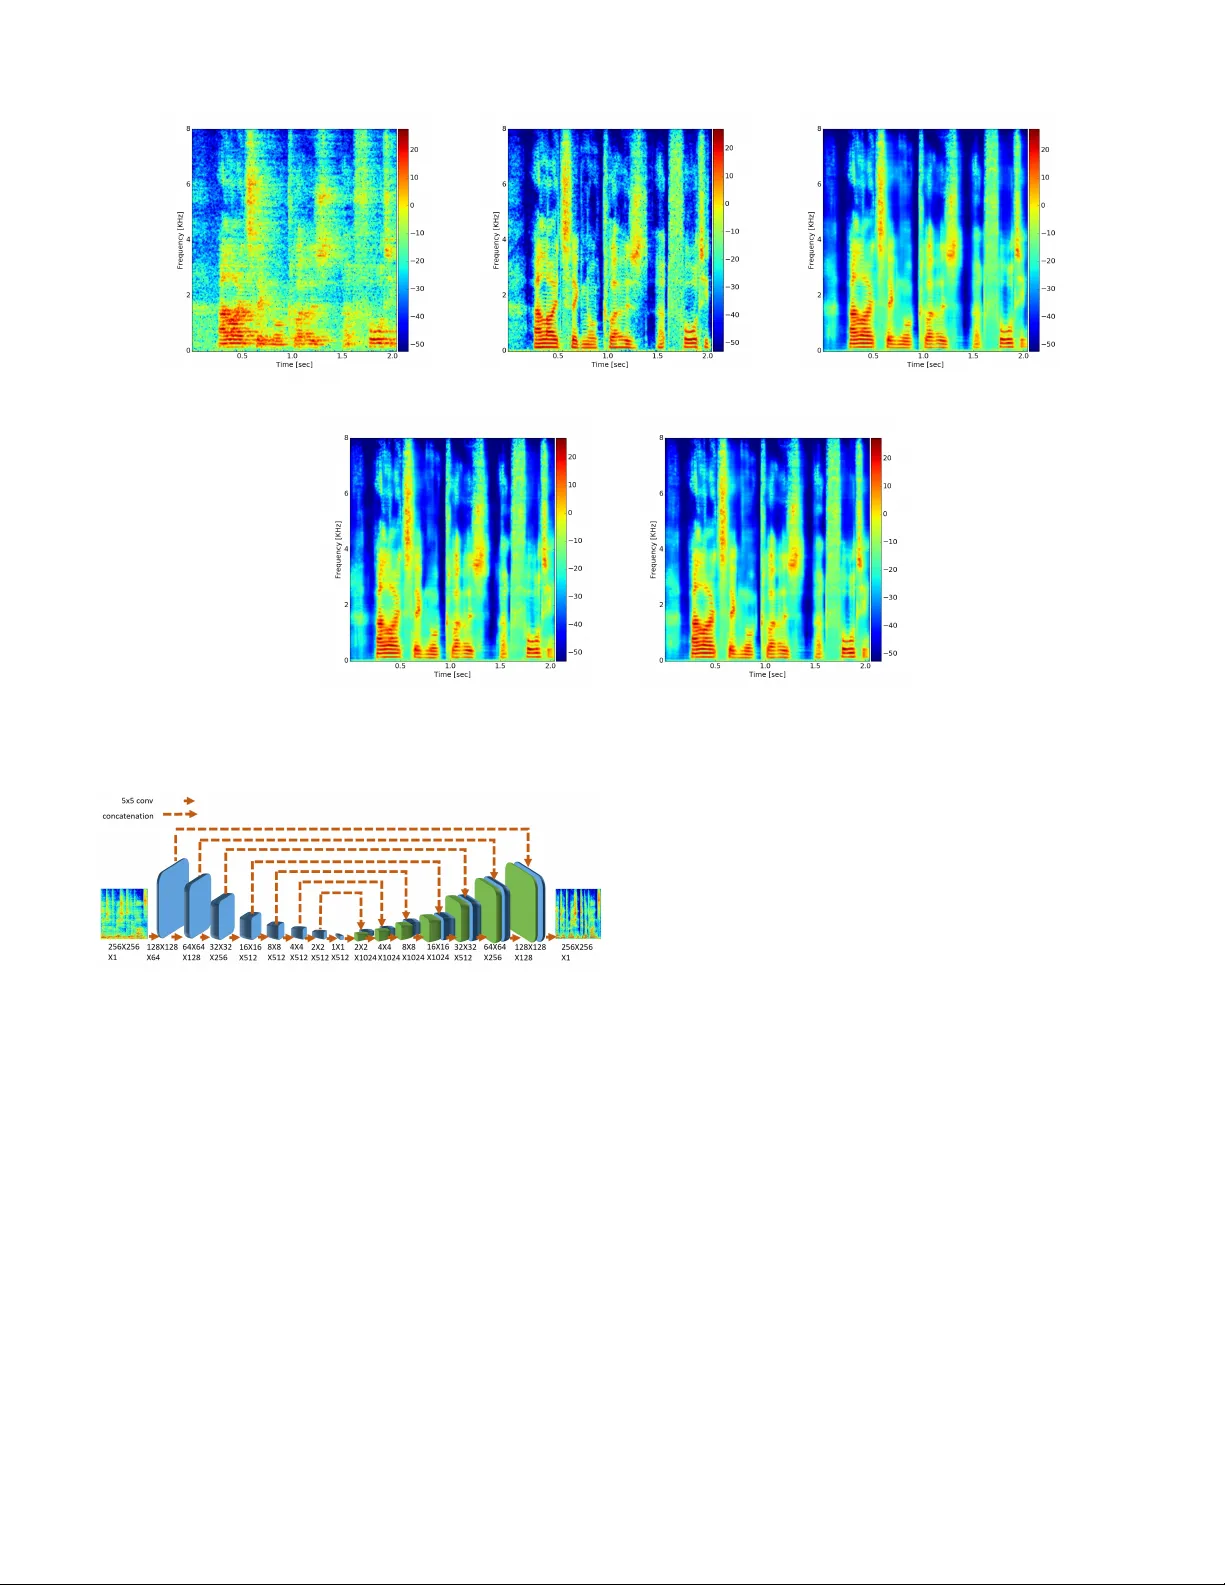
Speech Dere v erberation Using Fully Con v olutional Networks Ori Ernst, Shlomo E. Chazan, Sharon Gannot and Jacob Goldberger Faculty of Engineering Bar -Ilan Uni versity Ramat-Gan, 5290002, Israel. { Ori.Ernst, Shlomi.Chazan, Sharon.Gannot, Jacob .Goldberger } @biu.ac.il Abstract —Speech derverberation using a single microphone is addressed in this paper . Motivated by the recent success of the fully convolutional networks (FCN) in many image pr ocess- ing applications, we investigate their applicability to enhance the speech signal represented by short-time Fourier transform (STFT) images. W e present two v ariations: a “U-Net” which is an encoder -decoder network with skip connections and a generative adversarial network (GAN) with U-Net as generator , which yields a more intuitive cost function for training. T o ev aluate our method we used the data from the REVERB challenge, and compared our results to other methods under the same conditions. W e ha ve found that our method outperforms the competing methods in most cases. I . I N TR O D U C T I O N Rev erberation, resulting in from multiple reflections from the rooms facets and objects, de grade the speech quality , and in sev ere cases, the speech intelligibility , especially for hearing impaired people. The success rate of automatic speech recognition (ASR) systems may also significantly deteriorate in re verberant conditions, especially in cases of mismatch between the training and test phases. Rev erberation is the result of con volving an anechoic speech utterance by a long acoustic path. The output signal suffers from overlap- and self- masking effects that may deteriorate the speech quality [1]. These are often manifested as “blurring” ef fects on the short- time Fourier transform (STFT) images. A plethora of meth- ods for speech dereverberation using both single- and multi- microphone exists [2]. The REVERB challenge [3] was a large community-wide endeav or to put together a common dataset for testing dere- verberation algorithms and for ev aluating many algorithms on a common ground. The challenge addresses both ASR and speech enhancement using 1, 2 or 8 microphones. In this paper , we focus on single-microphone speech enhancement solutions. In STFT domain, rev erberation can be modeled as a per frequency con volution along frames. In [4], the signal is derev erberated by estimating the inv erse filter that minimizes the weighted linear prediction error (WPE). A different ap- proach directly estimates the reverberant filter , using recursiv e expectation-maximization algorithm (REM), that is then used to construct a Kalman filter . This method can be both applied in the single- and multi-microphone cases [5]. Other methods in the challenge used a conv olution in the amplitude of the STFT domain and then applied nonneg ativ e matrix factor deconv olution (NMFD) [6]. Spectral domain processing can be also utilized by using the statistical model of the rev erberant tail (see Polack’ s model [7]). A method that takes into account the direct-to- rev erberant ratio (DRR) was presented in [8]. A modified ver - sion of this approach, proposed by Cauchi et al. [9] prov ed to be very ef ficient in the single-microphone case. T wo additional methods used spectral enhancement procedure, using spectral analysis tools other than the STFT . Gonzalez et al. [10] used a zero-phase transformation, which can distinguish between a periodic and a non-periodic components of the speech signal. W isdom et al. [11] proposed a short-time fan-chirp transform (STFChT) that is coherent with speech signals ov er a longer analysis windo w . Deep learning methods were employed by Xiao et al. [12] to find a nonlinear mapping between the rev erberant and clean spectrum. Follo wing the successes of learning-based methods, Han et al. [13] applied a DNN to map noisy and reverberant spectrograms to clean spectrograms. Then, at a post-processing stage, an iterativ e phase reconstruction was employed to reconstruct the time-domain signal. W illiamson et al. [14] used deep learning techniques to directly estimate the complex ideal ratio mask (cIRM). W eninger et al. [15] used bi-directional long short-term memory (bi-LSTM) recurrent neural networks (RNNs) to preserv e the speech continuity . Despite the success of fully connected (FC) and LSTM networks, they do not fully utilize the spectral structure of the speech. In the speech spectrogram, there are clear time- frequency patterns that can be exploited. By dividing the spectrum into time frames, these patterns are not preserved. Another type of network is known as the conv olutional neural network (CNN), which is based on a sliding-window process in order to enhance the current time frame. In CNN, each pixel in the target image is computed using only a small number of context pixels from the original image, follo wed by a FC layer that ignores any existing time-frequency struc- ture [16]. In scenery images, CNN is usually used for classification tasks. F or se gmentation tasks, which necessitates an estimate the entire picture, a fully con volutional network (FCN) [17] is most commonly used. In this study , we apply FCN architecture to the speech dere- verberation task. W e show that this approach, which preserves global temporal and spectral information along with local information, significantly outperforms competing methods, as demonstrated on both real data and (most of) the simulated data in REVERB challenge. I I . P RO B L E M F O R M U L A T I O N Rev erberant speech can be modeled as z ( t ) = { x ∗ h } ( t ) (1) where x is the clean speech that is conv olved by h , the room impulse response (RIR) that creates the re verberation. In REVERB challenge, a lo w-lev el stationary noise is added to z ( t ) , b ut it is neglected in our deri vations. W e would like to retrieve x ( t ) from z ( t ) by a nonlinear function that is implemented by a neural network: x ( t ) ≈ f ( z ( t )) . (2) Follo wing [18] we use the log-spectrum as an effecti ve feature vector . Let Z ( n, k ) denote the log-absolute value of the STFT of z ( t ) in the n -th time-frame and the k -th frequency bin. Let L denote the frame-length of the transform, hence, due to symmetry , the indexes of the log-spectrum are k = 0 , ..., L/ 2 . Similarly , X ( n, k ) denote the log-spectrum of the clean speech. Fig. 1a and Fig. 1b depict an example of a rev erberant and a clean log-spectrogram, respectiv ely . Comparing the two figures, the reverberant spectrograms is much more “smeared” than the clean spectrogram, as a direct consequence of the con volution with the long RIR. I I I . A U - N E T B A S E D N E T W O R K A R C H I T E C T U R E S Follo wing the speech enhancement method in [19], the time-frequency (T -F) representation, the spectrogram, can be treated as an image. Consequentially , the enhancement task becomes an image-to-image transformation. T reating the re- verberant speech as an image has two major advantages. First, speech spectrograms exhibit typical patterns (e.g. pitch conti- nuity , harmonic structure, and formants). An image processing methodology can take adv antage of these structures to apply relev ant enhancement procedure. Second, this representation allows us to use highly successful image transformation meth- ods such as the fully con volutional network (FCN). In this section, we present three variants of the proposed algorithm, all based on a U-Net architecture, namely the U-Net image-2-image architecture with two filter shapes, and U-net on conjunction with generative adversarial network (GAN). A. U-Net Ima ge-2-Imag e Ar chitectur e In this study we propose an FCN as the basic architecture. In this network the image is downsampled and upsampled again, which causes a rapid increase in the receptiv e field that serves to propagate global information in both time and frequency axes. The recepti ve field of a neuron is the number of pixels from input image that are used for computing the neuron v alue. In FCN the image is downsampled until a bottleneck of 1 × 1 , causing each pixel in the target to be influenced by the entire input image. An encoder-decoder network is a very common method for image-to-image translation. In this type of network, each layer downsamples its input (usually with a stride of 2) to the next layer until there is a bottleneck. In the subsequent layer , the input goes through the rev erse process where each layer upsamples its input until it returns to the original shape. Thus, the network input is a high resolution image that is squeezed to a very low resolution image (a bottleneck). Con versely , the expanding path does the opposite, i.e., it increases the image resolution until it is resized to the original dimen- sions. Unfortunately , this network tends to loose essential low lev el information during the do wnsampling procedure. In order to improv e the encoder-decoder structure, the “U- Net” architecture [20], along with its symmetric squeezing and expanding paths (like a “U” shape), capitalizes on the fact that input and output images should have the same structure. W e can thus circumvent the bottleneck and also transmit the shared information without downsampling. Therefore, the U- net connects between mirrored layers in the encoder and decoder stacks that transmit the information without going through a bottleneck. In other words, the skip connections directly concatenate feature maps from layer i in the encoder to layer N − i in the decoder , where N is number of layers. Follo wing [19], our network details are as follows. Let CBL l,s denote a Con volution-BatchNorm-Leaky-ReLU layer with slope=0.2, where l is number of filters and s × s is the filter size. CL l,s and CBR l,s hav e the same architecture but without BatchNorm, or with a non-leaky ReLU, respectiv ely . W ith same notation, let DCDR l,s denote the DeCon volution- BatchNorm-Dropout-ReLU with dropout of 50%, and let DCR l,s denote the DeCon volution-BatchNorm-ReLU. DCT l,s denote DeCon volution-tanh. The U-Net squeezing path is giv en by: CL 64 , 5 → CBL 128 , 5 → CBL 256 , 5 → CBL 512 , 5 → CBL 512 , 5 → CBL 512 , 5 → CBL 512 , 5 → CBR 512 , 5 and the U-Net expanding path is: DCDR 512 , 5 → DCDR 512 , 5 → DCDR 512 , 5 → DCR 512 , 5 → DCR 256 , 5 → DCR 128 , 5 → DCR 64 , 5 → DCT 1 , 5 . The U-net architecture which combines direct and skip connections is illustrated in Fig. 2. The input is normalized to the range [-1,1] before processing. At the end of the network, tanh is applied in order to confine the output ˆ X ( n, k ) to the range [-1,1], same as the input. U-Net filters are usually symmetric ( 5 × 5 in our implemen- tation), but this is not necessarily the optimal choice. In re gular images, using symmetric filters makes sense because there is no difference between the x and y axes. Nev ertheless, our images are actually spectrograms, with one axis representing the time domain, and the other the frequency domain. T o mitigate the reverberation effects, it may be better to use higher-dimension in the frequency-domain than in the time- domain, to capture important spectral patterns of the speech. The pitch structure occupies several frequency bands, so a filter must be at least longer than the fundamental pitch frequency . Accordingly , we inv estigated the use of asymmetric filters of size 10 × 5 pixels, 10 for the frequency domain, and 5 for the time domain. In most cases, as we demonstrate in the (a) Noisy and Rev erberant log STFT (b) Clean log STFT (c) U-Net with asymmetric filters result (d) U-Net with symmetric filters result (e) U-Net + GAN result Fig. 1: One example of re verberant and clean log-spectrograms, and results applied by all methods. Fig. 2: U-Net for speech derev erberation architecture. experimental section, these filters exhibit better performance measures than the symmetric filters. Examples for the log- spectrograms of the enhanced speech by U-Net and asymmet- ric U-Net are shown in Fig. 1d and Fig. 1c, respecti vely . T o train the network we used a training dataset that con- sisted of T -F images of the clean speech X t ( n, k ) and the corresponding noisy and reverberant signal Z t ( n, k ) , to gen- erate the enhanced speech ˆ X t ( n, k ) , whereas t = 0 , ..., T − 1 represents the t -th example and T is the number of training data examples. Following [19] and [20], we trained the U-Net with the Adam optimizer for 10 epochs, with a batch size of a single image. The cost we minimize is the mean square error (MSE). The loss function we minimize at the training is thus: L MSE = X t k X t − ˆ X t k 2 (3) where t goes over all the images of the training data. Although in [21] the loss function used was L 1 norm, here L 2 was found to yield better results. B. GAN T r aining Strate gy Minimizing the MSE between the enhanced and the clean speech is not always aligned with the human judgment. For that reason, generati ve adversarial networks (GAN) [22] have been successfully applied to sev eral image processing tasks. The pix2pix conditional GAN (cGAN) [21] that presents a way to perform image translations (such as B&W to color images) using GAN, w as found specifically attracti ve. This method was used by [19] for a noisy speech enhancement task, b ut it has nev er been applied to a re verberation task. Our cGAN was composed of two components: a gener ator (G) that enhances the spectrogram (the network described in Sec. III-A), and a discriminator (D) that was trained to distinguish between the result of G and a clean spectrogram. The discriminator receiv es two images. The first is the output of G or a clean image, and the second is the noisy spectrogram used as a condition. During training, the goal of G was to improve itself, such that D would not be able to distinguish between the output of G and the clean spectrogram. The objectiv e is the same as in [19] and [21]: L GAN ( G, D ) = X t (log D ( Z t , X t ) + log (1 − D ( Z t , G ( Z t ))) (4) T ABLE I: Results of simulated data for far microphones. CD LLR FWSegSNR SRMR Room 1 2 3 1 2 3 1 2 3 1 2 3 rev erberant speech 2.67 5.21 4.96 0.38 0.75 0.84 6.68 1.04 0.24 4.58 2.97 2.73 Cauchi et al. [9] 2.67 4.65 4.44 0.42 0.77 0.82 8.93 3.50 2.75 4.75 3.88 3.86 Gonzalez et al. [10] 3.59 5.03 5.15 0.31 0.54 0.65 5.72 2.74 1.64 5.98 4.20 3.86 W isdom et al. [11] 2.83 4.53 4.49 0.37 0.79 0.79 8.86 5.01 3.75 5.30 3.93 3.63 Xiao et al. [12] 1.92 3.17 2.99 0.41 0.61 0.58 9.12 6.31 5.97 5.67 5.80 5.03 U-Net 2.06 3.41 3.05 0.26 0.63 0.58 11.80 8.60 8.65 4.98 5.44 4.79 asymmetric U-Net 2.09 3.24 2.96 0.26 0.57 0.55 11.96 8.90 9.02 4.83 5.32 4.65 asymmetric U-Net + GAN 2.05 3.19 2.92 0.26 0.57 0.56 12.08 9.00 9.05 4.76 5.27 4.71 T ABLE II: Results of simulated data for near microphones. CD LLR FWSegSNR SRMR Room 1 2 3 1 2 3 1 2 3 1 2 3 rev erberant speech 1.99 4.63 4.38 0.35 0.49 0.65 8.12 3.35 2.27 4.50 3.74 3.57 Cauchi et al. [9] 2.02 3.82 3.67 0.36 0.51 0.64 10.29 6.19 4.89 4.65 4.32 4.27 Gonzalez et al. [10] 3.24 4.53 4.76 0.26 0.34 0.50 7.13 5.13 3.96 6.05 5.45 5.01 W isdom et al. [11] 2.29 3.64 3.65 0.31 0.54 0.60 10.07 8.24 6.51 5.18 4.70 4.56 Xiao et al. [12] 1.58 2.65 2.68 0.37 0.50 0.52 9.79 7.27 6.83 5.74 6.49 5.86 U-Net 1.73 2.71 2.61 0.19 0.44 0.45 13.33 10.71 10.18 4.73 5.35 5.05 asymmetric U-Net 1.79 2.63 2.54 0.20 0.42 0.45 13.32 10.83 10.45 4.48 5.07 4.90 asymmetric U-Net + GAN 1.75 2.58 2.53 0.20 0.41 0.45 13.32 10.87 10.40 4.51 5.09 4.94 T ABLE III: SRMR Results of real data for far and near microphones. method far near rev erberant speech 3.19 3.17 Cauchi et al. [9] 4.76 4.87 Gonzalez et al. [10] 4.62 4.78 W isdom et al. [11] 4.82 4.96 Xiao et al. [12] 4.42 4.29 U-Net 5.54 5.45 asymmetric U-Net 5.68 5.47 asymmetric U-Net + GAN 5.52 5.34 such that Z t , X t and ˆ X t = G ( Z t ) are the t -th example of the re verberant, clean and enhanced log-spectrum images respectiv ely . T o improv e the results, the MSE loss was added to the GAN loss as a regularization term that ensures that the enhanced speech is close to the clean speech. Accordingly , the final GAN score was e xpressed as L ( G, D ) = L GAN ( G, D ) + λL MSE ( G ) (5) where λ is the weight of the direct MSE loss. The GAN network was initialized with the U-Net weights, and then was trained for a couple of more epochs. W e hav e found empirically the λ = 1000 yields good results. An example of GAN based derev erberation is depicted in Fig. 1e. Both U- Net and GAN architectures are based on [19] implementation. I V . E X P E R I M E N TA L R E S U LT S W e implemented the three methods described above: U-Net, asymmetric U-Net, and GAN initialized with asymmetric U- Net. W e calculated all measurements on the test dataset by the REVERB challenge published script, so the comparison to other methods would be fair . A. Dataset Our data were based on the REVERB challenge [3]. The data were divided into a training set and an ev aluation test set, such that the former only included simulated data, whereas the latter also included real recordings. The simulated data were taken from the WSJCAM0 corpus [23], in which each utterance was con volv ed randomly with room impulse re- sponses (RIRs) from dif ferent rooms and a noise was added at an SNR of 20dB. The simulated test dataset was generated from three different room sizes (small, medium and large) with a reverberation time ( T 60 ) of approximately 0.25s, 0.5s and 0.7s, respectiv ely , and from two microphone placements relativ e to the speaker (200cm and 50cm). The real recordings were taken from the MC-WSJ-A V corpus [24], which contains recordings from a noisy and reverberant meeting room, with T 60 of approximately 0.7s, and microphone distance of 250cm and 100cm from the speaker . The training data were generated from 24 “rooms” that were simulated from suitable RIRs with rev erberation times changed from 0.2s to 0.8s. The rooms and conditions were different for the e v aluation set and the training set. B. Pr e-Pr ocessing The input to the network was the log-spectral image of the noisy and re verberant speech. STFT w as computed using frame length of 512, with a Hamming window size of 32ms and an overlap of 0.75%. The signal w as sampled at 16kHz. Only the STFT magnitude was considered and for the recon- struction of the time-domain signal we used the noisy phase. Only 256 frequency bins were taken into account owing to symmetry , and ignoring the high frequency bin in order to use an exact power of two that allows a simpler network. The data were divided into groups of 256 time bins each, so each group formed a 256 × 256 image. C. Results W e compared our approach to the methods that competed in the REVERB challenge in the category “single channel utterance based”. In this category , enhancement is required to be solely dependent on the specific utterance (and the training data), without using the other utterances with same conditions (e.g. same room). Each utterance was thus separately enhanced. The results of the simulated test data for far and near microphones are described in T able I and T able II, respecti vely . It is evident that for the far microphone (where rev erberation conditions are harsher), U-Net with asymmetric filters exhibits better LLR and FWSe gSNR objectiv e measures than the other methods. Even for the CD objective measure, this method was the best in room 3. The best performance improv ement was achiev ed for the FWSegSNR objectiv e measure, regardless of the room type. For the near microphone, the regular U-Net and asymmetric U-net outperformed the other methods in most of the rooms for the CD, LLR and FWSegSNR objectiv e measure, whereas the differences between the regular and asymmetric U-Net were negligible. In addition, for the CD objecti ve, the differences between the best result and U-Net were very small, for both the far and near microphones. Howe ver , in terms of SRMR our method performed less well. In spite of the failure on the SRMR in the simulated data, the results for real recordings confirmed the success of the asymmetric U-Net method as compared to the others (T able III). The GAN had increased its FWSegSNR score, along with its CD in room 3, with almost no injure in other measurements. A subjectiv e ev aluation campaign was not carried out. The interested reader may check a few examples in our website: www.eng.biu.ac.il/gannot/speech- enhancement/speech-dereverberation-using- fully-convolutional-networks/ . V . C O N C L U S I O N In this study we presented a deep learning approach for enhancing noisy and rev erberant speech based on image-to- image processing of the log-spectrogram of the reverberant speech signal. W orking directly on the image representation enabled us to explicitly model typical time-frequency patterns. W e obtained significant improvements on both real and simu- lated data compared to pre viously suggested approaches. V I . A C K N O W L E D G M E N T The authors would like to thank Daniel Michelsanti and Zheng-Hua T an for sharing their GAN code. R E F E R E N C E S [1] A. K. N ´ ab ˇ elek, T . R. Letowski, and F . M. T ucker , “Reverberant overlap- and self-masking in consonant identification, ” The Journal of the Acous- tical Society of America , vol. 86, no. 4, pp. 1259–1265, 1989. [2] P . A. Naylor and N. D. Gaubitch, Speech der everber ation . Springer Science & Business Media, 2010. [3] K. Kinoshita, M. Delcroix, S. Gannot, E. Habets, R. Haeb-Umbach, W . Kellermann, V . Leutnant, R. Maas, T . Nakatani, B. Raj, A. Sehr, and T . Y oshioka, “ A summary of the rev erb challenge: State-of-the-art and remaining challenges in re verberant speech processing research, ” EURASIP Journal on Advances in Signal Pr ocessing , vol. 7, pp. 1–19, Oct. 2016. [4] M. Delcroix, T . Y oshioka, A. Ogawa, Y . K ubo, M. Fujimoto, N. Ito, K. Kinoshita, M. Espi, T . Hori, T . Nakatani, and A. Nakamura, “Linear prediction-based dereverberation with advanced speech enhancement and recognition technologies for the re verb challenge, ” in Pr oc. REVERB Challenge W orkshop , v ol. 1, 2014, pp. 1–8. [5] B. Schwartz, S. Gannot, and E. A. P . Habets, “Online speech dereverber- ation using Kalman filter and EM algorithm, ” IEEE/ACM T ransactions on Audio, Speech, and Language Processing , vol. 23, no. 2, pp. 394– 406, Feb . 2015. [6] H. Kallasjoki, J. F . Gemmeke, K. Palomaki, A. V . Beeston, G. J. Brown, and K. J. Palom ¨ aki, “Recognition of rev erberant speech by missing data imputation and NMF feature enhancement, ” in Pr oc. REVERB Challenge W orkshop , 2014. [7] J.-D. Polack, “Playing billiards in the concert hall: The mathematical foundations of geometrical room acoustics, ” Applied Acoustics , vol. 38, no. 2-4, pp. 235–244, 1993. [8] E. Habets, S. Gannot, and I. Cohen, “Late re verberant spectral v ariance estimation based on a statistical model, ” IEEE Signal Pr ocessing Letters , vol. 16, no. 9, pp. 770–773, Sep. 2009. [9] B. Cauchi, I. K odrasi, R. Rehr , S. Gerlach, A. Jukic, T . Gerkmann, S. Doclo, and S. Goetze, “Joint derev erberation and noise reduction using beamforming and a single-channel speech enhancement scheme, ” in Pr oc. REVERB Challenge W orkshop , 2014. [10] D. R. Gonz ´ alez, S. C. Arias, and J. R. Calvo, “Single channel speech enhancement based on zero phase transformation in rev erberated en vi- ronments, ” in Proc. REVERB Challenge W orkshop , 2014. [11] S. W isdom, T . Po wers, L. Atlas, and J. Pitton, “Enhancement and recognition of reverberant and noisy speech by extending its coherence, ” in Pr oc. REVERB Challenge W orkshop , 2014. [12] X. Xiao, S. Zhao, D. Hoang, H. Nguyen, X. Zhong, D. L. Jones, E. S. Chng, and H. Li, “The NTU-ADSC systems for reverberation challenge 2014, ” in Proc. REVERB Challenge W orkshop , 2014. [13] K. Han, Y . W ang, D. W ang, W . S. W oods, I. Merks, and T . Zhang, “Learning spectral mapping for speech derev erberation and denoising, ” IEEE/ACM T ransactions on Audio, Speech, and Language Pr ocessing , vol. 23, no. 6, pp. 982–992, Jun. 2015. [14] D. S. W illiamson and D. W ang, “T ime-frequency masking in the complex domain for speech derev erberation and denoising, ” IEEE/A CM T ransactions on Audio, Speech, and Language Processing , v ol. 25, no. 7, pp. 1492–1501, Jul. 2017. [15] F . W eninger, S. W atanabe, Y . T achioka, and B. Schuller, “Deep recurrent de-noising auto-encoder and blind de-reverberation for reverberated speech recognition, ” in IEEE International Confer ence on Acoustics, Speech and Signal Pr ocessing (ICASSP) , May 2014, pp. 4623–4627. [16] D. S. W ang, Y . X. Zou, and W . Shi, “ A deep conv olutional encoder- decoder model for robust speech dere verberation, ” 22nd International Confer ence on Digital Signal Processing (DSP) , pp. 1–5, 2017. [17] E. Shelhamer, J. Long, and T . Darrell, “Fully conv olutional networks for semantic segmentation, ” IEEE T ransactions on P attern Analysis and Machine Intelligence , v ol. 39, no. 4, pp. 640–651, April 2017. [18] Y . W ang, A. Narayanan, and D. W ang, “On training targets for super- vised speech separation, ” IEEE/ACM T ransactions on Audio, Speech, and Language Pr ocessing , vol. 22, no. 12, pp. 1849–1858, Dec. 2014. [19] D. Michelsanti and Z.-H. T an, “Conditional generative adversarial net- works for speech enhancement and noise-rob ust speaker verification, ” in INTERSPEECH , 2017. [20] O. Ronneberger , P . Fischer , and T . Brox, “U-net: Conv olutional networks for biomedical image segmentation, ” in Medical Image Computing and Computer-Assisted Intervention (MICCAI) , 2015, pp. 234–241. [21] P . Isola, J.-Y . Zhu, T . Zhou, and A. A. Efros, “Image-to-image translation with conditional adversarial networks, ” IEEE Confer ence on Computer V ision and P attern Recognition (CVPR) , pp. 5967–5976, 2017. [22] I. Goodfello w , J. Pouget-Abadie, M. Mirza, B. Xu, D. W arde-Farle y , S. Ozair , A. Courville, and Y . Bengio, “Generati ve adversarial nets, ” in Advances in Neural Information Processing Systems (NIPS) , 2014, pp. 2672–2680. [23] T . Robinson, J. Fransen, D. Pye, J. Foote, and S. Renals, “WSJCAMO: a british english speech corpus for large vocab ulary continuous speech recognition, ” in International Conference on Acoustics, Speech, and Signal Pr ocessing (ICASSP) , May 1995, pp. 81–84. [24] M. Lincoln, I. McCow an, J. V epa, and H. K. Maganti, “The multi- channel wall street journal audio visual corpus (MC-WSJ-A V): specifi- cation and initial experiments, ” in IEEE W orkshop on Automatic Speech Recognition and Understanding. , Nov . 2005, pp. 357–362.
Original Paper
Loading high-quality paper...
Comments & Academic Discussion
Loading comments...
Leave a Comment