Saliency Prediction for Omnidirectional Images Considering Optimization on Sphere Domain
There are several formats to describe the omnidirectional images. Among them, equirectangular projection (ERP), represented as 2D image, is the most widely used format. There exist many outstanding methods capable of well predicting the saliency maps…
Authors: Bhishma Dedhia, Jui-Chiu Chiang, Yi-Fan Char
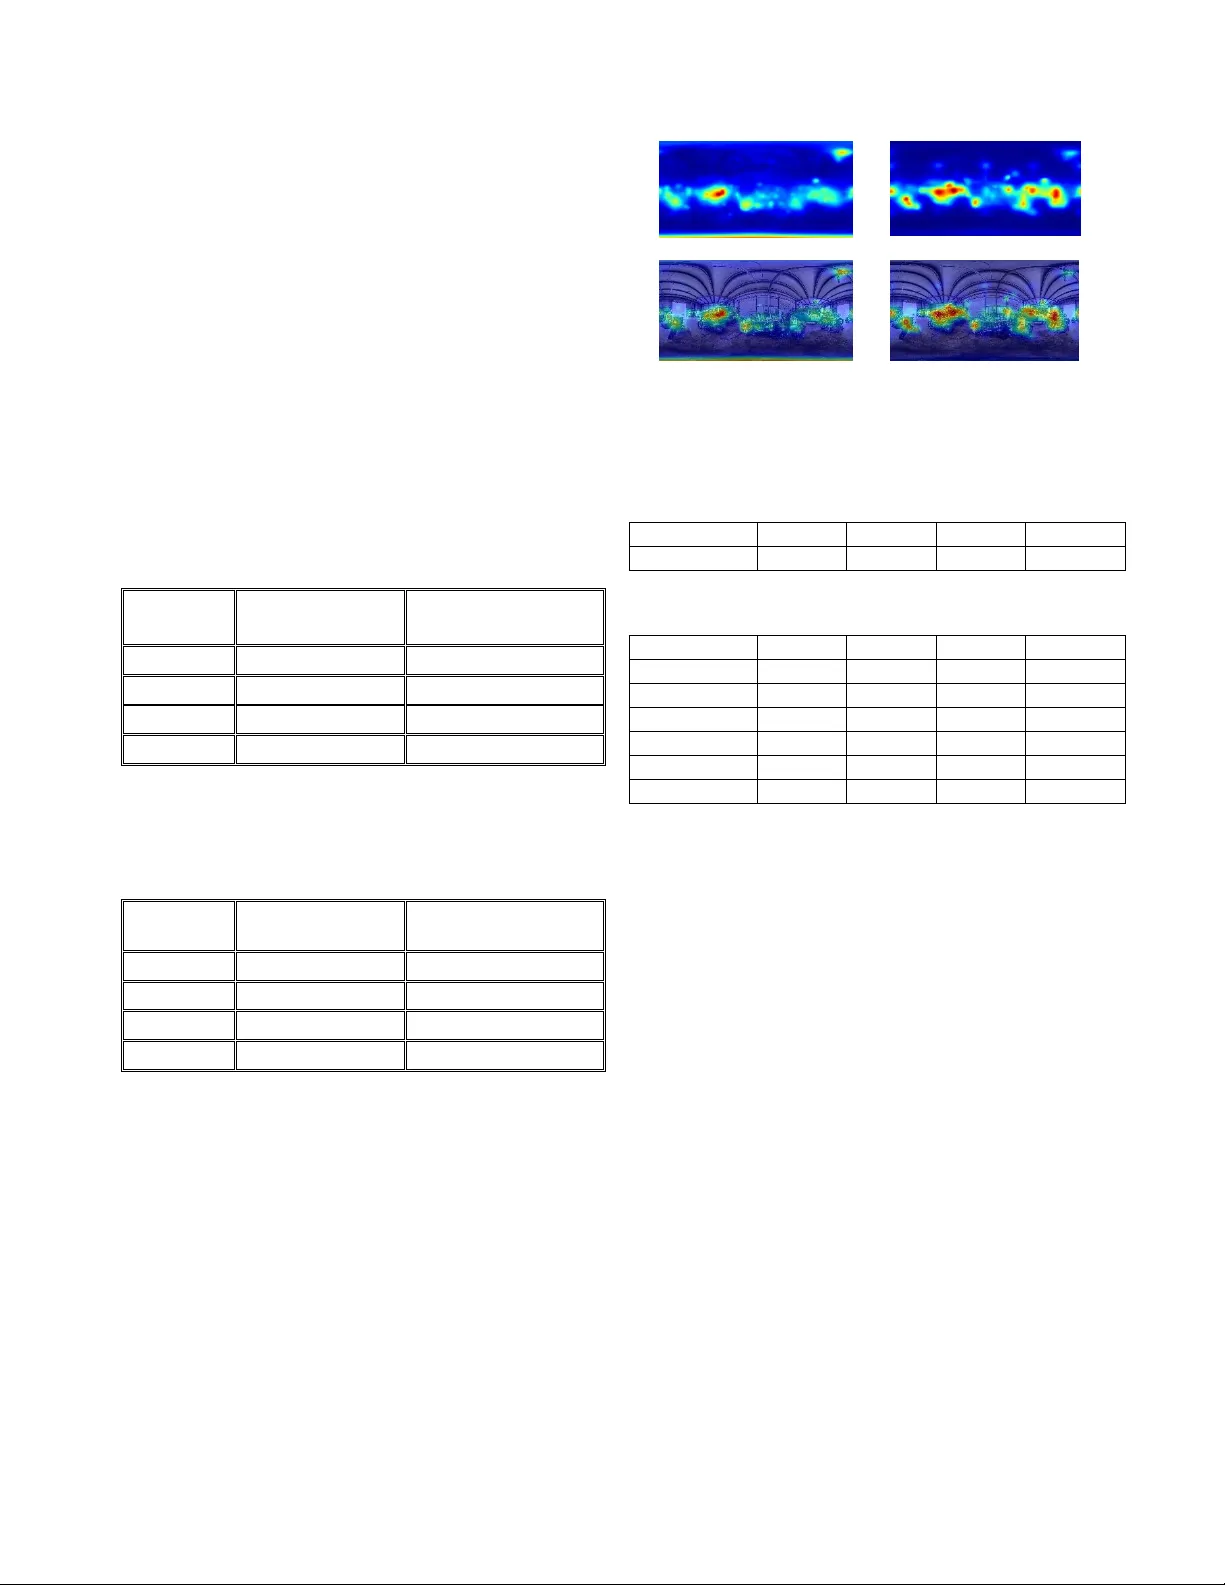
SALIENCY PREDICTION FOR OMNIDIRECTION AL IMAGES CONSIDERING OPTIMIZATION ON SPHERE DOMAIN Bh is hma Dedhia 1 , Jui-Chiu Chiang 2 and Yi-Fan Char 2 1 Departm ent of Electrical E ngineering , Indian Institute of Technolog y, Bom bay, India 2 Department of Elec trical Eng ineering, Natio nal Chung C heng University , Taiwan ABSTRACT There are several for mats to describe the omnidirectional images. Among them, equirectangular projection (ERP), represented as 2D im age, is the m ost widely used form at . There exist many outstanding methods capable of well predicting the saliency maps for the conventional 2D images. But these works ca nnot be directl y extended to predi ct the saliency map of the ERP i mage, since the content on ERP is not for direct display. Instead, the viewport image on demand is ge nerated after convertin g the ERP image to the sphere domain, followed by r ectilinear projection. In this paper, we propose a model to pred ict the saliency maps of the ERP images using existi ng saliency predicto rs for the 2D image . Some pre-processing and post-processing are used to manage the problem m entioned above. In particular, a sm oothing based optimization is realized on the sphere do main. A public dataset of o mnidirectional images is used to perform all t he experiments and co mpetitive results ar e achieved. Index Terms — Omnidirectio nal image , ER P , saliency map, sphere 1. INTRODUCTION In recent years, o mnidirectional i mages (OMIs) have gained popularity owing to t he increased demand of free-view navigation, particularly for the virtual reality (V R) applications. User can produce OMIs with se veral kinds of electronic devices a nd view O MIs on a h ea d-mounted d ispla y (HMD). Visual exploratio n o f OMIs is drastically d ifferent from t hat of the conventio nal i mages. Particularly, a mu c h higher d egrees of freedo m of viewpoint is o ffered by OMIS . Consequently, it leads to enhanced interactio n betw een the viewer and the scene, and an immersive entertain ment is achieved accordin gly. Usually, the viewer will be interested in speci fied parts of the omnidirectional scene and it will bring benefit if the visual attention can be predicted. Being ab le to ge nerate an accurate attention model is crucial in several co mputer vision relate d applications, suc h as ac tion re cognition [1], ob ject tracking, and ef ficient co mpression specified for virt ual an d augmented rea lity [2, 3] . For exa mple, in vi deo strea ming, i t is esse ntial to guarantee a r eal-time transmission under limited band width. Since the data amount of OMI is qu ite huge , it will be wasteful to allocate the sa me resource for eac h part of OMIs. If the viewport image demanded by the viewer can be predicted, it is p ossible to assign more bits to the predicted region and less bits for the re maining parts durin g the encod ing of t he OMIs. W ith t he guida nce of t he salienc y map, it is feasible to make t he deliver y o f viewport - on - demand more effic ient. Many remarkable works a bout salie ncy prediction of the conventional 2D i mage ca n b e found in the literat ure [4 -7]. Although the ERP image is repr esented as 2D image, these saliency predictors cannot perform well on it if no modification is realized. The ERP image s uffers from the geometric distortion, w hich is prop ositional to the latitude. This issue should be ad dressed during the development of saliency prediction for the E RP image. Since the ERP is one kind of projections of the OMIs, o ne solution to reso lve the pro blem of geometric distortion is t o represent the po lar region in another for mat, such as cube map face, which is generated by cube map projection ( CMP) [8-13]. Then, the saliency predictor for the conventional 2D image can be us ed to derive the visu a l attention of these cube faces, follo wed b y re -projec tion to the ERP image. In [8], GVBS360 and BMS360 ar e proposed, w hich extend saliency models, namely Grap h-based Visual Saliency ( GVBS) [4] and Boolean Map Saliency (BMS) [5], designed for 2D image to the ERP image. Mu lti-plane proj ection is realized in [ 9] to simulate the viewing behavior of human eyes i n HMDs. Then b oth the bottom-up and the top -down feature extractions are performed on each plane. The work in [ 10 ] uses f ine -tuned SalGAN [6 ] fo r t wo i mage sources, including the original ERP and the cube faces images under severa l orientations. Then a fusion process is realized to generate the final salie ncy map in the ERP for mat. E RP images centered on t wo different longitude along the equator and cube map faces generated by rotating the cube center to several an gle s are used in [1 1] to generate the saliency map. In [13], the ERP image is split into patches a nd the sparse feat ure is extracted and an integrated salienc y map is pr oduced after taking the visual acuity and latitude bias into consideration. Inspired by the work in [11], we us e the ERP and the CMP image as the input and realize the saliency prediction individually. Since the spatial change of the visual attentio n i s usually progressive, we realize an o ptimization on the saliency map to ensure a spatially edge-preser ving smoothing. In addition, ei ght ERP i mages, instead of 2, by rotati ng in t he Y axis are generated to b etter man a ge the bo rder artifact. Th e proposed approach d emonstrates impressive r esults on t he dataset of omnidirectional i mages. 2. METHODOLOGY Omnidirectional images present the sce ne in a wider range, compared to the co nventional i mage. However, not all o f the areas of the omnidirectio nal i mage received intensive attention. Certain feat ures of the image or the position on the sphere domain can be exploited to generate an accurate saliency map without the need for any training. 2.1 Architecture of the pro posed model In addition to the ERP, the cub e map pr ojectio n (CMP) which uses six square faces to present t he surface o f t he sphere is also a p opular format of O MIs . In the CMP, eac h fac e presents a 2D i mage for a part icular viewport with a field of view (FOV) 90 o and the conventional 2D saliency pr edictors can be ap plied to it with ease. Si milar to the work [1 1], the proposed saliency map prediction co mputes both the saliency map f o r the E RP image a nd the CMP im a ge s and so me modifications are prop osed to improve the performance. Fig . 1 shows the o verall arc hitecture of the proposed salienc y prediction model, which can b e describ ed by four main steps as follows: (a) ERP -based saliency prediction (b) CMP-based salienc y prediction (c) Introducing the eq uator bias (d) Optimization on sphere domain Fig. 1. Architecture of the proposed model The saliency map for th e OMI is parallelly predicted using steps (a) and (b). Saliency prediction for ea ch cube face is yield ed by B MS [5] while the saliency pred iction for the ERP image employs S AM-Resnet [7]. T hen t wo saliency model s are integrated into one salienc y map . Since many subjective experiments report that the conten t near the equator receive s much higher attentio n, the equator b ias map is introduced t o mimic the viewers’ behavior. Hence, a n equator b ias map is weighed into the co mbined saliency map. T hen the map is smoothened on the sphere domain using an optimization based for mulation. In t he follo wing, each step is introd uced with details. 2.2 ERP-ba sed Saliency Prediction To preserve the saliency in the global context, more than one ERP images are used by changing the longitude of the image cent er alo ng the eq uator. Different from [11 ], which considers 2 orientatio ns , we have 8 orientation s along the equator with a samplin g rate of 4 5 degrees i n the longitude. As mentio ned before , the regio n near the equator in the ERP image preserves good geometry, while other region s s uffer from the geometrical di stortion, which is prop ortional to the latitude. It i mplies the conventional saliency p redictors probably yield accurate atte ntion models o nly in t he middle portion. Thus, the idea in this approach is to predict the saliency of the middle portion and the edges f o r each ERP image separatel y. The edge portion is the regio n corresponds to the top and bottom f ac es of CMP, while t he m idd le portion denotes the remaining region of the ERP , as illustrated in Fi g. 2. Then, the edge portion will b e represented b y t wo face images. Fig. 2. ERP image is split into two edges and one middle portion Fig. 3. Procedures of ERP-based saliency prediction Saliency map for the middle portion and the two edge portions are generated d irectly by SAM- ResNet [7], which achieves g o od performance for th e conventional i mage, as reported by the MIT30 0 benchmark [14 ,15]. Since the saliency maps of the cube faces under d ifferent orientation with fixed latitu d e can be seen as one map under varying rotations, there is no need to p erform the saliency pred iction for each orientation. Instead, only the salienc y map s of the top and bo ttom faces of for the original orientation are predicted. For the middle portion , s alienc y map is generated for each orientation and these maps are fused into one map by taking t he maxi mum value among them. T hen the salie ncy Saliency Map Equator Bias Combination CMP-based Saliency Pr edic tion ERP-based Salien cy Prediction Optimization Saliency Map Obtain the edge parts Obtain the middle part Scaling Convert to cube faces SAM-ResN et SAM-ResN et Integr ate of the middle po rtion and the edge por tions w ill b e asse mbled by projecting the to p and b ottom faces of th e CMP to the ERP format. Ho wever, before the i ntegration, the salienc y map of the edge portion is scaled appropriately so that the maximum values i n the middle po rtion and the ed ges are sa me. T hese procedures are illustrated in Fig. 3. 2.3 CM P-based Saliency Prediction ERP images suffer from proj ection distor tions, especial ly in the pol ar ar ea. The six faces of CMP d oes not have this problem a nd conventio nal saliency predicto rs can be used . This has also been explo red in [ 10 , 11 ]. BMS [5] is used to pred ict the saliency for each face. I t is among the top scoring salie ncy prediction models in the MIT300 Benchmark [1 4 ,1 5]. T he saliency map for each face will be stitched and re -projected back into t he E RP for mat. However, this straightfor ward m et hod leads to artifacts i n t he assembled saliency image. First, the CMP image is produced by rec tilinear proj ection and the surface of the sphere is not uniformly proj ected to the cube face. It means that the boundary o f each face will have larger distortio n, co mpared to the center o f the face. Besides, the discontinuity across the boundary of connected face s results in border effect. To address these issues a nd maintain the global context of th e scene at the same time, we rotate the sphere with differen t orientation by changing the ro tation angle of three axes. Five directions have b een considered in total, by setting the rotating angles for axes (X, Y, Z) as (0 o , 0 o , 0 o ), (45 o , 0 o , 0 o ), (0 o , 45 o , 0 o ), (0 o , 0 o , 4 5 o ) and (45 o , 45 o , 0 o ). T his procedure has also been al so u sed in [ 11 ]. For each orientation, t he saliency maps o f the cube faces ar e re -projected to the E RP at the original orie ntation. T he n a saliency map in the ERP format is obtained by ta king t he mean value of the salienc y maps produced for all the orientation s. 2.3 Combining the Saliency M aps After o btaining the saliency for the ERP and the CMP , w e will assemble t hem into a refi ned saliency map. B efore combining them by averaging, the maps are scaled so that their maximum values are the sa me. 2.4 Intro ducing the Equator B ias Since the re gions near the equator are statisticall y attractive regions during the VR navigation, it is imperative to introduce the equator bias during t he saliency pr ediction of the OMIs. The dataset [1 6] allo ws us to extract a global latitude-wise subjective atte ntion map and the result is independent of the im a ge characteristics. T his latitude driven characterization will b e considered to refine th e salienc y m ap generated in the previous processes. The equator -bias guided saliency at latitude i is computed by (1): (1 ) where denotes the subjective salie ncy value of the image p at location and n and m denote th e i mage nu mbers and the w id th of th e im a ge, respectively. Then a weighted average o f the equator bias map, denoted as and the saliency map, denoted as , generated f rom the previous steps, i s fused. T his procedure is illustrated i n (2). (2) where is empirically selected as 0.7 considering the contribution o f the scene dependent charac teristics and the equator bias. 2.5 Opti mization on Sphere D omain The last step i nvolves smoothening the saliency map to remove the noise while m aintaining the edge. An optimization-based appr oach is used to perform the tas k. The objective cost function i s expressed in (3) . (3) where is the smooth en ed salienc y map. p and q denote some spec ified pixels on , respectively . is the set of four nearest neighbors of a pixel p . is a manipulat ed version o f through a masking oper ation. It means that the value of some pixels of is retained o n , while t he remaining is set to 0. The mask is generated by co nsidering the uniform sampling o n the sphere sur face and a spiral-based method [ 17] is adop ted . I n , onl y the p ixel, which corresponds to a uniformly sampled p oint on the s p here is preserved. The rea son behind is that neighboring pixels in ERP format do not have fixed distance in t he sphere domain and not all the pixels i n the ERP do main have equal importance. Similar to the metric o f S -PSNR [18], which computes the P SNR on select ed p ixels, which are unifor m ly distributed on a sphere surface, we select the unifor mly sampled pixels on the sphere and projec t them back to the ERP image to form the mask. T hese pixels are served as seeds and the smoothing is realized T he number of points sampled on the sphere surface was directl y propo rtional to the size of the ERP image, and t he sampling number per steradian , denotes as , is defined in (4), (4 ) where H and W d enote the height a nd width of the inp ut ERP image, respectively . K is a par ameter and it determines the density o f t he sa mples. We vary the parameter K as 10, 10 0 and 10 00. T able 1 summarizes the scores of the test image P33 [ 19 ] for various values o f K . It indicates t hat a re markable improvement is achieved after perfor ming t he optimization on the sp here domain, in particular for the Normalized Saliency Scanpath (NS S) metric [20]. Table 1. Performance for various parameters K for test image P 33 without optimization K=10 K=100 K=1000 KLD 0.46 0.40 0.39 0.39 CC 0.67 0.71 0.70 0.70 NSS 0.53 0.96 0.96 0.96 AUC 0.58 0.69 0.69 0.69 3. EXPERIMENTA L RESULTS The p roposed scheme is fir st evalua ted over t he database for the o mnidirectional images [1 9], which includes the original images and both the head m ove ment and head-eye movemen t after co nducting the subj ective experiments. T hen the head saliency and head-eye saliency are provided and served as ground truth. The head -eye m o veme nt is co nsidered in this work. In the begin ning, we present the res ults o f the CMP- base d saliency model. Four popular objective metric s in t he saliency com munity are use d, including K ullback -Leibler Divergence (KLD), Pearson’s Correlation Coe fficient (CC), Normalized Saliency Scanpath ( NSS) and AUC-Judd [20]. The toolbo x [21] is used to c ompute the se scores. T able 2 reports the per formance of the CMP -based saliency prediction for the test image P33. A significant improvement in ter ms of KLD is achie ved whe n d ifferent orienta tions ar e employed. Table 2 . Score for CMP-based saliency p rediction CMP (one orientation) CMP (five orientations) KLD 3.50 0.56 CC 0.42 0.51 NSS 0.58 0.58 AUC 0.59 0.62 Table 3 sho ws t he results when t he saliency maps o f t he ERP-based and the CMP-based ar e combined. Not surp rising, a better per formance is achieved in this way. Table 3 . Score for the combined saliency map ERP-based saliency map Combined with CMP- based saliency map KLD 0. 55 0. 39 CC 0.56 0.69 NSS 0. 51 0.65 AUC 0.66 0.62 Fig. 4 presents the saliency map of t he test im a ge P33 when the o ptimization i s perfor med. It sho ws that t he optimization on the sphere d omain indeed improve s the saliency map . In particular, some regions on the r ight side of the image have a lar ger salien cy value after performing t he optimization, which is co nsistent with the subjec tive beha vior. Table 4 sho ws the result of the proposed w ork for the dataset [ 19 ], while Table 5 su mmarizes the per formance for the dataset [ 22 ], wh ich i s the verifica tion datase t for ICME 2017 Grand Challenge Salient36 0! Several works are compared in t his table. It sho ws that all the model ha s a similar AUC score. T he pr oposed technique outperfor ms the other schemes in NSS score and it achieves a comparable performance in ter ms of KLD and CC metrics . Fig. 4. Saliency map o f the test image P33 [ 19 ]. (a) Without optimization (b) With optimization, K =10 (c) input image o verlaid with (a), (d) input image ove rlaid with (b) Table 4 . Results for the head-eye movement prediction with dataset [ 19 ] Method KLD CC NSS AUC Proposed 0.515 0.545 1.002 0.7 19 Table 5. Results for the head-eye movement prediction with dataset [ 22 ] Method KLD CC NSS AUC GVBS360[8] 0.698 0.527 0.851 0.714 [9] 0.481 0.532 0.918 0.734 [10] 0.431 0.659 0.971 0.746 [11] 0.42 0.61 0.81 0.72 [13] 0.477 0.5 50 0.936 0.736 Proposed 0.469 0.5 70 1.027 0.731 4. CONCLUSION This w o rk proposes techniques to p redict the salienc y map of the o mnidirectional images based on salie ncy p redictor of the conventional 2D i mage. Both ERP -based and CMP-based saliency predictio n is realized . The exp erimental results s ho w that an average m od el is superior in performance o ver the individual CMP-based model and ERP -based model. T he optimization on the sp here do main b ring s additional improvement. The proposed techniques ha ve con siderably good performance i n predicting the NSS a nd AUC. Future work ca n co nsider se veral changes to improve this model. The ERP-based saliency prediction can be rep laced by m ulti - view based salienc y predictio n to better extract the visual attention. Moreover, this model can be combined with a training-based salie ncy predictor to yield improved results. REFERENCE [1] K. Rapantzikos, Y. Avrithis, and S. Kollias, “ Dense saliency- based spatiotemporal feature points for action recognition, ” Proc. of IEEE Conference on Compu ter Vision and P a ttern Recognition , 2009, pp.1454-1461. [2] G. Luz, J. Ascenso, C. Brites, and F. Per eira, “ Saliency-driven omnidirectional imaging adaptive coding: M odeling and assessment, Proc. of IEEE International Workshop on Multimedia Signal Processing , 2017, pp.1-6 . (d) (c) (b) (a) [3] M. Yu, H. Lakshman an d B. Girod, “ A framework to evaluate omnidirectional video coding sche mes, ” Proc. of IEEE International Symposium on Mixed and Augmented Reality , 2015, pp. 31-36. [4] J. Harel, C. Koch, P. Perona, Gra ph-b ased visual salie ncy, Proc. of Neural Information Processing Systems (NIPS), 2006. [5] J. Zhang and S. Sclaroff, “ Saliency detection: a b oolean map approach. Pr o c. of IEEE International C o nference on Computer Vision , 2013, pp. 153-160. [6] J. Pan, C. Canton, K. McGuinness, and N. E. O’Connor, J. Torres, E. Sayrol, and X. Giro-i- Nieto, “SalGAN: Visual saliency prediction with generative adversarial networks,” ar x iv , January 2017. [7] M. Cornia, L. Baraldi, G. Serra, and R. Cu cchiara, “ Predicting human eye fixations via an LSTM-based saliency attentive model. [8] P. Lebreton and A. Raake, “GBVS360, BMS360, ProSal: Extending existing salienc y prediction models from2D to omnidirectional image s, ” Signal Processing: Image Communication , 2018. [9] Y. Zhu, G. Zhai, and X . Min, “ The predictio n of h ead and eye movement for 360 degree images,” Signal Processing: Ima ge Communication , 2018. [10] F. -Y. Ch ao, L. Zh ang, W. Ha midouche, O. Deforges, “SAlGAN360: visual saliency prediction on 360 degree images with generative adve rs arial netw o rks,” Proc. of I EEE International Conference on Multimedia and Expo (ICME), 2018. [11] M. Startsev, a nd M. Dorr, “ 360 -aware salienc y estima ti on with convent ional image saliency predictors,” Signal Processing: Image Communication , 2018. [12] R. Monro y, S. Lutz, T. Ch alasani, and A. Smolic, “SalNet360: Saliency maps for o mni-directional images with CNN ,” Signal Processing: Image Communication , 2017. [13]J. L in g, K. Z h ang, Y. Zhang, D. Yang , and Z. Chen, “A saliency prediction model on 360 degree images usin g color dictionary based sparse representation,” Signal Processing: Image Communication, 2018. [14] Z. Bylinskii, T. Judd, A. Borji, L. Itti, F. Durand, A. Oliva, A. Torralba, MIT saliency benchma rk [15] A. D. A b reu, C. Ozcinar, and A. Smolic, “Look around you: Saliency maps for omnidirectional images in V R applications.” Proc. of International Conference on Quality of Multimedia Experience (QoMEX), 2017, pp. 1-6. [16] G. Luz, J. Ascenso, C. Brites, and F. P ereira, “Saliency -driven omnidirectional imaging adaptive coding: Modeling and assessment, Pro c. o f IEEE In ternational Workshop on Multimedia Signal Processing , 2017, pp.1- 6. [17] C. Carlson , “How I made w in e glasses fro m sunflowers,” http://blog.wolfram.c om/2011/07 /28/how-i-made-wine- glasses-from-sunflowers/ [18] M. Yu, H. L akshman, and B. Girod, “A framework to evaluate omnidirectional video coding schemes,” Proc. o f IEEE International Symposium on Mixed and Augmented Reality , 2015, pp. 31-36. [19] Y. Rai, P . Le Callet, “A d ataset of h ead a nd eye m ovements for 360 o image , ” Proc. of ACM Conference on Multimedia Systems , 2017, pp. 205-210. [20] Z. Bylinskii, T. Jud d, A. Oliva, A. Torralba, and F. Durand, “What do d iffe rent evaluation metrics tell us about saliency models?,” ar Xiv preprint arXiv:1604.03605 , 2016. [21] J. Gut ié rrez, E. David, Y. Ra i, P. Le Call et, “T oolbox and dataset f or the deve lopment of saliency and scanpath m od els for omnidirectional/360 still image, ” Signal Processing: Image Communication , 2018. [ 22 ] University of Nantes, “ Salient360!: visual attention modeling for 3 60 images grand challen ge, ” Proc. of IEEE International Conference on Multimedia and Expo (ICME), 2017.
Original Paper
Loading high-quality paper...
Comments & Academic Discussion
Loading comments...
Leave a Comment