Contact Surface Area: A Novel Signal for Heart Rate Estimation in Smartphone Videos
We consider the problem of smartphone video-based heart rate estimation, which typically relies on measuring the green color intensity of the user's skin. We describe a novel signal in fingertip videos used for smartphone-based heart rate estimation:…
Authors: Sara Fridovich-Keil, Peter J. Ramadge
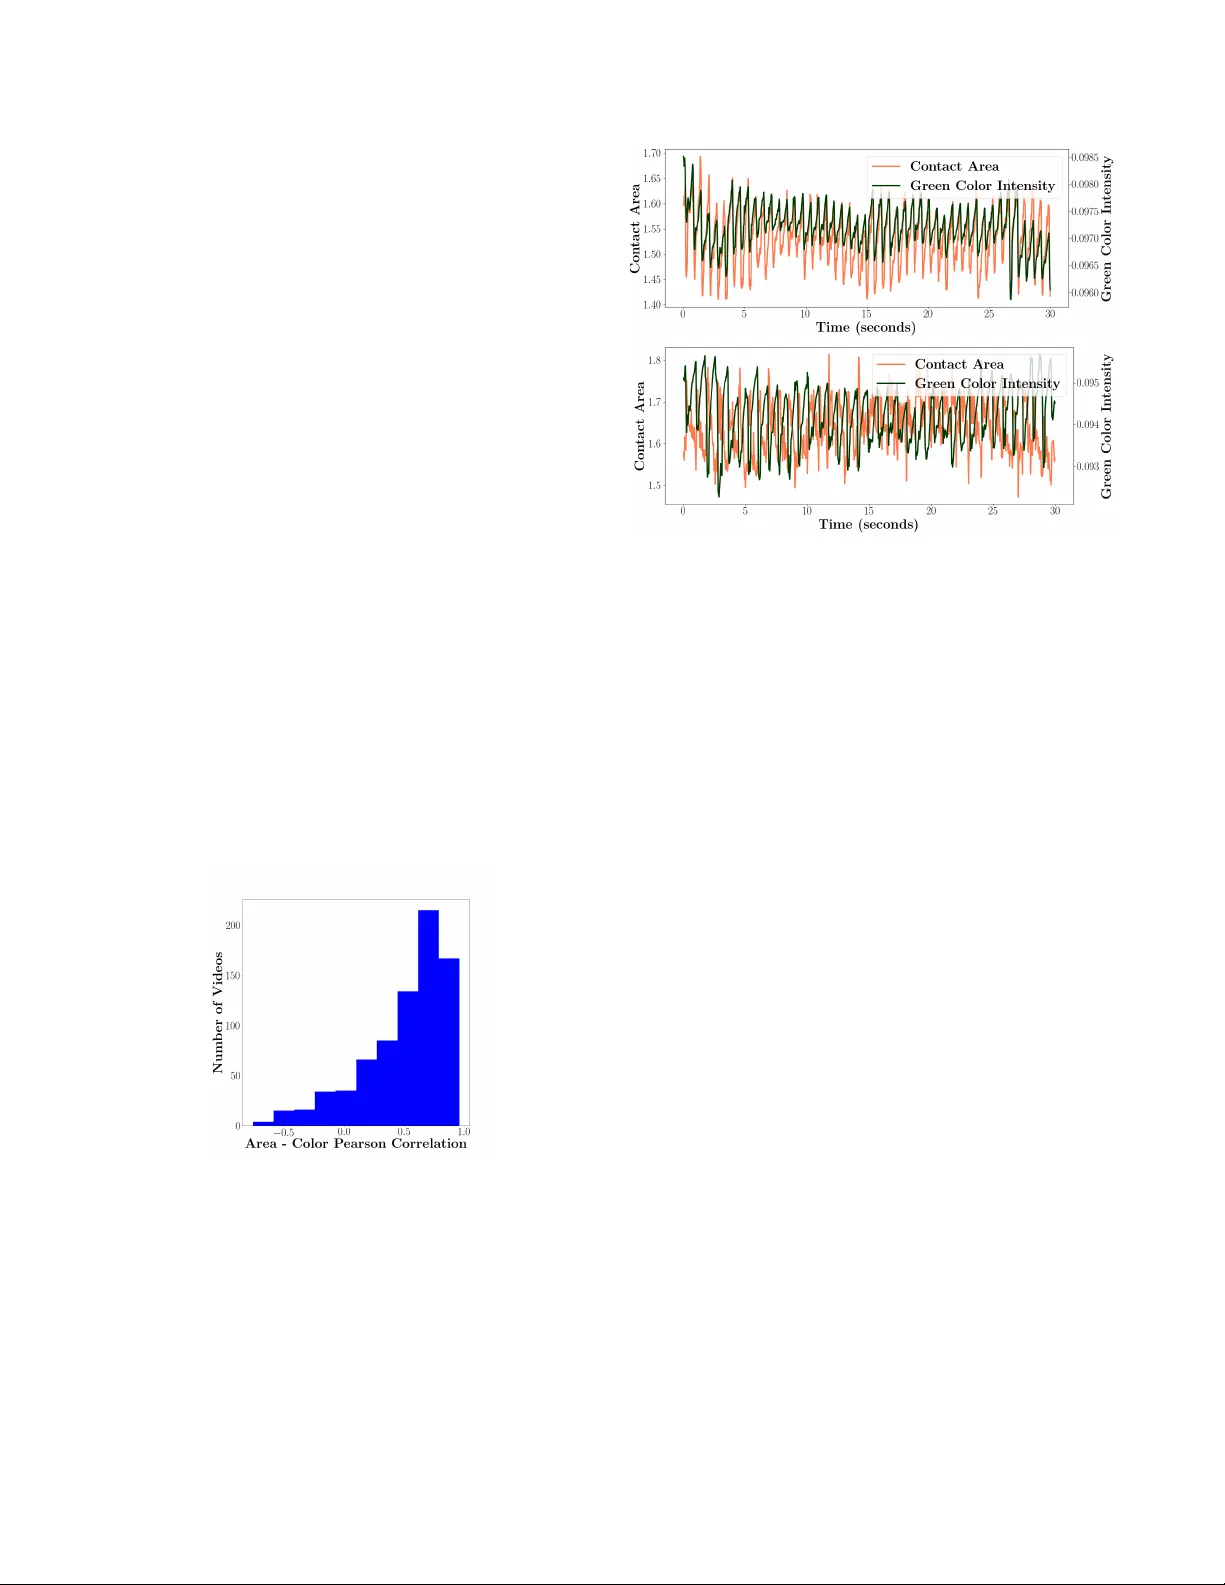
CONT A CT SURF A CE AREA: A NO VEL SIGNAL FOR HEAR T RA TE ESTIMA TION IN SMAR TPHONE VIDEOS Sara F ridovich-K eil and P eter J . Ramadge Princeton Uni versity Department of Electrical Engineering Princeton, NJ, USA ABSTRA CT W e consider the problem of smartphone video-based heart rate estimation, which typically relies on measuring the green color intensity of the user’ s skin. W e describe a novel signal in fingertip videos used for smartphone-based heart rate esti- mation: fingertip contact surface area. W e propose a model relating contact surface area to pressure, and validate it on a dataset of 786 videos from 62 participants by demonstrating a statistical correlation between contact surface area and green color intensity . W e estimate heart rate on our dataset with two algorithms, a baseline using the green signal only and a nov el algorithm based on both color and area. W e demon- strate lo wer rates of substantial errors ( > 10 beats per minute) using the no vel algorithm (4.1%), compared both to the base- line algorithm (6.4%) and to published results using commer- cial color-based applications ( ≥ 6% ). Index T erms — photoplethysmography (PPG), heart rate monitoring, group LASSO 1. INTR ODUCTION Most methods for home measurement of heart rate rely on reflectiv e photoplethysmograph y (PPG). PPG inv olves mea- suring the light reflected by vascularized skin to infer its blood volume [1]. The premise of this method in the context of smartphone videos is that hemoglobin in the blood absorbs green light, so the intensity of green light reflected by the skin is related to the volume of blood in the skin, which rises and f alls with each heartbeat [2]. PPG comes in two v arieties, contact (touching the skin) and non-contact (not touching the skin), both of which are implemented in freely a v ailable smartphone applications, although contact PPG tends to pro- vide higher accuracy for heart rate estimation [3]. These applications are not considered medical devices and are not subject to accuracy standards for electrocardiograph (ECG) heart rate monitors set forth by the American National Stan- dards Institute/American Association for the Advancement *This w ork was funded by the Department of Electrical Engineering and School of Engineering and Applied Science at Princeton Univ ersity . of Medical Instrumentation, which require measurements to be within 5 beats per minute (bpm) or 10% of the true value, whichever is greater [4]. Nonetheless, studies hav e reported mean absolute errors well within this tolerance for the applications “Instant Heart Rate, ” “Heart Fitness” [3], and “Cardiio” [5], when using contact video PPG with a user’ s fingertip. Despite these lo w mean absolute errors, published accu- racy results for contact PPG include a long tail in the distrib u- tion of absolute estimation errors. This long tail is a barrier to user trust in smartphone-based heart rate measurement, as the reported heart rate has been shown to dif fer from the ground truth by more than 10 bpm on at least 6% of measurements and differ by more than 20 bpm on at least 4% of measure- ments [3]. In this paper, we extend prior methods of video-based heart rate estimation by utilizing a novel signal present in fin- gertip videos, fingertip contact surface area, to reduce the tail of the absolute heart rate estimation error distribution. W e propose a model of the relationship between the contact sur- face area signal and the pressure in the fingertip, and vali- date it empirically by showing that contact area correlates with green color , which is used by PPG to estimate heart rate. W e use both green color and surface area to estimate heart rate on a dataset of 786 videos collected with concur- rent reference heart rate measurements from 62 participants. W e demonstrate that heart rate estimation using both color and area achie ves comparable mean absolute error and re- duces the occurrence of high absolute errors in the distribu- tional tail compared to a baseline implementation using only green color . 2. SUBJECTS, MODEL, AND METHODS 2.1. Study Subjects Our study population consisted of 62 adult volunteers; all re- cruitment materials and study procedures were approved by the Institutional Revie w Board of Princeton University . Sub- jects included 37 female and 25 male participants with mean ± standard deviation ages of 30.2 ± 15.4 and 27.2 ± 12.9 years old, respectiv ely . Participants ranged in age from 18 to 64 years old. Our dataset includes a total of 786 fingertip videos (approximately 13 per participant), each with a con- current reference heart rate measurement. Reference heart rates had a mean ± standard de viation of 77.1 ± 13.9 bpm. 2.2. Study Pr ocedur e Reference measurements were taken using an Omron arm cuff, model BP742, which is certified to measure heart rates between 40 and 180 bpm to within ± 5% of the true value [6]. All participants were seated for sev eral minutes prior to data collection, and roughly two thirds were asked to exercise after the third measurement in order to ele vate their heart rate transiently . 1 V ideos were recorded at heart elev ation using an iPhone 5 (1080 by 1920 pixels at 30 frames per second) with the flash on to provide continuous illumination. V ideos were recorded using the index finger of the arm not used for concurrent reference measurements. Fig. 1 illustrates the video recording setup. The finger- tip was resting on a tabletop nail side do wn, supporting the weight of the smartphone, thereby maintaining roughly con- stant force on the fingertip. The fingertip was positioned to cov er the flash and a portion of the camera lens, so that the edge of the fingertip contact surface appeared in the video, as shown in Fig. 2. A loose rubber band was used to help position the fingertip without restricting blood flow . Fig. 1 . V ideo recording setup. 2.3. Model W e model the fingertip as an elastic ellipsoid, where the con- tact surface of the fingertip against the smartphone is subject to the relation: ar ea = f or ce pr essur e (1) If the finger is held still, the force of the smartphone against the fingertip can be approximated as constant ov er time. Ac- cordingly , we expect the contact surf ace area to v ary in versely with the pressure inside the fingertip. The volume of blood in 1 Participants with ele vated resting blood pressure were not asked to ex er- cise. the fingertip rises and falls with each heartbeat, implying that the pressure in the fingertip rises and falls accordingly . It fol- lows that both contact surface area and green color intensity vary with blood volume in the fingertip. In Section 3, we v al- idate this model by showing a statistical correlation between contact surface area and green color intensity . 2.4. Heart Rate Estimation The contact area of the fingertip in each video frame was ap- proximated as an ellipse, as sho wn in Fig. 2. W e found the contour of the contact region by applying Otsu’ s threshold- ing method [7] to the red channel, which is robust to glare from the camera flash, and then fitted an ellipse to the con- tour using Algorithm 3.1 described by Fitzgibbon and Fisher [8]. The green color signal was tak en as the mean green pixel intensity ov er all pixels inside the contact area. Fig. 2 . Ra w video frame (left) and estimated ellipse (right). W e estimated heart rate for each video using two algo- rithms: a baseline PPG-based algorithm (“PPG-only”) using only green color and a novel algorithm (“PPG-area”) combin- ing contact area and green color . Determining the fundamen- tal frequency of these time-domain signals may be viewed as a power spectral density estimation problem, for which clas- sic algorithms exist, e.g. MUSIC [9]. In this work, we use an ensemble approach combining estimates based on the FFT and group LASSO [10] o ver the FFT coefficients to encour- age a sparse frequency representation. The functions in each group were a sine and a cosine at the same frequency , reg- ularized jointly so that the magnitude b ut not the phase was penalized. For each method, the frequency between 30 and 180 bpm with the highest magnitude was taken as the heart rate estimate, and videos where the two estimates differed by more than 5 bpm were deemed excessi vely noisy and rejected. W e randomly separated our 62 participants into training and testing sets, computed the mean squared heart rate estimation error using FFT and group LASSO on the training dataset, and then combined our estimates ( H R F and H R L , respec- tiv ely) on the testing dataset to minimize mean squared error , under the assumptions that the two heart rate estimates are independent and normally distributed: H R C ombined = σ 2 L σ 2 F + σ 2 L H R F + σ 2 F σ 2 F + σ 2 L H R L (2) where σ 2 F is the mean squared training error using FFT and σ 2 L is the mean squared training error using group LASSO. PPG-area transformed both contact area and green color into the frequency domain separately using the FFT and group LASSO approaches. Each approach produced a heart rate estimate by taking the frequency between 30 and 180 bpm corresponding to the maximum element-wise product of the area and color frequency coefficient magnitudes. A video was rejected if the maximal product magnitude did not surpass a threshold, or if the estimates produced by FFT and group LASSO differed by more than 5 bpm. The FFT and group LASSO estimates were combined in the same manner as in the PPG-only algorithm. Further details regarding both PPG-only and PPG-area can be found in the implementation code at https:// github.com/sarafridov/FingertipVideo . 3. RESUL TS 3.1. Model V alidation W e validated the model proposed in Section 2.3 by computing the Pearson correlation coefficient between contact area and green color in each of the 771 (98%) videos for which the edge of the fingertip was visible for at least 20 seconds, as shown in Fig. 3. After removing baseline trends separately in each signal to compensate for finger motion using a method based on that described by T arvainen et al. [11], the mean ± standard de viation correlation was 0.50 ± 0.35, where 62% of videos showed correlation > 0 . 5 , median correlation was 0.60, and 11.4% of videos had negati ve correlation. Fig. 3 . Histogram of Pearson correlation coef ficients between detrended fingertip ellipse area and green color intensity . Fig. 4 shows the ra w area and color time series for two videos. Area and color are in phase and positively correlated in the first video, as in the majority of videos. Area and color are out of phase and negati vely correlated in the second video, yet both signals contain clear v ariation at the same frequency: the heart rate. Although both contact area and green color vary with blood volume, the former is transduced optically and the Fig. 4 . Example raw fingertip contact area (normalized to screen size) and green color intensity over time for two videos from different participants. latter mechanically . The precise relationship between blood volume and these quantities likely depends on indi vidual parameters such as skin thickness and elasticity . A more thorough modeling of this relationship may explain why a small proportion of the videos exhibit negativ e correlation between green color and surface area, as discussed further in Section 4.2. 3.2. Impro ved Heart Rate Estimation with PPG and Area T able 1 presents key attributes of the two algorithms. PPG- area rejected a slightly higher percentage of the testing videos, but achie ved higher accuracy in all metrics compared to PPG- only . PPG-area had lower mean absolute testing error and lower rates of substantial errors, as well as stronger agreement with the reference measurements. Bland-Altman plots [12] comparing these algorithms are shown in Fig. 5. The mean absolute testing errors for both PPG-only and PPG-area were within the reported accuracy of our reference arm cuff instrument. PPG-only had greater than 10 bpm ab- solute error on nearly the same percentage of measurements (6%) as did “Heart Fitness, ” the most accurate PPG-based ap- plication for which comparable data were a vailable [3]. PPG- only had absolute error more than 20 and more than 40 bpm at slightly lo wer rates (2.6% vs. 4% and 0.5% vs. 2%, respec- tiv ely) than the most accurate commercial applications for which these statistics were av ailable [3]. PPG-area achieved a lower rate of absolute error more than 10 bpm (4% versus 6%), 20 bpm (1% versus 4%), and 40 bpm (0% versus 2%) [3]. PPG-area like wise achiev ed lower rates of substantial error compared to PPG-only , as well as stronger agreement ( r = 0 . 94 versus r = 0 . 89 ) with the reference heart rate. PPG-only PPG-area V ideos accepted (%) 93.5 91.25 Mean abs. testing error 2.91 ± 0.29 2.60 ± 0.21 ± standard error (bpm) V ideos with abs. testing 6.42 4.11 error > 10 bpm (%) V ideos with abs. testing 2.67 1.10 error > 20 bpm (%) V ideos with abs. testing 0.53 0.00 error > 40 bpm (%) Pearson’ s r 0.89 0.94 ( p < 0 . 00001 ) ( n = 374 ) ( n = 365 ) Mean bias (bpm) -0.84 -0.51 95% limits of agreement (-13.27, 11.59) (-9.71, 8.69) with arm cuff (bpm) T able 1 . Heart rate estimation results using PPG-only and PPG-area, where error is with respect to reference heart rate measurements using the arm cuff on the testing dataset. 4. DISCUSSION In this study , we proposed a model describing the relationship between fingertip contact surface area and pressure, which is a physical indicator of blood flo w . W e validated this model by demonstrating a positiv e correlation between contact surface area and green color intensity , the signal commonly used in PPG-based heart rate estimation. W e also demonstrated that the contact area contains additional information that is not present in the green color , and that including the area signal in addition to green color can apply this information to reduce the incidence of high absolute errors in heart rate estimation. 4.1. Limitations This study was subject to limitations in both dataset and data analysis. Our study population included predominantly young adults (18-22 years old). Although many participants were asked to exercise briefly , nearly all of our reference heart rates were below 120 bpm. A second limitation is that although participants were asked to hold their measurement finger still and flat against the tabletop, many accidentally mov ed their finger slightly during video recording. Further , our reference heart rate measurements were limited by the accuracy of the arm cuf f de vice. W e designed features and algorithms intended to approxi- mate those used by commercial PPG-based applications, with the addition of the area signal, but we could not directly repli- cate those algorithms because they were proprietary . As such, we were able to dra w direct comparisons between our PPG- only and PPG-area algorithms, but there may be specific fea- tures of our algorithms that differed from the algorithms run- ning in the v arious PPG-based commercial applications. Nev- Fig. 5 . Bland-Altman plots showing the accuracy of PPG- only (left) and PPG-area (right) heart rate estimation com- pared to reference heart rate measured using an arm cuff. The dotted lines represent the mean and 95% limits of agreement for the difference between estimated and reference heart rates, showing tighter agreement for PPG-area. ertheless, our PPG-only algorithm achie ves error rates on our dataset comparable to the most accurate commercial PPG- based applications [3], suggesting that PPG-only captures the salient features of the commercial algorithms. 4.2. Future W ork The fingertip contact surface area model introduced in this pa- per may be dev eloped further in both applications and theory . Possible applications of this area signal include video- based measurement of blood pressure and hematocrit. If our area model holds, systolic blood pressure should be in versely proportional to the minimum contact surf ace area over a heartbeat, while diastolic blood pressure should be in versely proportional to the maximum contact surface area over a heartbeat. Fingertip contact surface area in combination with green color intensity may also enable video-based hematocrit measurement, which is the volume fraction of red blood cells in the blood and is used to diagnose and monitor anemia. The area signal is influenced primarily by blood volume, while the green color signal is influenced primarily by the amount of hemoglobin present in the red blood cells. Future theoretical work will be dev oted to refining the model proposed here to account for the complex physical and optical properties of the fingertip. One promising next step would be to utilize the on-device accelerometer to estimate net forces on the fingertip over time and account for them algorithmically . A more precise modeling of the effects of fingertip tissue elasticity may additionally explain the distri- bution we observ ed in the correlation between the color and area signals recorded from different participants. The model could be further improv ed by considering the impact of the in verse relationship in the time domain between pressure and area on the area signal in the frequency domain. These future directions present promising opportunities for public health and medical research. 5. REFERENCES [1] John Allen. “Photoplethysmography and its applica- tion in clinical ph ysiological measurement”. In: Physi- ological measur ement 28.3 (2007), R1. [2] W eijia Cui, Lee E Ostrander , and Bok Y Lee. “In vivo reflectance of blood and tissue as a function of light wa velength”. In: IEEE transactions on biomedical en- gineering 37.6 (1990), pp. 632–639. [3] Thomas Coppetti et al. “Accuracy of smartphone apps for heart rate measurement”. In: Eur opean journal of pr eventive cardiolo gy 24.12 (2017), pp. 1287–1293. [4] Association for the Advancement of Medical Instru- mentation et al. “Cardiac monitors, heart rate me- ters, and alarms”. In: American National Standard (ANSI/AAMI EC13: 2002) Arlington, V A (2002), pp. 1– 87. [5] Ming-Zher Poh and Y ukkee C Poh. “V alidation of a standalone smartphone application for measuring heart rate using imaging photoplethysmography”. In: T elemedicine and e-Health 23.8 (2017), pp. 678–683. [6] Omron. 5 Series Blood Pr essure Monitor Model BP742 . U R L : https : / / omronhealthcare . com / wp - content / uploads / bp742 _ im _ eng _ 09152010.pdf (visited on 04/24/2018). [7] Nobuyuki Otsu. “A threshold selection method from gray-lev el histograms”. In: IEEE transactions on sys- tems, man, and cybernetics 9.1 (1979), pp. 62–66. [8] Andrew W Fitzgibbon, Robert B Fisher, et al. “A buyer’ s guide to conic fitting”. In: D AI Resear ch paper (1996). [9] MH Hayes. Statistical Digital Signal Pr ocessing and Modeling . John W iley & Sons, Inc., 1996. [10] Ming Y uan and Y i Lin. “Model selection and estima- tion in regression with grouped variables”. In: Journal of the Royal Statistical Society: Series B (Statistical Methodology) 68.1 (2006), pp. 49–67. [11] Mika P T arvainen, Perttu O Ranta-Aho, and Pasi A Karjalainen. “An advanced detrending method with application to HR V analysis”. In: IEEE T ransactions on Biomedical Engineering 49.2 (2002), pp. 172–175. [12] J Martin Bland and DouglasG Altman. “Statistical methods for assessing agreement between two meth- ods of clinical measurement”. In: The lancet 327.8476 (1986), pp. 307–310.
Original Paper
Loading high-quality paper...
Comments & Academic Discussion
Loading comments...
Leave a Comment