EEG-informed attended speaker extraction from recorded speech mixtures with application in neuro-steered hearing prostheses
OBJECTIVE: We aim to extract and denoise the attended speaker in a noisy, two-speaker acoustic scenario, relying on microphone array recordings from a binaural hearing aid, which are complemented with electroencephalography (EEG) recordings to infer …
Authors: Simon Van Eyndhoven, Tom Francart, Alex
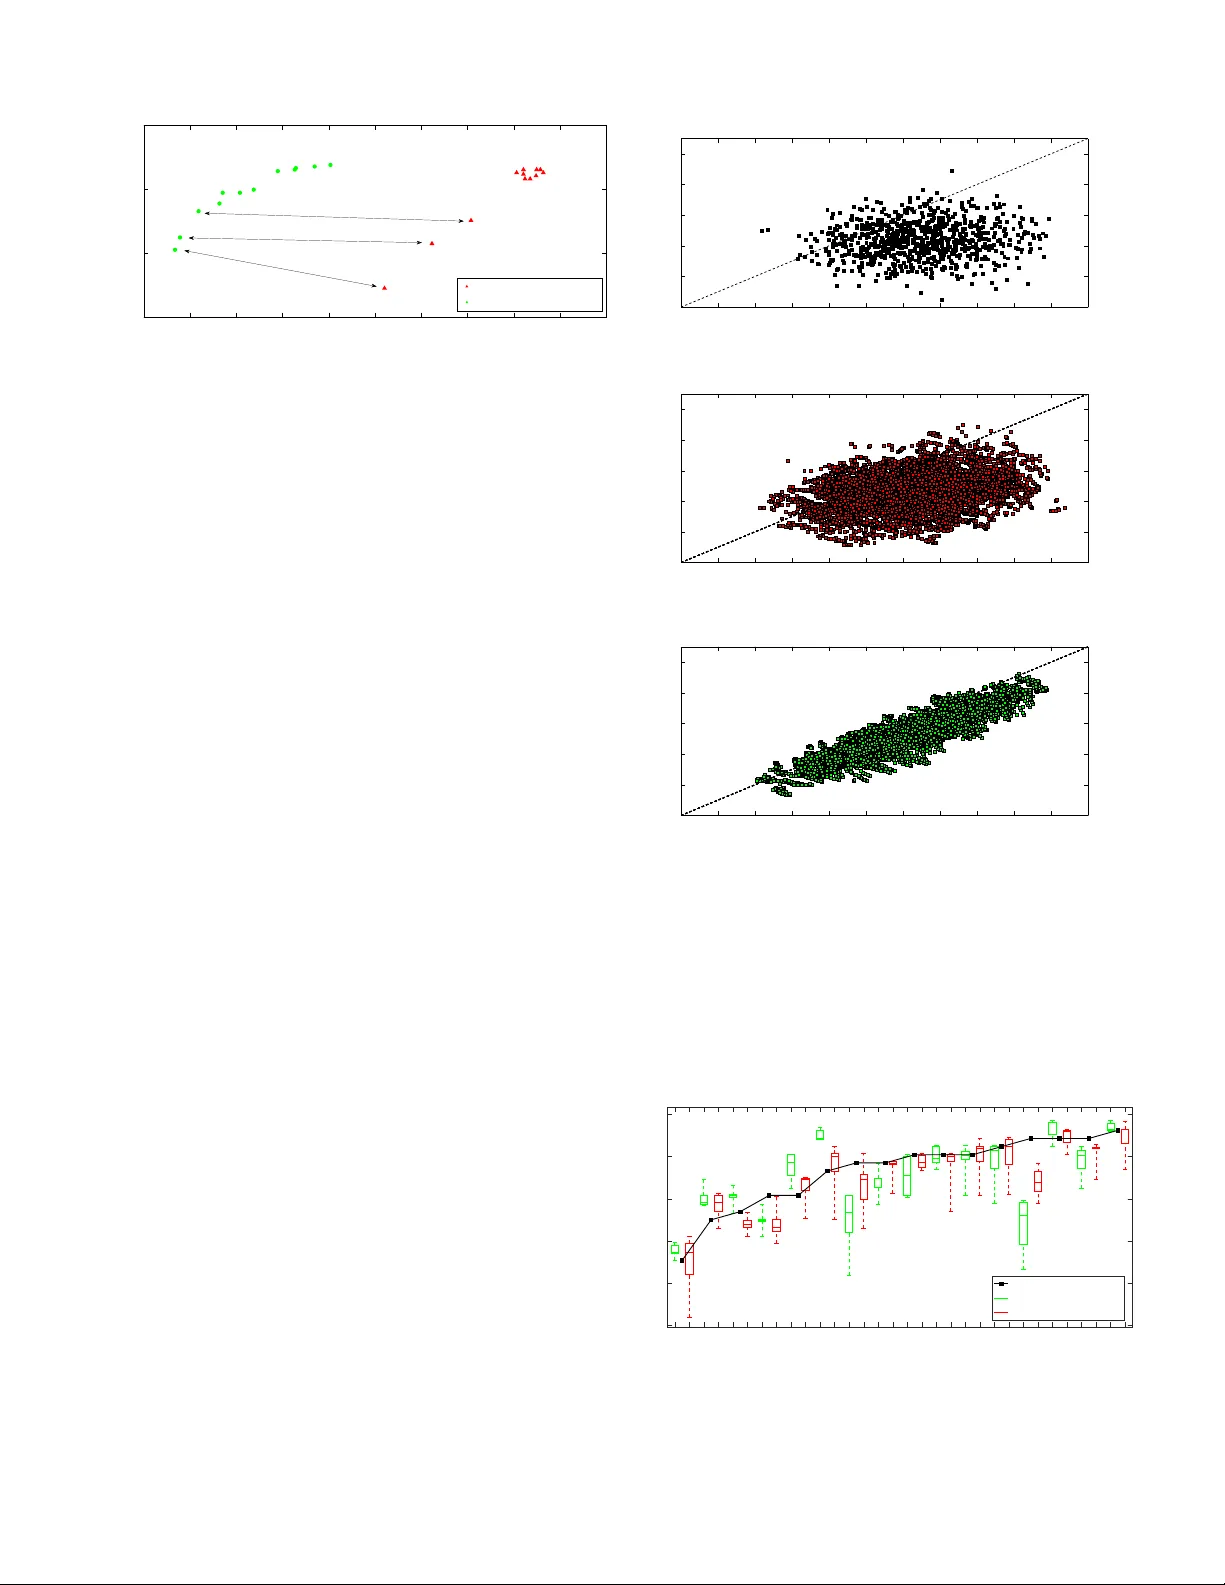
1 EEG-informed attended sp eak er extraction from recorded sp eec h mixtures with application in neuro-steered hearing prostheses Simon V an Eyndho v en, T om F rancart, and Alexander Bertrand, Memb er, IEEE . A bstr act — Obje ctive : W e aim to extract and denoise the attended sp eak er in a noisy , t w o-sp eak er acoustic scenario, relying on microphone arra y recordings from a binaural hearing aid, whic h are complemented with electro encephalograph y (EEG) recordings to infer the sp eak er of interest. Metho ds : In this study , w e prop ose a mo dular pro cessing flow that first extracts the t w o sp eec h en v elop es from the microphone recordings, then selects the attended sp eech en v elop e based on the EEG, and finally uses this en v elop e to inform a m ulti-c hannel sp eec h separation and denoising algorithm. R esults : Strong suppression of in terfering (unattended) speech and background noise is achiev ed, while the attended sp eec h is preserv ed. F urthermore, EEG-based auditory atten tion detection (AAD) is sho wn to b e robust to the use of noisy sp eech signals. Conclusions : Our results sho w that AAD-based sp eak er extraction from micro- phone arra y recordings is feasible and robust, even in noisy acoustic en vironmen ts, and without access to the clean sp eech signals to p erform EEG-based AAD. Signific anc e : Curren t researc h on AAD alw a ys assumes the a v ailability of the clean sp eec h signals, which limits the applicability in real settings. W e hav e extended this researc h to detect the attended sp eaker even when only microphone recordings with noisy sp eech mixtures are a v ailable. This is an enabling ingredient for new brain- computer in terfaces and effectiv e filtering schemes in neuro-steered hearing prostheses. Here, w e pro vide a first pro of of concept for EEG-informed attended sp eak er extraction and denoising. Index T erms —EEG signal pro cessing, sp eech enhancemen t, auditory atten tion detection, brain- computer in terface, auditory prostheses, blind source separation, multi-c hannel Wiener filter This w ork was carried out at the ESA T Lab oratory of KU Leuv en, in the frame of KU Leuven Researc h Council BOF/STG-14-005, CoE PFV/10/002 (OPTEC), Research Pro jects FWO nr. G.0931.14 ‘Design of distributed signal processing algorithms and scalable hard- ware platforms for energy-vs-performance adaptive wireless acoustic sensor net w orks’, and HANDiCAMS. The project HANDiCAMS ackno wledges the financial supp ort of the F uture and Emerging T echnologies (FET) programme within the Seven th F ramework Pro- gramme for Research of the Europ ean Commission, under FET-Open grant n umber: 323944. The scientific resp onsibilit y is assumed by its authors. S. V an Eyndhov en and A. Bertrand are with KU Leuven, Department of Electrical Engineering (ESA T), Stadius Center for Dynamical Systems, Signal Processing and Data Analytics, Kasteelpark Arenberg 10, box 2446, 3001 Leuv en, Belgium (e-mail: simon.v aneyndhov en@esat.kuleuv en.b e, alexander.bertrand@esat.kuleuven.be). T. F rancart is with KU Leuven, Departmen t of Neurosciences, Researc h Group Exp erimental Oto-rhino-laryngology (e-mail: tom.francart@med.kuleuven.be). I. Introduction In order to guaran tee speech in telligibility in a noisy , m ulti-talk er en vironment, often referred to as a ‘co cktail part y scenario’, hearing prostheses can greatly b enefit from effective noise reduction techniques [1], [2]. While n umerous and successful efforts ha ve been made to achiev e this goal, e.g. by incorporating the recorded signals of m ultiple microphones [2]–[4], many of these solutions strongly rely on the proper iden tification of the target sp eak er in terms of voice activity detection (V AD). In an acoustic scene with multiple comp eting sp eakers, this is a highly non-trivial task, complicating the o v erall problem of noise suppression. Ev en when a go o d speaker separation is possible, a fundamental problem that appears in such m ulti-sp eak er scenarios is the selection of the speaker of in terest. T o mak e a decision, heuristics hav e to be used, e.g., selecting the speaker with highest energy , or the sp eak er in the frontal direction. How ever, in man y real- life scenarios, such heuristics fail to adequately select the attended sp eaker. Recen tly ho w ever, auditory attention detection (AAD) has b ecome a p opular topic in neuroscientific and audio- logical research. Different exp eriments hav e confirmed the feasibilit y of a deco ding paradigm that, based on record- ings of brain activit y suc h as the electroencephalogram (EEG), detects to which sp eak er a sub ject attends in an acoustic scene with m ultiple competing speech sources [5]– [10]. A ma jor drawbac k of all these exp eriments is that they place strict constraints on the metho dological design, whic h limits the practical use of their results. More pre- cisely all of the prop osed paradigms emplo y the separate ‘clean’ speech sources that are presen ted to the sub jects (to correlate their en v elop es to the EEG data), a condition whic h is never met in realistic acoustic applications suc h as hearing prostheses, where only the sp eech mixtures as observ ed b y the device’s lo cal microphone(s) are av ailable. In [11] it is rep orted that the detection p erformance drops substan tially under the effect of crosstalk or uncorrelated additiv e noise on the reference sp eec h sources that are used for the auditory atten tion deco ding. It is hence worth while to further in v estigate AAD that is based on mixtur es of the sp eak ers, such as in the signals recorded by the microphones of a hearing prosthesis. Nonetheless, devices suc h as neuro-steered hearing pros- theses or other brain-computer in terfaces (BCIs) that implemen t AAD, can only b e widely applied in realistic This pap er is published in IEEE T ransactions on Biomedical Engineering (2016) and is under copyrigh t. Please cite this paper as: S. V an Eyndhov en, T. F rancart, and A. Bertrand, ”EEG-informed attended sp eaker extraction from recorded sp eech mixtures with application in neuro-steered hearing prostheses”, IEEE T ransactions on Biomedical Engineering, vol. 64, no. 5, pp. 1045-1056, 2017. 2 scenarios if they can op erate reliably in these noisy condi- tions. End users with (partial) hearing impairment could greatly b enefit from neuro-steered sp eech enhancement and denoising technologies, esp ecially if they are imple- men ted in compact mobile devices. EEG is the preferred c hoice for these emerging solutions, due to its cheap and non-in v asive nature [12]–[17]. Many research efforts hav e b een fo cused on different asp ects of this mo dality to enable the developmen t of small scale, wearable EEG devices. Sev eral studies hav e addressed the problem of wearabilit y and miniaturization [13]–[16], data compression and p ow er consumption [16], [17]. In this study , we combine EEG-based auditory atten- tion detection and acoustic noise reduction, to suppress in terfering sources (including the unattended sp eaker) from noisy m ulti-microphone recordings in an acoustic scenario with tw o simultaneously activ e speakers. Our algorithm enhances the attended sp eak er, using EEG- informed AAD, based only on the microphone recordings of a hearing prosthesis, i.e., without the need for the clean sp eec h signals 1 . The final goal is to hav e a computationally c heap pro cessing chain that takes microphone and EEG recordings from a noisy , multi-speaker en vironmen t at its input and transforms these into a denoised audio signal in which the attended sp eaker is enhanced, and the unattended sp eaker is suppressed. T o this end, we reuse experimental data from the AAD exp erimen t in [9] and use the same sp eech data as in [9] to synthesize microphone recordings of a binaural hearing aid, based on publicly a v ailable head-related transfer functions which w ere measured with real hearing aids [18]. As we will sho w further on, non-negative blind source separation is a con v enient tool in our approach, as we need to extract the sp eec h env elop es from the recorded mixtures. T o this end, w e rely on [19], where a lo w-complexity source separation algorithm is prop osed that can op erate at a sampling rate that is muc h smaller than that of the microphone signals, whic h is very attractiv e from a computational p oint of view. W e inv estigate the robustness of our pro cessing sc heme b y adding v arying amoun ts of acoustic in terference and testing different sp eaker setups. The outline of the pap er is as follo ws. In section I I, we giv e a global ov erview of the problem and an introduction to the different asp ects w e will address; in section II I w e explain the tec hniques for non-negativ e blind source separation, and cov er the extraction of the attended speech from (noisy) microphone recordings; in section IV we de- scrib e the conducted exp eriment; in section V we elab orate on the results of our study; in section VI we discuss these results and consider future research directions; in section VI I we conclude the pap er. 1 W e still use clean sp eech signals to design the EEG deco der in an initial training or calibration phase. How ever, once this deco der is obtained, our algorithm op erates directly on the microphone recordings, without using the original clean sp eech signals as side- channel information. I I. Problem st a tement A. Noise r e duction pr oblem W e consider a (binaural) hearing prosthesis equipp ed with m ultiple microphones, where the signal observed by the i -th microphone is mo deled as a conv olutive mixture: m i [ t ] = ( h i 1 ∗ s 1 )[ t ] + ( h i 2 ∗ s 2 )[ t ] + v i [ t ] (1) = x i 1 [ t ] + x i 2 [ t ] + v i [ t ] . (2) In (1), m i [ t ] denotes the recorded signal at microphone i , whic h is a sup erp osition of con tributions x i 1 [ t ] and x i 2 [ t ] of b oth sp eech sources and a noise term v i [ t ]. x i 1 [ t ] and x i 2 [ t ] are the result of the conv olution of the clean (‘dry’) sp eec h signals s 1 [ t ] and s 2 [ t ] with the head-related impulse resp onses (HRIRs) h i 1 [ t ] and h i 2 [ t ], resp ectively . These HRIRs are assumed to b e unknown and mo del the acoustic propagation path b et ween the source and the i -th microphone, including head-related filtering effects and reverberation. The term v i [ t ] bundles all bac kground noise impinging on microphone i and con taminating the recorded signal. Con v erting (1) to the (discrete) frequency domain, we get M i ( ω j ) = H i 1 ( ω j ) S 1 ( ω j ) + H i 2 ( ω j ) S 2 ( ω j ) + V i ( ω j ) (3) = X i 1 ( ω j ) + X i 2 ( ω j ) + V i ( ω j ) (4) for all frequency bins ω j . In (3), M i ( ω j ), S 1 ( ω j ), S 2 ( ω j ) and V i ( ω j ) are represen tations of the recorded sig- nal at microphone i , the tw o sp eech sources and the noise at frequency ω j , respectively . H i 1 ( ω j ) and H i 2 ( ω j ) are the frequency-domain represen tations of the HRIRs, whic h are often denoted as head-related transfer func- tions (HR TF s). All microphone signals and speech con- tributions can then b e stack ed in vectors M ( ω j ) = [ M 1 ( ω j ) . . . M K ( ω j )] T , X 1 ( ω j ) = [ X 11 ( ω j ) . . . X K 1 ( ω j )] T and X 2 ( ω j ) = [ X 12 ( ω j ) . . . X K 2 ( ω j )] T , where K is the n um b er of a v ailable microphones. Our aim is to enhance the attended sp eec h comp onent and suppress the inter- fering speech and noise in the microphone signals. More precisely , we arbitrarily select a reference microphone (e.g. r = 1) and, assuming without loss of generality that s 1 [ t ] is the attended sp eech, try to estimate X r 1 ( ω j ) b y filtering M ( ω j ), whic h is the full set of microphone signals 2 . Hereto, a linear minimum mean-squared error (MMSE) cost criterion is used [2], [3]: J ( W ( ω j )) = E | W ( ω j ) H M ( ω j ) − X r 1 ( ω j ) | 2 (5) in whic h W is a K -channel filter, represen ted by a K - dimensional complex-v alued vector, where the sup erscript H denotes to the conjugate transpose. Note that a differen t W is selected for each frequency bin, resulting in a spatio- sp ectral filtering, which is equiv alen t to a conv olutive spatio-temp oral filtering when translated to the time- domain. In section I I I-C, we will minimize (5) by means 2 In the case of a binaural hearing prosthesis, we assume that the microphone signals recorded at the left and right ear can b e exchanged b etw een b oth devices, e.g., ov er a wireless link [4]. 3 of the so-called multi-c hannel Wiener filter (MWF). Up to no w, it is not known which of the sp eakers is the target or attended sp eak er. T o determine this, w e need to p erform auditory attention detection (AAD), as describ ed in the next subsection. F urthermore, the MWF paradigm requires kno wledge of the times at which this attended sp eak er is active. T o this end, we need a sp eaker-dependent v oice activit y detection (V AD), which will b e discussed in subsection I I I-D. W e only hav e access to the en v elop es of the microphone signals, which con tain significan t crosstalk due to the presence of t wo sp eakers. Hence, relying on these en velopes would lead to sub optimal p erformance (i.e. misdetections of the V AD), motiv ating the use of an inter- mediate step to obtain b etter estimates of these en velopes. As stated, we employ non-negative blind source separation to obtain more accurate estimates of the env elop es, whic h will prov e to relax the V AD problem (see I I I-B). B. A uditory attention dete ction (AAD) pr oblem In (1), either s 1 [ t ] or s 2 [ t ] can be the attended sp eec h. Earlier studies sho wed that the lo w frequency v ariations of sp eec h env elop es (b etw een approximately 1 and 9 Hz) are enco ded in the ev oked brain activity [20], [21], and that this mapping differs whether the sp eech is attended to by the subject (or not) in a m ulti-speaker en vironment [6]– [8], [22], [23]. This mapping can b e reversed to categorize the attention of a listener from recorded brain activit y . In brief, the AAD paradigm works by first training a spatiotemp oral filter (deco der) on the recorded EEG data to reconstruct the env elop e of the attended sp eech by means of a linear regression [5], [9]–[11]. This deco der will reconstruct an auditory env elop e, b y in tegrating the measured brain activity across κ channels and for τ max differen t lags, describ ed by b s A [ n ] = τ max X τ =0 κ X k =1 r k [ n + τ ] d k [ τ ] (6) in whic h r k [ n ] is the recorded EEG signal at channel k and time n , d k [ τ ] is the deco der weigh t for channel k at a p ost- stim ulus lag of τ samples, and ˆ s A [ n ] is the reconstructed attended env elop e at time n . W e can rewrite this expres- sion in matrix notation, as b s A = R d , in which b s A is a vec- tor containing the samples of the reconstructed env elop e, d = [ d 0 [0] . . . d 0 [ τ max ] . . . d κ [0] . . . d κ [ τ max ] ] T is a vector with the stack ed spatiotemp oral w eights, of length chan- nels × lags, and where the matrix with EEG measuremen ts is structured as R = [ r 1 . . . r N ] T , where there is a vector r n = [ r 0 [ n ] . . . r 0 [ n + τ max ] . . . r κ [ n ] . . . r κ [ n + τ max ]] T for ev ery sample n = 1 . . . N of the env elop e. W e find the deco der by solving the following optimization problem: b d = arg min d k b s A − s A k 2 (7) = arg min d k R d − s A k 2 (8) in whic h s A is the real en velope of the attended sp eec h. Using classical least squares, we compute the deco der w eigh ts as b d = ( R T R ) − 1 R T s A . (9) The matrix R T R represents the sample autocorrelation matrix of the EEG data (for all channels and considered lags) and R T s A is the sample cross-correlation of the EEG data and the attended sp eech env elop e. Hence, the deco der b d is trained to optimally reconstruct the env elop e s A of the attended sp eech sources. If the sample correlation matrices are estimated on to o few samples, a regularization term can b e used, lik e in [10]. As motiv ated in subsection IV-B, w e omitted regularization in this study . The deco ding is successful if the deco der reconstructs an env elop e that is more correlated with the en v elope of the attended sp eech than with that of the unattended sp eec h. Mathematically , this translates to r A > r U , in whic h r A and r U are the Pearson correlation co efficients of the reconstructed env elop e b s A with the en v elop es of the attended and unattended sp eech, resp ectively . In this pap er, rather than requiring the separate speech en velopes to be av ailable, w e mak e the assumption that w e only ha ve access to the recorded microphone signals (except for the training of the EEG deco der based on (9)). In section I II, w e address the problem of speech en v elop e extraction from the sp eec h mixtures in the microphone signals, to still b e able to p erform AAD using the approach explained ab o v e. I I I. Algorithm pipeline Here, w e propose a mo dular pro cessing flow that com- prises a num b er of steps tow ards the extraction and denoising of the attended speech, sho wn as a blo ck di- agram in Fig. 1. W e compute the energy en velopes of the recorded microphone mixtures (represen ted b y the ‘ env ’-blo c k and explained in subsection I I I-A) and use the multiplicativ e non-negative indep endent comp onent analysis (M-NICA) algorithm to estimate the original sp eec h env elopes from these mixtures (subsection II I-B). These sp eech en velopes are fed into the AAD processing blo c k describ ed in previous subsection, which will indicate one of b oth as b elonging to the attended sp eaker, based on the EEG recording (arro ws on the righ t). V oice activit y detection is carried out on the estimated env elopes, and the V AD trac k that is selected during AAD serv es as input to the multi-c hannel Wiener filter (subsection I I I-D). The MWF filters the set of microphon e mixtures, based on this V AD track, yielding one enhanced sp eech signal at the output (subsection I I I-C). A. Conversion to ener gy domain (ENV) In order to apply the AAD algorithm describ ed in subsection I I-B, w e need the en v elop es of the individual sp eec h sources. Since we are only interested in the sp eech en v elop es, w e will w ork in the energy domain, allo wing to solve a source separation problem at a muc h low er sampling rate than the original sampling rate of the 4 Fig. 1. Pip eline of the prop osed pro cessing flow. microphone signals. F urthermore, energy signals are non- negativ e, whic h can be exploited to perform real-time source separation based only on second-order statistics [24], rather than higher-order statistics as in man y of the standard indep endent comp onent analysis techniques. These tw o ingredients result in a computationally efficien t algorithm, whic h is imp ortant when it is to b e op erated in a battery-p ow ered miniature device such as a hearing prosthesis. A straigh tforw ard wa y to calculate an energy en v elop e is by squaring and low-pass filtering a micro- phone signal, i.e., for microphone i this yields the energy signal E m i [ n ] = 1 T T X w =1 m i [ n T + w ] 2 (10) in which n is the sample index of the energy signal, T is the num b er of samples (window length) to compute the short-time av erage energy E m i [ n ], which estimates the real microphone energy , E { m 2 i [ n T ] } . Based on (1), and assuming the source signals are indep enden t, w e can model the relationship b etw een the en v elop es of the sp eech sources and the microphone sig- nals as an approximately linear, instantaneous mixture of energy signals: E m [ n ] ≈ A E s [ n ] + E v [ n ] . (11) Here, the short-time energies of the K microphone signals and the S speech sources are stack ed in the time-v arying v ectors E m [ n ] and E s [ n ], respectively , and are related through the K × S mixing matrix A , defining the ov erall energy attenuation betw een every sp eec h source and every microphone. Similarly , the short-term energies of the N noise comp onents that contaminate the microphone sig- nals are represented by the v ector E v [ n ]. F or infinitely large T and infinitely narrow impulse resp onses, (11) is easily shown to b e exact. F or HRIRs of a finite duration and for finite T , it is a quite rough approximation, but w e found that it still provides a useful basis for the subsequen t algorithm that aims to estimate the original sp eec h env elopes from the mixtures, as we succeed to extract the original sp eec h env elop es reasonably well (see next subsection and section V). The literature also re- p orts exp eriments where the approximation in (11) has succesfully b een used as a mixing mo del for separation of sp eec h env elopes, ev en in rev erberant environmen ts with longer impulse resp onses than the HRIRs that are used here [19], [25]. B. Sp e e ch envelop e extr action fr om mixtur es (M-NICA) The M-NICA algorithm is a tec hnique that exploits the non-negativity of the underlying sources [24] to solve blind source separation (BSS) problems in an efficient w a y . It demixes a set of observed signals, that is the result of a linear mixing pro cess, into its separate, nonnegative sources. Under the assumption that the source signals are indep enden t, non-negative, and well-grounded 3 , it can b e sho wn that a p erfect demixing is obtained b y a demixing matrix that decorrelates the signals while preserving non- negativit y . Similar to [19], we will emplo y the M-NICA algorithm, to find an estimate of E s [ n ] from E m [ n ] in (11). The algorithm consists of an iterative interlea ved applica- tion of a multiplicativ e decorrelation step (preserving the non-negativit y), and a subspace pro jection step (to re-fit the data to the mo del). An in-depth description of the M- NICA algorithm is av ailable in [24], which also includes a sliding-window implementation for real-time pro cessing. A ttractiv e prop erties of M-NICA are that it relies only on 2 nd order statistics (due to the non-negativity constrain ts) and that it op erates at the low sampling rate of the en v elop es. These features foster the use of M-NICA, as the algorithm seems to b e w ell matched to the constraints of the target application, namely the scarce computational resources and the required real-time op eration. Note that the num b er of sp eech sources must be known a priori. In practice, we could estimate this num b er by a singular v alue decomp osition [19]. W e will refer to E m [ n ] and b E s [ n ] as the microphone env elop es and demixed en v elop es, resp ectiv ely , where ideally b E s [ n ] = E s [ n ]. As with most BSS techniques, a scaling and p ermutation ambiguit y remains, i.e., the ordering of the sources and their energy cannot be found, since they can be arbitrarily changed if a compensating c hange is made in the mixing matrix. In real-time, adaptive applications, these ambigu ities sta y more or less the same as time progresses and are of little imp ortance (see [19], where an adaptiv e implementation of M-NICA is tested on sp eech mixtures). It is noted that, to p erform M-NICA on (11), the matrix A should b e w ell-conditioned in the sense that it should ha v e at least t w o singular v alues that are significantly larger than 0. This means that the energy contribution of eac h sp eech source should b e differen tly distributed ov er the K mi- crophones. In [19] and [25], this was obtained by placing the microphone sev eral meters apart, whic h is not possible in our application of hearing prostheses. How ever, we use microphones that are on b oth sides of the head, such that the head itself acts as an angle-dep endent attenuator for eac h sp eak er lo cation. This results in a different spatial energy pattern for each sp eech source and hence in a w ell- conditioned energy mixing matrix A . 3 A signal is well-grounded if it attains zero-v alued samples with finite probability [24]. 5 C. Multi-channel Wiener filter (MWF) F or the sak e of conciseness, we will omit the frequency v ariable ω j in the remainder of the text. The solution that minimizes the cost function in (5) is the multi-c hannel Wiener filter c W [2]–[4], found as c W = arg min W E | W H M − X r 1 | 2 (12) = R − 1 mm R xx e r (13) = ( R xx + R v v ) − 1 R xx e r (14) in which R mm is the K × K auto correlation matrix E { MM H } of the microphone signals and R xx is the K × K sp eech auto correlation matrix E { X 1 X H 1 } , where the subscript 1 refers to the attended sp eech. Likewise, R v v is the K × K auto correlation matrix of the undesired signal comp onent. Note that the MWF will estimate the sp eec h signal S 1 as it is observed by the selected reference microphone, i.e., it will estimate H r 1 S 1 , assuming the r-th microphone is selected as the reference. Hence, e r is the r -th column of an identit y matrix, whic h selects the r -th column of R xx corresp onding to this reference microphone. The matrix R xx is unknown, but can be estimated as R xx = R mm − R v v , with R mm the ‘sp eech plus in ter- ference’ auto correlation matrix, equal to E { MM H } when measuring during p erio ds in whic h the attended speaker is activ e. Lik ewise, R v v can b e found as E { MM H } , during p erio ds when the attended sp eaker is silent. All of the men tioned autocorrelation matrices can b e estimated b y means of temp oral av eraging in the short-time F ourier transform domain. Note that more robu st w a ys exist to es- timate R xx , compared to the straightforw ard subtraction describ ed here. The MWF implemen tation we emplo y ed uses a generalized eigenv alue decomp osition (GEVD) to find a rank-1 appro ximation of R xx as in [3]. The rationale b ehind this is that the MWF aims to enhance a single sp eec h source (corresp onding to the attended speaker) while suppressing all other acoustic sources (other sp eech and noise). Since R xx only captures a single sp eec h source, it should hav e rank 1. Applying the MWF corresp onds to computing (14) and p erforming the filtering W H M for each frequency ω j and each time-window in the short-time F ourier domain. Finally , the resulting output in the short-time F ourier domain can b e transformed back to the time domain again. In practice, this is often done using a w eigh ted o verlap-add (W OLA) pro cedure [26]. As mentioned ab ov e, when estimating R xx and R nn from the microphone signals M , we rely on a go o d iden tification of p erio ds or frames in which both (at- tended) speech and interference are present (to estimate the sp eec h-plus-in terference auto correlation R mm ) v ersus p erio ds during whic h only interference is recorded (to estimate the interference-only correlation R v v ). Making this distinction corresp onds to voice activity detection, whic h w e discuss next. D. V oic e activity dete ction (V AD) The short-time energy of a speech signal giv es an indica- tion at what times the target sp eec h source is (in)activ e. A simple voice activity detection (V AD) algorithm consists of thresholding the energy env elope of the target speech signal. Note that in our target application, the sp eech en v elop es are also used for AAD. After applying M-NICA on the microphone env elop es, we find t wo demixed en- v elop es, which serve as b etter estimates of the real sp eech en v elop es. Based on the correlation with the reconstructed en v elop e b s A from the AAD deco der in (6), one of these demixed env elop es will b e identified as the env elop e of the attended sp eech source. This correlation can be computed efficien tly in a recursive sliding-window fashion, to up date the AAD decision o v er time, which is represented by a time-v arying switch in Fig. 1. F or each AAD decision, the c hosen en v elop e segment is then thresholded sample- wise for v oice activity detection. Ideally , the env elop e seg- men ts on which the V AD is applied all originate from the attended env elop e, although sometimes the unattended en v elop e ma y be wrongfully selected, dep ending on the AAD decisions that are made. This will lead to V AD errors, which will ha ve an impact on the denoising and sp eak er extraction p erformance of the MWF. IV. Experiment F or ev ery pair of sp eech sources (1 attended and 1 unattended), we p erformed the following steps: 1) compute the microphone signals, according to (1) 2) find the energy-env elop e of the microphone signals, as describ ed in subsection I I I-A 3) demix the microphone env elop es with M-NICA, as describ ed in subsection I I I-B 4) find the V AD track for the attended sp eech source, as described in subsection II I-D, based on the results of the auditory attention task describ ed in IV-B 5) compute the MWF for the attended speech source, as describ ed in subsection I II-C, based on the AAD- selected V AD trac k from step 4 6) filter the microphone signals with this MWF using a W OLA procedure, to enhance the attended sp eech source F urthermore, we also in v estigate the ov erall performance if step 3 is skipp ed, i.e., if we use the plain microphone en v elop es without demixing them with M-NICA. In that case, we man ually pick the tw o microphone env elop es that are already most correlated to either of b oth sp eakers. Note that this is a best-case scenario that cannot b e implemen ted in practice. A. Micr ophone r e c or dings W e syn thesized the microphone arra y recordings using a public database of HRIRs that were measured using six b ehind-the-ear microphones (three microphones p er ear) [18]. Each HRIR represen ts the microphone impulse resp onses for a source at a certain azimuthal angle relativ e 6 to the head orientation and at 3 meters distance from the microphone. The HRIRs were recorded in an anec hoic ro om and had a length of 4800 samples at 48 kHz. As sp eec h sources, w e used Dutch narrated stories (eac h with a length of approximately six minutes and a sampling rate of 44.1 kHz), that previously serv ed as the auditory stim uli in the AAD-exp eriment in [9]. T o determine the robustness of our scheme, we included noise in the acoustic setup. W e synthesize the microphone signals for sev eral sp eak er p ositions, ranging from -90 ◦ to 90 ◦ . The bac kground noise is formed by adding fiv e uncorrelated m ulti-talk er noise sources n k [ n ] at p ositions − 90 ◦ , − 45 ◦ , 0 ◦ , 45 ◦ and 90 ◦ and at 3 meters distance, eac h with a long-term p ow er P N k = 0 . 1 P s , in whic h P s is the long-term p ow er of a single sp eec h source. Note that these noise sources were not present in the stimuli used in the AAD exp eriment, and are only added here to illustrate the robustness of M-NICA to a possible noise term in (11), and to illustrate the denoising capabilities of the MWF. W e conv olve the tw o sp eech signals and five noise signals with the corresp onding HRIRs to synthesize the microphone signals describ ed in (1). The term v i [ n ] th us represents all noise con tributions and is calculated as P k ( h ik ∗ n k )[ n ], where the five h ik [ n ] are the HRIRs for the noise sources. In our study , w e ev aluate the p erformance for 12 rep- resen tativ e setups with v arying spatial angle b etw een the t w o sp eaker lo cations. T aking 0 ◦ as the direction in front of the sub ject w earing the binaural hearing aids, the angular p osition pairs of the sp eakers are − 90 ◦ and 90 ◦ , − 75 ◦ and 75 ◦ , − 90 ◦ and 30 ◦ , − 60 ◦ and 60 ◦ , − 90 ◦ and 0 ◦ , − 45 ◦ and 45 ◦ , − 90 ◦ and − 30 ◦ , − 60 ◦ and 0 ◦ , − 30 ◦ and 30 ◦ , − 90 ◦ and − 60 ◦ , − 60 ◦ and − 30 ◦ , and − 15 ◦ and 15 ◦ . B. AAD exp eriment The EEG data originated from a previous study [9], in whic h 16 normal hearing subjects participated in an audiologic exp erimen t to inv estigate auditory atten tion detection. In every trial, a pair of competing sp eech stimuli (1 out of 4 pairs of narrated Dutch stories, at a sam- pling rate of 8 kHz) is simultaneously presented to the sub ject to create a cocktail party scenario; the cognitiv e task requires the sub ject to attend to one story for the complete duration of every trial. W e consider a subset of the experiment in [9], in which the presen ted sp eec h stim uli hav e a contribution to each ear - after filtering them with in-the-ear HRIRs for sources at -90 ◦ and 90 ◦ - in order to obtain a dataset of EEG-resp onses that is more represen tativ e for realistic scenarios. That is, b oth ears are presented with a (different) mixture of b oth sp eakers, mimic king the acoustic filtering b y the head as if the sp eak ers were lo cated left and righ t of the sub ject. F or ev ery trial, the recorded EEG is then sliced in frames of 30 seconds, follow ed by the training of the AAD deco der and detection of the attention for every frame, in a leav e-one- frame-out cross-v alidation fashion. W e use the approach of [9], where a single deco der is estimated by computing (9) once o v er the full set of training frames, i.e., a single R T R and R T s A matrix is calculated ov er all samples in the training set. This is opp osed to the metho d in [5], where a deco der is estimated for eac h training frame separately , and the av eraged decoder is then applied to the test frame. In [9], it was demonstrated that this approach is sensitive to a man ually tuned regularization parameter and ma y affect p erformance, which is why we opted for the former metho d. The p erformance of the deco ders depends on the metho d of calculating the env elop e s A of the attended sp eec h stimulus. In [9], it w as found that amplitude en- v elop es lead to better results than energy en velopes. F or the presen t study , we work with energy env elopes (as describ ed in subsection I I I-A) and take the square ro ot to conv ert to amplitude env elopes, when computing the correlation co efficients in the AAD task. The present study inherits the recorded EEG data from the exp erimen t describ ed ab ov e, and assumes that deco ders can b e found during a sup ervised training phase in which the clean sp eech stim uli are known 4 . Throughout our exp eriment, we train the deco ders p er individual sub ject on the EEG data and the corresp onding env elop e segmen ts of the attended sp eech stimuli, calculated by taking the absolute v alue of the original speech signals and filtering b et w een 1 and 9.5 Hz (equiripple finite impulse resp onse filter, -3 dB at 0.5 and 10 Hz). Contrary to [5], atten tion during the trials was balanced ov er b oth ears, so that no ear-sp ecific biasing could o ccur during training of the deco der. The trained deco der can then be used to detect to which sp eak er a sub ject attends, as explained in subsection I I-B. W e p erform the auditory attention detection pro cedure with the same recorded EEG data (using leav e-one-frame- out cross-v alidation) which is fed through the pre-trained deco der, and then correlated with different env elop es to ev en tually p erform the detection ov er frames of 30 seconds. In order to assess the con tribution of the M-NICA algo- rithm to the ov erall p erformance, we consider t wo options: either the tw o demixed env elop es or the tw o microphone en v elop es that hav e the highest correlation with either of the sp eec h sources’ env elop es are correlated to the EEG decoder’s output b s A . The motiv ation for the latter option is that in some microphones, one of b oth sp eec h sources will b e prev alent, and we can tak e the env elop e of such a microphone signal as a (p o or) estimate of the en v elop e of that sp eech source. This will lead to the b est- case p erformance that can b e expected with the use of en v elop es of the microphones, without using an env elop e demixing algorithm. C. Pr epr o c essing and p ar ameter sele ction Sp eec h fragmen ts are normalized o ver the full length to hav e equal energy . All sp eech sources and HRIRs w ere resampled to 16 kHz, after which w e con volv ed them pairwise and added the resulting signals to find the set of microphone signals. 4 Note that in a real device, only one final deco der would need to be av ailable (obtained after a training phase). 7 The windo w length T in (10) is chosen so that the energy en v elop es are sampled at 20 Hz. T o find the short-term amplitude in a certain bandwidth, we take the square ro ot of all energy-like env elopes and filter them b etw een 1 and 9.5 Hz b efore employing them to deco de attention in the EEG ep o chs. Lik ewise, all κ = 64 EEG channels are filtered in this frequency range and down sampled to 20 Hz. As in [5], τ max in (6) is chosen so that it corresponds to 250 ms p oststimulus. F or a detailed o v erview of the data acquisition and EEG deco der training, we refer to [9]. V AD tracks for the env elopes of b oth the attended and unattended sp eech are binary triggers (‘on’ or ‘off’), that are 1 when the energy env elop e surpasses the chosen threshold. The v alue for this threshold w as determined as the one that would lead to the highest median SNR at the MWF output, for a virtual sub ject with an AAD accuracy of 100% and in the absence of noise sources. After ex- haustiv e testing, this v alue was set to 0 . 05 max n b E s o and 0 . 10 max { E m } for the demixed and microphone en v elop es, resp ectiv ely (see subsection V-D). W e form one hybrid V AD track by selecting and concatenating segments of 30 seconds of these t wo initial trac ks, according to the AAD decision that was made in the same 30-second trial of the experiment, as described in subsection IV-B. This corresp onds to a non-ov erlapping sliding window implemen tation with a window length of 30 seconds (note that the AAD decision rate can b e increased b y using an o v erlapping sliding window with a windo w shift that is smaller than the window length). Thus, this o v erall V AD trac k, whic h is an input to the MWF, follo ws the switching b eha vior of the AAD-driven mo dule shown in Fig. 1. The MWF is applied on the binaural set of six micro- phone signals (resampled to 8 kHz, conform to the pre- sen ted stim uli in the EEG experiment), through WOLA filtering with a square-ro ot Hann window and FFT-length of 512. Likewise, the V AD trac k is expanded to match this new sample frequency . F or this initial pro of of concept, b oth M-NICA and the MWF are applied in batch mo de on the signals, meaning that the second-order signal statistics are measured ov er the full signal length. In practice, an adaptive implemen- tation will b e necessary , which is b eyond the scop e of this pap er. How ever, p erformance of M-NICA and MWF under adaptiv e sliding-windo w implemen tations ha v e been rep orted in [24], [26], where a significant - but acceptable - p erformance decrease is observ ed due to the estimation of the second-order statistics ov er finite windows. Therefore, the rep orted results in this pap er should b e in terpreted as upper limits for the ac hiev able performance with an adaptiv e system. F or env elop e demixing, 100 iterations of M-NICA are used. V. Resul ts A. Performanc e me asur es The microphone env elop es at the algorithm’s input ha ve considerable con tributions of b oth speech sources. What is desired - as w ell for the V AD blo ck as for the AAD blo ck - is a set of demixed env elop es that are w ell-separated in the sense that each of them only tracks the energy of a single sp eec h source, and thus has a high correlation with only one of the clean sp eech env elopes, and a low residual correlation with the other clean sp eec h en v elope. Hence, w e adopt the following measure: ∆ r H L is the difference r H − r L b et w een the highest P earson correlation that exists b et w een a demixed or microphone en v elop e and a speech en v elop e and the low est Pearson correlation that is found b et w een any other env elop e and this sp eech en v elope. E.g. for sp eech env elop e 1, if the env elop e of microphone 3 has the highest correlation with this speech env elope, and the env elope of microphone 5 has the lo w est correlation, w e assign these correlations to r H and r L , respectively . F or every angular separation of the tw o speakers, we will consider the a verage of ∆ r H L o v er all speech fragments of all source combinations, and ov er all tested sp eaker setups that correspond to the same separation (see sub- section IV-A). An increase of this parameter indicates a prop er b ehavior of the M-NICA algorithm, i.e., it measures the degree to which the microphone en velopes (‘a priori’ ∆ r H L ) or demixed env elop es (‘a p osteriori’ ∆ r H L ) are separated into the original sp eec h env elop es. Note that for the ‘a priori’ v alue, we select the microphones which already ha ve the highest ∆ r H L in order to provide a fair comparison. In practice, it is not known which microphone yields the highest ∆ r H L ’s, which is another adv an tage of M-NICA: it provides only tw o signals in whic h this measure already maximized. The deco ding accuracy of the AAD algorithm is the p ercen tage of trials that are correctly deco ded. Analogous to the criterion in subsection I I-B, if the reconstructed en v elop e b s A at the output of the EEG decoder is more cor- related with the (demixed or microphone) en v elop e that is asso ciated with the attended sp eech env elop e than with the other en velope, we consider the deco ding successful. Here, we consider a (demixed or microphone) env elop e to b e asso ciated to the attended sp eec h en velope s A if it has a higher correlation with the attended speech env elop e than with the unattended sp eech env elop e. W e ev aluate the p erformance of the MWF b y means of the improv ement in the signal-to-noise ratio (SNR). F or the different setups of speech sources, w e compare the SNR in the microphone with the highest input SNR to the SNR of the output signal of the MWF, i.e. SNR in = max i ( k x i 1 k 2 2 k x i 2 + v i k 2 2 ) (15) SNR out = P M i =1 w i ∗ x i 1 2 2 P M i =1 w i ∗ ( x i 2 + v i ) 2 2 (16) where the samples of the signal and noise contributions x i 1 [ n ], x i 2 [ n ], and v i [ n ] from (1) are stack ed in vectors x i 1 , x i 2 , and v i , resp ectiv ely , cov ering the full record- ing length, and w i is the time-domain representation of the MWF w eights for microphone i (where the W OLA 8 0 2 4 6 8 10 12 14 16 0 0.5 1 clean envelope microphone envelope demixed envelope 0 2 4 6 8 10 12 14 16 0 0.5 1 time (s) normalized energy Fig. 2. Effect of M-NICA, shown for a certain time window. T op figure: original sp eec h env elope (black) and microphone env elop e (green). Bottom figure: original speech env elop e (blac k) and demixed env elop e (red). pro cedure implicitly computes the con v olution in (16) in the frequency domain). Note that we again assume that s 1 represen ts the attended sp eech source and s 2 is the in terfering sp eech source, which is why x i 2 is included in the denominator of (15) and (16) as it con tributes to the (undesired) noise p ow er. Since an unequal n um b er of sp eak er setups w ere analyzed at every angular separation, w e will mostly consider median SNR v alues. B. Sp e e ch envelop e demixing T o illustrate the merit of M-NICA as a source separation tec hnique, w e plot the differen t kinds of en v elop es in Fig. 2. In the top figure, the green curv e represents an env elop e of the sp eech mixture as observed by a microphone, while the blac k curv e is the en v elop e of one of the underlying sp eec h sources. The latter is also sho wn in the b ottom figure, together with the corresp onding demixed env elop e (red curve). All env elop es w ere rescaled p ost ho c, b ecause of the am biguity explained in subsection I I I-B. The mi- crophone en v elope has spurious bumps, whic h originate from the energy in the other sp eech source. The demixed en v elop e, on the other hand, is a goo d approximation of the en velope of a single sp eech source. The improv ement of ∆ r H L is shown in Fig. 3, for the noise-free and the noisy case. F or all relative p ositions of the sp eech sources, applying M-NICA to the microphone env elop es gives a substan tial improv ement in ∆ r H L , which indicates that the algorithm ac hieves reasonably go o d separation of the sp eec h env elopes and hence reduces the crosstalk b etw een them. There is a trend of increasing ∆ r H L for sp eech sources that are wider apart. Indeed, for larger angular separation b etw een the sources, the HRIRs are sufficiently differen t due to the angle-dep endent filtering effects of the head, ensuring energy diversit y . The mixing matrix A will then ha ve weigh ts that make the blind source separation problem defined by (11) b etter conditioned. When m ulti- talk er background noise is included in the acoustic scene, ∆ r H L is seen to b e slightly low er, esp ecially for speech sources close together, when the subtle differences in sp eec h attenuation b et w een the microphones are easily mask ed b y noise. 30° 60° 90° 120° 150° 180° 0 0.2 0.4 0.6 0.8 1 angular separation ∆ r HL Influence of M−NICA, in noise−free and noisy case, on ∆ r HL microphone envelopes, noise−free case demixed envelopes, noise−free case microphone envelopes, noisy case demixed envelopes, noisy case Fig. 3. Effect of M-NICA: ∆ r H L for different separation b et ween the speech sources, for microphone and demixed en velopes in the noise- free case (dark and light blue, resp ectively) and microphone and demixed env elopes in the noisy case (yello w and red, resp ectively). C. AAD p erformanc e Fig. 4 shows the av erage EEG-based AAD accuracy o v er all sub jects versus ∆ r H L for different sp eaker separa- tion angles, when the microphone env elop es or demixed en v elop es from the noise-free case are used for AAD. The cluster of p oints b elonging to the demixed env elop es has mov ed to the right compared to the cluster of the microphone en v elopes, conform to what w as sho wn in Fig. 3. Three setups can b e distinguished that ha v e a sub- stan tially low er AAD accuracy and ∆ r H L than the others. T wo of them are setups with a separation of 30 ◦ , while the third one corresp onds to a separation of 60 ◦ . These results are intuitiv e, as the degree of cross-talk is higher when the speakers are lo cated close to eac h other. The sp eakers then hav e a similar energy contribution to all microphones, whic h results in low er quality microphone env elop es for AAD and also aggrav ates the env elope demixing problem, as demonstrated in Fig. 3. Remarkably , despite the substantial decrease in cross- talk due to the env elop e demixing, the av erage deco ding accuracy do es not increase when applying the demixing algorithm, i.e., b oth microphone en velopes and demixed en v elop es seem to result in comparable AAD performance. Ho w ever, it is imp ortant to put this in p ersp ective, as the accuracy measure for AAD in itself is not p erfect (and p ossibly not entirely representativ e) when the clean sp eec h signals are not known. Indeed, a ‘correct’ AAD decision here only means that the algorithm selects the candidate en v elop e that is most correlated to the attended sp eak er, ev en if this candidate env elope still con tains a lot of crosstalk from the unattended sp eaker. Therefore, the v alidity of this measure dep ends on the quality of the candidate en v elop es, i.e., a correct AAD decision according to this principle ma y hav e little or no practical relev ance if the selected candidate env elop e do es not contain a high- qualit y ‘signature’ of the attended sp eech that can even- tually b e exploited in the p ost-pro cessing stage (V AD and MWF) to truly identify or extract the attended speaker. Moreo v er, M-NICA automatically pro duces as many can- didate en v elop es as there are sp eakers, circum ven ting the selection of the optimal microphones that would otherwise b e necessary , as explained in section IV. 9 0 0.1 0.2 0.3 0.4 0.5 0.6 0.7 0.8 0.9 1 75 80 85 90 ∆ r HL decoding accuracy (%) Decoding accuracy vs ∆ r HL demixed envelopes microphone envelopes −90° and −30° −60° and −30° −90° and −60° Fig. 4. A v erage deco ding accuracy ov er sub jects versus ∆ r H L for the t welv e tested sp eaker setups, using microphone env elopes (green) or demixed env elopes (red) from the noise-free case. The combinations of sp eaker positions that lead to the low est performance are indicated. T o further illustrate ho w env elope demixing influences the AAD algorithm, w e sho w in Fig. 5 the correlation of the EEG deco der’s output b s A with the true env elopes (in Fig. 5a), and with the t w o candidate demixed env elop es (in Fig. 5b) as w ell as with the t w o candidate microphone en v elop es (in Fig. 5c). The p oint cloud when using the demixed en v elop es (Fig. 5b) better resembles the p oint cloud based on the clean sp eech env elop es, showing the influence of the demixing pro cess. Ho wev er, it seems that the v ariance is higher, as the demixing is not p erfect. W e observe that the p oint cloud corresp onding to the microphone env elop es (Fig. 5c) is clustered around the main diagonal. Intuitiv ely , this is explained b y the fact that the microphone en v elop es are not y et separated into separate sp eec h env elop es, and hence they hav e a consid- erable mutual resemblance. Finally , w e note that a large v ariability exists in the deco ding accuracy ov er all sub jects, which is illustrated in Fig. 6. It spans a range b etw een 52% and 98%, and pro vides the only sub ject-sp ecific effect on the o v erall p er- formance of our pro cessing sc heme. The decoding accuracy using either microphone en velopes or demixed env elop es is in general lo wer than the p erformance which is obtained using the clean sp eec h env elop es, in an idealized scenario, as exp ected. Again, w e observ e that en v elop e demixing in general does not impro v e nor low er the AAD accuracy , ev en if it raises the ∆ r H L . Ho w ev er, w e restate that the AAD accuracy measure employ ed here is in itself only partially informative. Indeed, this accuracy measure only quan tifies how w ell the AAD algorithm is able to select the en velope with highest correlation with the attended sp eak er, but not ho w well this en velope actually represen ts the attended sp eaker. The latter is imp ortant to also gen- erate an accurate V AD trac k that only triggers when the attended sp eaker is activ e. F or this reason, it is relev ant to include the demixing step in the analysis, as we show in the next subsection. D. Denoising and sp e e ch extr action p erformanc e The median input SNR is shown in Fig. 7, for the differen t angular separations betw een the speakers, and −0.15 −0.1 −0.05 0 0.05 0.1 0.15 0.2 0.25 0.3 0.3 0.2 0.1 0 −0.1 r A r U Correlation with clean envelopes (a) −0.15 −0.1 −0.05 0 0.05 0.1 0.15 0.2 0.25 0.3 −0.1 0 0.1 0.2 0.3 r A r U Correlation with demixed envelopes (b) −0.15 −0.1 −0.05 0 0.05 0.1 0.15 0.2 0.25 0.3 −0.1 0 0.1 0.2 0.3 r A r U Correlation with microphone envelopes (c) Fig. 5. Scatter plot of the correlation co efficients r A and r U of the reconstructed env elop e with the envelopes of the attended and unattended sp eec h, respectively , for all trials from the noise-free case. Every trial corresp onds to one p oint and is correctly deco ded if this point falls b elo w the black decision line r A = r U . The env elop es of the attended and unattended sp eech are either the clean env elopes (a), demixed envelopes (b), or microphone env elopes (c). Note that the latter tw o figures consist of more p oints than the first one, since AAD was p erformed for 12 different sp eak er setups. subject number 1 2 3 4 5 6 7 8 9 10 11 12 13 14 15 16 decoding accuracy (%) 50 60 70 80 90 100 Subject-specific decoding accuracy clean envelopes microphone envelopes demixed envelopes Fig. 6. Sub ject-specific deco ding accuracy using the accuracy with clean env elop es (black line) as a reference. Accuracies obtained by using microphone (green boxplots) or demixed (red b oxplots) env elop es from the noise-free case are shown, over all 12 sp eaker setups. 10 angular separation 30° 60° 90° 120 150° 180 input SNR (dB) -5 0 5 SNR at MWF input noise-free case noisy case Fig. 7. Input SNR tak en from the microphone with highest SNR, in the noise -free case (blue) and the noisy case (red), for all angular separations b etw een the sp eakers. for b oth the noise-free and the noisy case. It is noted that in the noisy scenarios, the inclusion of five uncorrelated noise sources with an energy that is 10% of that of the sp eec h sources, low ers the input SNR with approximately 10 log 10 (5 · 0 . 1) = 3 dB. F or equal-energy sp eech sources that are sufficiently far apart and/or for low noise levels, the input SNR is higher than zero, b ecause in most microphones, one sp eech source is prev alent o v er the other due to head shadow and thus for every sp eech source we can find a microphone signal that gets most of its energy from that particular sp eec h source (recall that the input SNR is defined based on the ‘b est’ microphone). Fig. 8 shows the output SNR for the v arying angular separations b etw een the sp eec h sources, ranging from 30 ◦ to 180 ◦ . Boxplots show the v ariation in MWF p erformance when using the AAD results of each of the 16 sub jects (median subject-sp ecific SNR v alue p er angular separa- tion, i.e., 16 v alues p er b oxplot). First, we in ve stigate the p erformance for acoustic setups without additional noise. The output SNR is muc h higher when computing the AAD/V AD combination based on the demixed env elop es (see Fig. 8a), compared to the SNR when computing the AAD/V AD based on the original microphone env elopes (see Fig. 8b). In the latter case, the p erformance of the MWF drops as the sp eech sources are closer together (smaller angular separation). A similar, but smaller effect is observed for the AAD/V AD based on the demixed en v elop es. Fig. 8c and Fig. 8d show the output SNR in the presence of multi-talk er background noise when using demixed and microphone env elop es, resp ectively . In this case, the SNRs are low er - yet still satisfactory , giv en the sub-zero input SNR - and again the demixed en v elopes are seen to b e the preferred c hoice for use in the V AD. The impro v ement in SNR when choosing demixed en velopes for the AAD/V AD ov er the microphone en v elopes is sig- nifican t, b oth in the noiseless and in the noisy case (p < 10 − 8 , 2-wa y rep eated measures ANOV A). Note that all v ariability in the SNR ov er subjects is purely due to the difference in the deco ding accuracy , as explained in the previous subsection. The blac k square markers in the figures show the output SNR for a virtual sub ject with a deco ding accuracy of 100%. It is seen that the SNR for sub jects with a high deco ding accuracy closely appro xi- mates this ideal p erformance, and sometimes even surpass it (as the env elop es used for V AD are still imp erfect, this is a sto chastic effect). As a measure of robustness, we analyzed ov er which range of V AD thresholds the results w e found are v alid. F rom Fig. 9, we see that the V AD based on demixed env elop es gives rise to a high output SNR ov er a wide range of thresholds. By con trast, when using the microphone env elop es, a low SNR is observ ed for all thresholds. The V AD thresholds to generate the results of Fig. 8 w ere chosen as the optimal v alues found with these curves, and were rep orted in subsection IV-C. VI. Discussion The difference b etw een the SNR at the input and output of the MWF is substantial, demonstrating that MWF denoising can rely on EEG-based auditory attention detection to extract the attended sp eaker from a set of microphone signals. F urthermore, for the first time, the AAD problem is tac kled without use of the clean speech en v elop es, i.e., we only use sp eech mixtures as collected b y the microphones of a binaural hearing prosthesis. This serv es as a first proof of concept for EEG-informed noise reduction in neuro-steered hearing prostheses. Ev en in sev ere, noisy en vironments, subzero input SNRs are b o osted to acceptable levels. This p ositive effect is significan tly lo wer when lea ving out the en v elope demixing step, showing the necessity of source separation tech- niques. Rather than applying expensive conv olutive ICA metho ds on the high-rate microphone signals based on higher-order statistics the M-NICA algorithm op erates in the lo w-rate energy domain and only exploits second-order statistics, which makes it computationally attractive. In fact, we circum ven t an exp ensiv e BSS step on the raw microphone signals by using the fast env elope processing steps and that w a y p ostp one the spatiotemp oral filtering of the set of microphone signals until the multi-c hannel Wiener filter. As opposed to conv olutive ICA metho ds, the MWF only extracts a single sp eaker from a noise bac kground with muc h low er computational complexity and a higher robustness to noise. F rom the results in Fig. 8, w e see that the demixing using M-NICA has a strong p ositiv e effect on the denoising p erformance. Although M-NICA indeed sligh tly impro ves the AAD accuracy , the use of microphone en v elop es without demixing still yields a comparable p erformance, which is remarkable. The main reason for this is that we alwa ys compare with microphones whic h already ha v e a high ∆ r H L , i.e., micro- phones in which one of the tw o sp eech sources is already dominan t. Such microphone env elop es with sufficien tly low crosstalk - resulting in an acceptable AAD accuracy - are presen t due to the angle-dep endent atten uation through the head. In practice how ev er, w e do not know which of the microphones pro vide these goo d env elop es, which means that the use of M-NICA is still important to obtain a go o d AAD p erformance, as it requires no microphone selection. F urthermore, based on Fig. 9, M-NICA seems to lead to more robust V AD results b y providing better estimates for 11 0 5 10 15 20 25 30 35 40 30° 60° 90° 120° 150° 180° angular separation output SNR (dB) MWF using demixed envelopes, in noise−free case (a) 0 5 10 15 20 25 30 35 40 30° 60° 90° 120° 150° 180° angular separation output SNR (dB) MWF using microphone envelopes, in noise−free case (b) −5 0 5 10 15 30° 60° 90° 120° 150° 180° angular separation output SNR (dB) MWF using demixed envelopes, in noisy case (c) −5 0 5 10 15 30° 60° 90° 120° 150° 180° angular separation output SNR (dB) MWF using microphone envelopes, in noisy case (d) Fig. 8. Bo xplots of the output SNR o ver all subjects and for different angles of speaker separation, using (a) demixed en v elop es in the noise- free scenario, (b) microphone env elopes in the noise-free scenario, (c) demixed env elop es in the noisy scenario, (d) microphone env elop es in the noisy scenario. All SNR v alues represent the median SNR ov er all pairs of stimuli and p ossibly multiple sp eaker setups, p er combination of sub ject and angular separation. The black squares indicate the output SNR for the ideal case of a sub ject with p erfect AAD, i.e. an accuracy of 100%. the sp eakers’ env elop es, whic h seems to be the main reason for the improv ed output SNR when using the MWF. The p erformance of our algorithm pip eline is seen to b e robust to the relative sp eaker p osition, i.e., ev en for sp eak ers that are close together, the combination of env e- lop e demixing and m ulti-channel Wiener filtering results in satisfactory sp eaker extraction and denoising. The simple V AD sc heme prov ed to b e effectiv e, and is insensitiv e to its threshold setting o v er a wide range. Note that a straigh tforw ard env elop e calculation w as used for AAD, and that more adv anced metho ds for env elop e calculation [9] or for increased robustness in attention detection [27] ma y further increase the accuracy . Also increasing the windo w length (larger than 30s) improv es AAD accuracy , at the cost of a po orer time resolution (the latter is also impro v ed up on in [27]). The MWF p erformance in the case of a p erfectly working AAD (sho wn in Fig. 8) leads us to b elieve in the capabilities of the prop osed pro cessing flo w, esp ecially after incorp oration of exp ected adv ances in AAD metho ds. F uture research should aim at collecting EEG measure- men ts from noisy , m ulti-speaker scenarios ov er different angles to v alidate the prop osed processing for both the AAD and the sp eech enhancemen t on a unified dataset. It should b e in v estigated whether represen tativ e EEG can b e collected in real life using miniature and semi-invisible EEG devices, e.g., based on in-the-ear [13] or around- 0 0.05 0.1 0.15 0.2 0.25 0 5 10 15 20 25 30 35 threshold output SNR (dB) Median SNR at MWF output vs threshold demixed envelopes microphone envelopes Fig. 9. SNR at output of the MWF for thresholds going from 1% to 25% of the maximum short-term energy , using demixed (red) or microphone (green) env elopes. No multi-talk er noise was added, and an idealized AAD track with accuracy of 100% was used. SNRs are given as the median v alue o ver all sub jects and all angular separations between the sp eakers. the-ear EEG [14], and p ossibly combining m ultiple such devices [16]. A study in [10] has demonstrated that a high AAD accuracy can still be obtained with only 15 EEG c hannels, although this study assumed av ailability of the clean sp eech signals. It has to b e inv estigated whether these results still hold in the case where only the speech mixtures are av ailable, as in this pap er. As a next step, we aim to adjust the proposed processing sc heme to an adaptive implemen tation, which would b e suitable for online, real-time applications. 12 VI I. Conclusion W e hav e shown that our proposed algorithm pip eline for EEG-informed sp eech enhancemen t or denoising yields promising results in a tw o-sp eaker environmen t, even in conditions with substan tial levels of noise. Our tec hnique is extensible to multi-speaker scenarios, and except for an initial training phase, the algorithm op erates solely on the microphone recordings of a hearing prosthesis, i.e., without knowledge of the clean speech sources. W e ha v e demonstrated that, although the AAD p erformance decreases, the AAD-informed MWF is still able to extract and denoise the attended sp eak er with a satisfactory output SNR. All of the elementary building blo cks, p er- forming speech en v elope demixing, voice activity detec- tion, sp eec h filtering, and auditory attention detection, are computationally inexp ensiv e and are implemen table in real-time. This renders them very attractive for use in battery-p ow ered hearing prostheses which hav e sev ere constrain ts on energy usage. With this study , w e made the first attempt to bridge the gap b etw een auditory atten tion detection in ideal scenarios with access to clean sp eec h en velopes, and neuro-steered attended speech en- hancemen t in situations that are more representativ e for real life environmen ts (without access to the clean sp eech en v elop es). A cknowledgements The authors would like to thank Neetha Das and W outer Biesmans for providing the exp erimen tal EEG data and their help with the implemen tation of the AAD algorithm, and Joseph Szurley for the help with the implementation of the MWF. References [1] H. Dillon, He aring aids . Thieme, 2001. [2] S. Doclo and M. Moonen, “GSVD-based optimal filtering for single and m ultimicrophone sp eech enhancement,” Signal Pr o- c essing, IEEE T r ansactions on , vol. 50, no. 9, pp. 2230–2244, 2002. [3] R. Serizel et al. , “Low-rank approximation based multic hannel Wiener filter algorithms for noise reduction with application in cochlear implants,” A udio, Sp e ech, and L anguage Pro c essing, IEEE/A CM T r ansactions on , vol. 22, no. 4, pp. 785–799, 2014. [4] S. Doclo et al. , “Reduced-bandwidth and distributed MWF- based noise reduction algorithms for binaural hearing aids,” A udio, Sp e ech, and L anguage Pr o c essing, IEEE T r ansactions on , vol. 17, no. 1, pp. 38–51, 2009. [5] J. A. O’Sulliv an et al. , “Attentional selection in a cocktail part y environmen t can b e deco ded from single-trial EEG,” Cer ebr al Cortex , p. bht355, 2014. [6] N. Ding and J. Z. Simon, “Emergence of neural encoding of auditory ob jects while listening to comp eting sp eakers,” Pr o- c e e dings of the National A c ademy of Scienc es , v ol. 109, no. 29, pp. 11 854–11 859, 2012. [7] E. M. Z. Golumbic et al. , “Mechanisms underlying selective neuronal trac king of attended speech at a “co cktail party”,” Neur on , vol. 77, no. 5, pp. 980–991, 2013. [8] N. Mesgarani and E. F. Chang, “Selective cortical represen- tation of attended sp eaker in multi-talk er sp eech p erception,” Natur e , vol. 485, no. 7397, pp. 233–236, 2012. [9] W. Biesmans et al. , “Aud itory-inspired sp eech env elope ex- traction metho ds for improv ed EEG-based auditory attention detection in a cocktail party scenario,” IEEE T ransactions on Neur al Systems and R ehabilitation Engineering , vol. PP , no. 99, pp. 1–1, 2016. [10] B. Mirko vic et al. , “Deco ding the attended speech stream with multi-c hannel EEG: implications for online, daily-life applica- tions,” Journal of neur al engine ering , vol. 12, no. 4, p. 046007, 2015. [11] A. Aroudi et al. , “Auditory attention deco ding with EEG recordings using noisy acoustic reference signals,” in Ac oustics, Sp e e ch and Signal Pr oc essing (ICASSP), 2016 IEEE Interna- tional Confer enc e on . IEEE, 2016. [12] V. Miha jlovic et al. , “W earable, wireless EEG solutions in daily life applications: what are we missing?” Biome dic al and He alth Informatics, IEEE Journal of , vol. 19, no. 1, pp. 6–21, 2015. [13] D. Lo oney et al. , “The in-the-ear recording concept: User- centered and wearable brain monitoring,” Pulse, IEEE , vol. 3, no. 6, pp. 32–42, 2012. [14] M. G. Bleic hner et al. , “Exploring miniaturized EEG electro des for brain-computer interfaces. an EEG you do not see?” Physi- olo gic al rep orts , vol. 3, no. 4, p. e12362, 2015. [15] J. J. Norton et al. , “Soft, curved electrode systems capable of integration on the auricle as a persistent brain–computer interface,” Pro ce e dings of the National A c ademy of Scienc es , vol. 112, no. 13, pp. 3920–3925, 2015. [16] A. Bertrand, “Distributed signal pro cessing for wireless EEG sensor networks,” Neur al Systems and Rehabilitation Engine er- ing, IEEE T r ansactions on , vol. 23, no. 6, pp. 923–935, Nov 2015. [17] A. J. Casson et al. , “W earable electro encephalography ,” Engi- ne ering in Me dicine and Biolo gy Magazine, IEEE , v ol. 29, no. 3, pp. 44–56, 2010. [18] H. Kayser et al. , “Database of multic hannel in-ear and b ehind- the-ear head-related and binaural room impulse resp onses,” EURASIP Journal on Advanc es in Signal Pr o c essing , vol. 2009, p. 6, 2009. [19] A. Bertrand and M. Mo onen, “Energy-based multi-speaker voice activity detection with an ad ho c microphone array ,” in Pr o c. IEEE Int. Conf. A c oustics, Spe ech, and Signal Pr oc essing (ICASSP) , Dallas, T exas USA, March 2010, pp. 85–88. [20] S. J. Aiken and T. W. Picton, “Human cortical resp onses to the speech env elop e,” Ear and he aring , vol. 29, no. 2, pp. 139–157, 2008. [21] B. N. Pasley et al. , “Reconstructing speech from human audi- tory cortex,” PL oS-Biolo gy , vol. 10, no. 1, p. 175, 2012. [22] N. Ding and J. Z. Simon, “Neural co ding of contin uous speech in auditory cortex during monaural and dic hotic listening,” Journal of neur ophysiology , vol. 107, no. 1, pp. 78–89, 2012. [23] J. R. Kerlin et al. , “Atten tional gain control of ongoing cortical speech representations in a “co c ktail party”,” The Journal of Neur oscienc e , vol. 30, no. 2, pp. 620–628, 2010. [24] A. Bertrand and M. Mo onen, “Blind separation of non-negative source signals using m ultiplicative up dates and subspace projec- tion,” Signal Pr o c essing , vol. 90, no. 10, pp. 2877–2890, 2010. [25] S. Chouv ardas et al. , “Distributed robust lab eling of audio sources in heterogeneous wireless sensor netw orks,” in A c oustics, Sp e e ch and Signal Pr oc essing (ICASSP), 2015 IEEE Interna- tional Confer enc e on . IEEE, 2015, pp. 5783–5787. [26] A. Bertrand et al. , “A daptive distributed noise reduction for speech enhancement in wireless acoustic sensor net works,” in Pr o c. of the International W orkshop on A coustic Echo and Noise Contr ol (IW AENC) , T el A viv, Israel, August 2010. [27] S. Akram et al. , “Robust deco ding of selective auditory attention from meg in a comp eting-sp eaker en vironment via state-space modeling,” Neur oImage , vol. 124, pp. 906–917, 2016.
Original Paper
Loading high-quality paper...
Comments & Academic Discussion
Loading comments...
Leave a Comment