A Convolutional Neural Network for the Automatic Diagnosis of Collagen VI related Muscular Dystrophies
The development of machine learning systems for the diagnosis of rare diseases is challenging mainly due the lack of data to study them. Despite this challenge, this paper proposes a system for the Computer Aided Diagnosis (CAD) of low-prevalence, co…
Authors: Adrian Bazaga, M`onica Roldan, Carmen Badosa
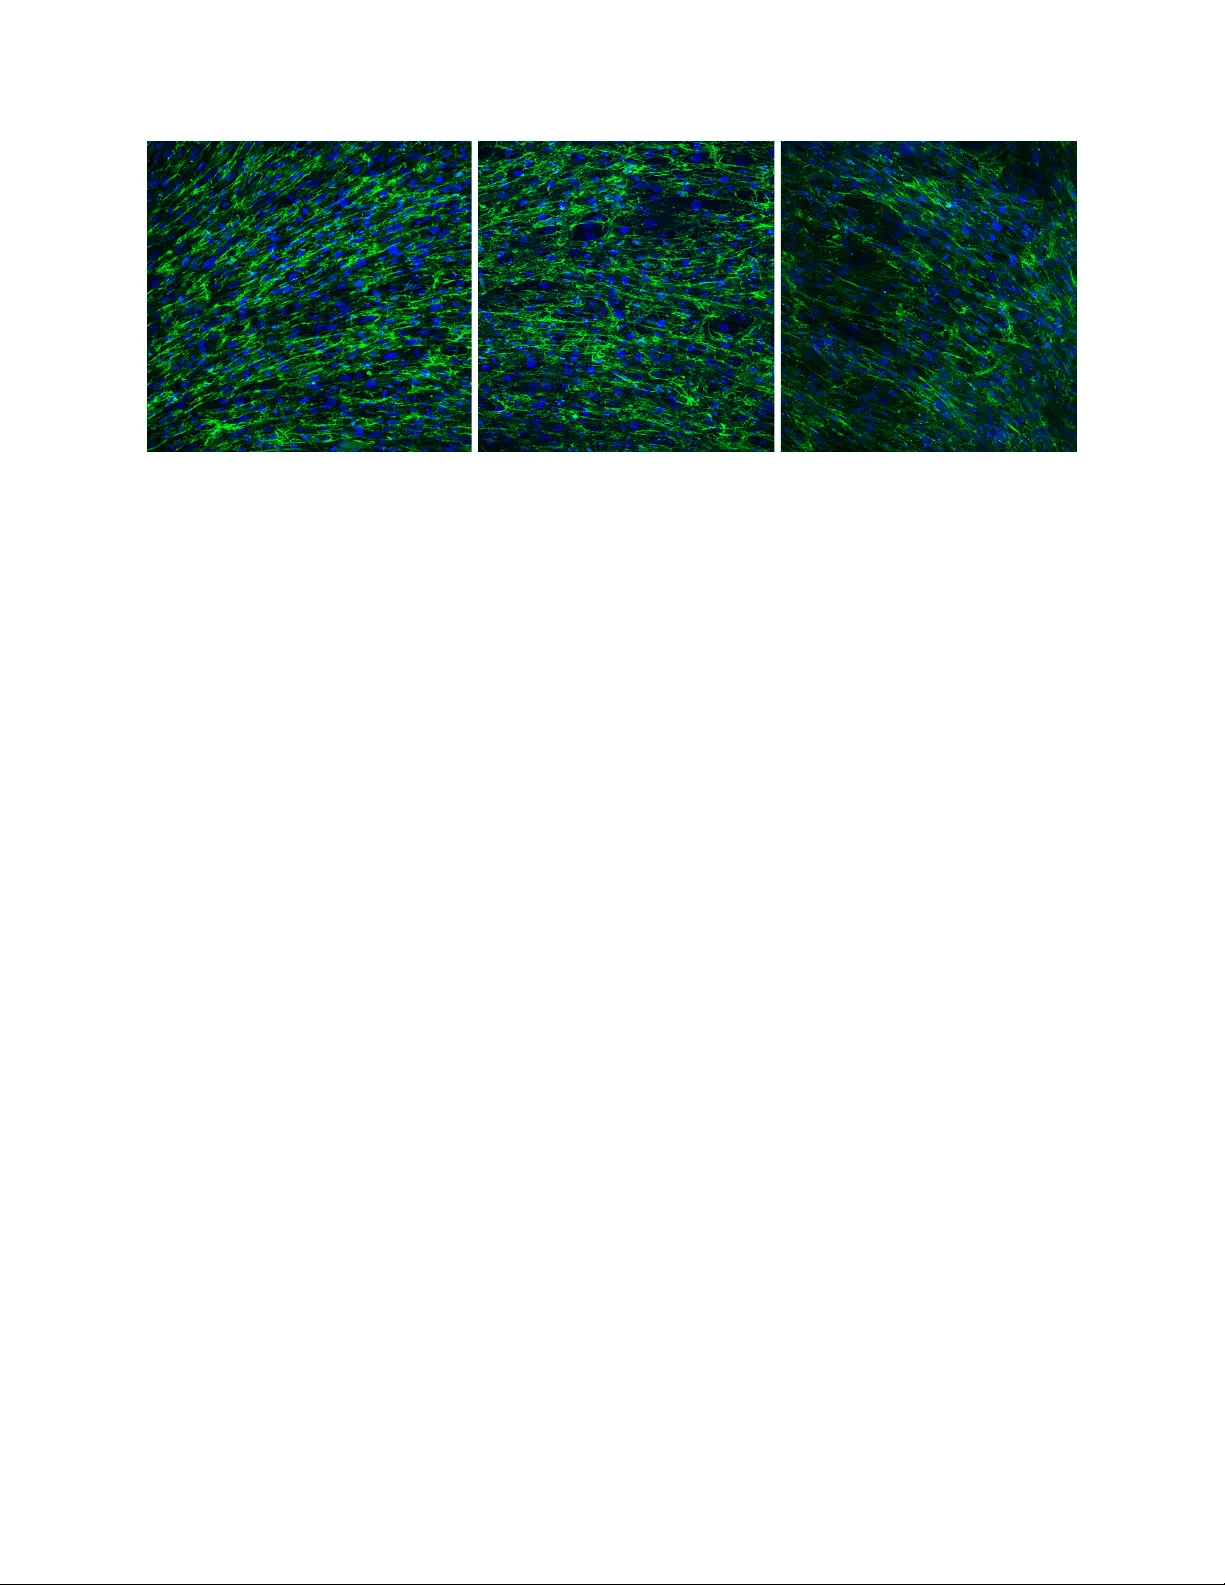
A Con v olutional Neural Net w ork for the Automatic Diagnosis of Collagen VI related Muscular Dystrophies Adri´ an Bazaga a , M` onica Rold´ an b , Carmen Badosa c , Cecilia Jim ´ enez-Mallebrera c, ∗ , Josep M. P orta a, ∗ a Institut de R ob` otic a i Inform` atic a Industrial, UPC-CSIC, 08028 Bar c elona, Sp ain b Unitat de Micr osc` opia Confo c al, Servei d’Anatomia Patol` ogic a, Institut Pe di` atric de Malalties R ar es, Hospital de Sant Jo an de D´ eu, 08950 Barc elona, Sp ain c Hospital de Sant Jo an de D´ eu, 08950 Bar c elona, Sp ain Abstract The developmen t of machine learning systems for the diagnosis of rare diseases is challenging mainly due the lac k of data to study them. Despite this challenge, this pap er prop oses a system for the Computer Aided Diagnosis (CAD) of low-prev alence, congenital muscular dystrophies from confo cal microscopy images. The prop osed CAD system relies on a Con v olutional Neural Netw ork (CNN) which performs an indep endent clas- sification for non-ov erlapping patches tiling the input image, and generates an ov erall decision summarizing the individual decisions for the patc hes on the query image. This decision sc heme p oints to the possibly prob- lematic areas in the input images and provides a global quan titative ev aluation of the state of the patients, whic h is fundamental for diagnosis and to monitor the efficiency of therapies. Keywor ds: Con volutional neural netw orks, Deep learning, Classification, Computer aided diagnosis, Confo cal microscopy images, Collagen VI related muscular dystrophies. 1. In tro duction Deficiencies in the structure of collagen VI are a common cause of neuromuscular diseases with man- ifestations ranging from the Bethlem my opath y to the severe Ullric h congenital muscular dystrophy . The symptoms include pro ximal and axial m uscle weakness, distal h yp erlaxity , joint con tractures, and critical res- piratory insufficiency , which requires assisted ven tilation and results in a reduced live exp ectancy . Moreov er, the skin and other connective tissues where collagen VI is abundant are also affected [1, 2]. The collagen VI structural defects are related to m utations of three main genes (COL6A1, COL6A2, and COL6A3, OMIM 254090 and 158810). Thus, the new adv ances in genome editing tools open the possibility to successfully treat these neuromuscular diseases for the first time. This opp ortunity , though, comes with imp ortan t challenges. Bey ond the challenges of gene editing, this pap er fo cuses on the challenges arising when trying to formally ev aluate the efficiency of the therap eutic approaches in the reco very of the collagen VI microfibrillar net work. ∗ Corresponding authors. Email addr esses: arodriguezb@iri.upc.edu (Adri´ an Bazaga), mroldanm@sjdhospitalbarcelona.org (M` onica Rold´ an), mcbadosa@fsjd.org (Carmen Badosa), cjimenezm@fsjd.org (Cecilia Jim´ enez-Mallebrera), porta@iri.upc.edu (Josep M. Porta) Pr eprint submitted to Exp ert Systems With Applications F ebruary 1, 2019 Figure 1: Confocal microscopy images of fibroblast cultures. Left: A control sample. Center: Sample from a patient with the Bethlem my opathy . Right: Sample from a patient of the Ullrich muscular dystrophy . In the three images, the netw ork of collagen is shown in green and the fibroblast nuclei in blue. Despite the implementation of next generation of gene sequencing, the diagnosis of rare diseases remains c hallenging. This is particularly true for diseases caused b y dominan t m utations where there is not a complete absence of a main protein and when the effect of a genetic v arian t on the protein structure ma y not be eviden t. Th us, prior to genetic analysis or to demonstrate the pathogenicit y of nov el m utations, the standard tec hnique for the diagnosis of collagen VI related dystrophies is the analysis of images of fibroblast cultures [3] (see Fig. 1). Sev eral aspects of the images suc h as the orien tation of the collagen fib ers, the regularit y of the collagen netw ork, and the arrangement of cells in suc h netw ork are taken in to account by the sp ecialists to iden tify the patients. Ho wev er, this ev aluation is only qualitativ e and the regulatory agencies w ould not appro ve any treatmen t without an ob jectiv e pro of of its effectiveness [4]. Thus, there is an acute need of accurate metho dologies to quantitativ ely monitor the effects of any p ossible new therapy . This pap er proposes a computer aided diagnosis (CAD) system for dystrophies caused b y defects in the structure of collagen VI. The system uses a Con volutional Neural Net work (CNN) to classify fibroblast culture images from possible patients. The CNN is trained from cases lab eled by specialists but, as in the case of all rare diseases, there is a severe lack of training data. T o address this issue, this pap er uses a patc h-based data-augmen tation technique similar to the one prop osed in [5]. This pap er is structured as follows: Section 2 frames the con tribution of this pap er in the con text of CAD systems using medical images and Section 3 in tro duces the basic elemen ts defining a CNN. Then, Section 4 describ es in detail the prop osed system, Section 5 discusses the image acquisition and the data augmentation sc heme, and Section 6 prese n ts the results. Finally , Section 7 concludes the paper and p oints to issues deserving further atten tion. 2 2. Related work The automatic analysis of medical images is typically divided in t wo steps. In the first one, relev an t features are extracted from the image. In the second step, those features are used to ev aluate a particular function that in our case is the classification b et ween control and patien t images. Sev eral methodologies hav e been prop osed to iden tify relev an t features in medical images. F or instance, in [6] a multi-scale Gaussian filterbank is used to find p erturbations in chest X-ra y images. How ever, in our case, the disease causes a global disorganization of the collagen net work, rather than lo cal p erturbations on it. In [7] the authors use a principal comp onen t analysis technique to extract relev ant features from an X-ray image. These features, how ev er are linearly related to the input image and such a simple transformation is not lik ely to provide relev ant features in our case. In other approaches, Localy Binary P atterns (LBP) [8], completed LBP [9], gra y-level co-o ccurence matrices [10], or Artificial Neural Netw orks (ANNs) [11] hav e been also used to obtain features, all on input images significantly different from the ones av ailable in our case. In works more related to the problem considered in this pap er, some systems hav e b een prop osed to extract features from collagen images, such as the distribution of the fibers orien tation [12]. How ever, in our case, this distribution is only w eakly related with the diagnostic, since some patients present coherently-orien ted collagen netw orks (see Fig. 1-center). The same weak relation o ccurs with other p ossible features such as the a verage intensit y of the collagen netw ork, or the presence of collagen precipitates in the images. Thus, in the addressed problem, the selection of relev ant features for the diagnostic is a challenge on itself. Nev ertheless, assuming that relev ant features can be somehow iden tified, a classical approac h would apply a classification method relying on them. Since there is not a single method adequate for all problems, differen t classifiers hav e b een used on features extracted from medical images, including naive Bay es classifiers for the detection of brain tumors [13], supp ort v ector machines for the classification of pigmented skin lesions [14] and breast cancer [15], random forests for the diagnosis of tub erculosis [16], non-parametric approac hes to iden tify patients with diab etic retinopathy pathology [17], and Conv olutional Neural Netw orks (CNNs) for the detection of melanoma or glaucoma [18, 19]. In [20] some of these approaches are compared on histopathological breast cancer images, which are similar to the images considered in this pap er, and they conclude that non-parametric approac hes and CNNs pro vide the best results. CNNs are an evolution of the classical ANNs. How ever, there exists t wo main differences b etw een ANNs and CNNs. First, CNNs are in v ariant to translations of the features in the image due to shared parameters b et ween the image conv olutions. Second, new types of lay ers app ear in the CNNs such as the so called max-p ooling lay ers, which enlarge the receptiv e fields of the conv olutions and also con tribute to the translation inv ariance. Suc h improv emen ts, together with the a v ailability of sp ecialized hardware and softw are for training CNNs hav e established them as the de-facto standard tool for image processing, pro vided that enough training data is av ailable. An additional adv antage of the CNNs is that they can directly op erate on images, taking care of b oth identifying relev ant features and p erforming the classification relying on them [21, 22]. This is the fundamen tal reason to apply them to the problem addressed in this pap er. 3 3. Preliminaries on CNNs A CNN is composed by a set of lay ers of simple computational elemen ts, called neurons, connected to elemen ts in the previous la yers. The la yers are ev aluated in sequence, from the input to the output. The computation elements are pre-defined and fixed and, thus, the parameters enco ding the learned function are the w eights asso ciated with the connections in the netw ork. Three different kinds of lay ers are typically present in a CNN: conv olutional lay ers, p o oling lay ers, and fully connected la yers [23]. Con volutional lay ers extract features applying a conv olutional kernel all ov er the input image. F ormally , each kernel is computed as y = N X n =1 I n k n , (1) where I n is a pixel in the image, k n is n -th k ernel w eight, and N is the k ernel size, i.e., the amount of pixels in the image affected by the kernel. Conv olutions are typ ically applied on squared areas around selected pixels in the input image and, thus, the result of this op eration, is a new image, Y , which is called a feature map. Often, the output of a k ernel is passed through an activ ation function. F or instance, in our approach, each k ernel is follow ed by a rectified linear unit (ReLU) activ ation function, f ( x ) = 0 x < 0 x x ≥ 0 . (2) whic h eliminates negative inputs, introducing non-linearities in the CNN with a low computational cost. The horizon tal/vertical distance (in pixels) b etw een the centers of tw o consecutive kernels is known as the stride of the k ernel. Strides larger than one are typically used to downsample a feature map. Alternativ ely , the p ooling lay ers down-sample the input by summarizing a patch in the image with a single v alue. F or instance, in our w ork we use the max-p o oling op eration, where the output is the maximum of the inputs. Finally , the fully-connected lay ers are typically placed at the end of the net work and they provide the classification decision by applying an activ ation function. In our case, we use the sigmoid activ ation function σ ( x ) = 1 1 + e − x , (3) where x is a w eighted sum of inputs and where the output is a num b er b etw een 0 and 1. As depicted in Fig. 2, a CNN learns comparing its outputs with the ones given in a labeled dataset. Sp ecifically , w e wan t to make the output o i and the target t i to b e as similar as p ossible for each input instance i = 1,..., n , where n is the num b er of instances. More formally , w e wan t to minimize the error E = 1 2 n X i =1 || o i ( W ) − t i || 2 , (4) with W the weigh ts in the CNN determining the output. The weigh ts are initialized with random v alues and they are up dated with a gradient descent rule as W = W − α ∂ E ∂ W , (5) 4 Forward pass Error backpropagation INPUT P A TCH Convolution Kernels Kernels Feature Maps (Y) W 1 Max Pool W 2 Fully Connected Figure 2: Process of training of a CNN using backpropagation. A forward pass through the CNN calculates the activ ations of neurons. The error b etw een the output and the known ground-truth is sent back through the CNN to compute the gradient of the error with resp ect to the w eights ( W 1 and W 2 in this illustration). Then, gradient de scen t is used to up date the weigh ts. where α is the learning rate determining the intensit y of the gradient descen t during training. The backprop- agation algorithm [24] is an efficien t w ay to compute the gradient of the error with resp ect to the w eights and it is the approac h used in this work. F or binary classification tasks, the a v ailable training data is split in tw o sets: a training set typically con taining ab out 80% of the data and a test set. A particular batc h of training inputs is used at each iteration and the pro cess is rep eated until all the training inputs are used. The iteration ov er all the av ailable training set is known as an ep o c h. After each ep o ch, the p erformance of the CNN is ev aluated using a v alidation set including 10% of the training data. Finally , after training for a certain num b er of ep ochs, the CNN generalization capabilit y is ev aluated using the testing set, that was not used for training. The ev aluation with a v alidation and a testing set reduces ov erfitting, that is a ma jor issue happening when a CNN p erfectly classifies the training data, but is unable to correctly classify unseen cases. Dropout is another mechanism to prev ent ov erfitting [25]. With this mechanism, some neurons are deactiv ated with a given probability . These elements do not participate in the activ ation of p osterior neurons nor in the error correction, i.e., they are virtually remov ed from the CNN. The b enefit is that the net work b ecomes less sensitiv e to the sp ecific weigh ts. 5 Module 1 CROP IMAGE IN P ATCHES Input Image Module 2 Module 3 Module 4 CLASSIFY EACH P ATCH WITH THE CNN MAJORITY VOTING VISUALIZA TION Figure 3: Overview of the prop osed automatic diagnosis system using a ma jority voting on the individual patches decisions of the CNN mo del. The system also provides a detailed visualization of the diagnosis. Class: Control. Control class probability: 95.7% Figure 4: Visualization of the diagnosis of a given fibroblast culture image. Each patch of the image is colored according to its probability of b elonging to the control class. The system also gives an ov erall score computed as the percentage of patches classified as control in the image. 4. The prop osed system Figure 3 pro vides a global view of the proposed CAD system. The system is divided in four mo dules. The first mo dule receiv es a full image and splits it into non-o verlapping patches of 64x64 pixels. The second mo dule is formed b y the CNN classification mo del, that receives the patc hes and outputs an indep enden t prediction for each one of them. The third mo dule receives the local decisions for each patch and takes a global decision using ma jority voting. The last mo dule visualizes the input image, the decision for each patc h represented in a color co de, and the ov erall decision of the system (see Fig. 4). Cy an is used to frame patc hes with more than 90% probability of b elonging to the control class, steel blue is used for patches with probabilit y betw een 70% and 90%, y ellow for patches with probability b et w een 50% and 70%, orange for patc hes with probability b etw een 30% and 50%, and finally red for patches with less than 30% of probability of b elonging to the control class. This color co de offers the p ossibilit y of easily sp otting suspicious areas in the image. The system also provides the ov erall decision on the image and a global score computed as the p ercen tage of patches classified as control in the image. This score enables to track the evolution of a patient and, th us, it offers a to ol to assess whether or not a particular treatment is effective. 6 T able 1: The details of the CNN architecture proposed in this pap er. La yer T yp e Num b er of neurons (output la yer) Kernel size Stride 1 Con volution 64x64x128 3x3 1 2 Max P o oling 32x32x128 2x2 2 3 Con volution 32x32x64 3x3 1 4 Max P o oling 16x16x64 2x2 2 5 Con volution 16x16x32 3x3 1 6 Max P o oling 8x8x32 2x2 2 7 F ully Connected 150 - - 8 F ully Connected 2 - - Layer1 C O N V R e L U N O R M A L I Z E M A X P O O L Layer3 C O N V R e L U M A X P O O L Layer5 C O N V R e L U M P Layer7 F C R e L U Layer8 F C S I G Image patch Layer6 Layer4 Layer2 Figure 5: The prop osed CNN mo del architecture The core comp onen t in the prop osed approach is the CNN mo del used to classify the image patches. W e exp erimen tally identified a CNN arc hitecture suitable for the addressed problem. In this experimental selection tw o concepts w ere considered: the size of the net work (with small/large n umber of con volution k ernels) and the abstraction lev el (with increasing/decreasing sizes of the subsequent la yers of the CNN). Exp erimen tally , small CNNs with decreasing num b er of features provided the b est results. A key feature in such architectures, is that man y lo w-level features are learned on the first lay ers and few high-level dis- criminating features of the images are generated in deep er lay ers. The proposed arc hitecture is detailed in T able 1 and is similar to the one in [5], whic h has already b een prov en to b e particularly adequate for image classification. Ho wev er, our netw ork is smaller since the classification task address ed here is simpler than the one addressed in [5]. Figure 5 pro vides a detailed ov erview of the CNN arc hitecture proposed in this pap er. The input image patc h is normalized in order to ha ve zero mean and unit v ariance. Normalization improv es the gradient descen t pro cess and av oids its premature con v ergence. The normalized image patch is passed through three con volutional lay ers (lay ers 1, 3, and 5) which include the application of ReLU activ ation functions after the k ernel computation. The first conv olution lay er defines 128 feature maps of size 64x64, the second one defines 64 feature maps of size 32x32, and the last one defines 32 feature maps of size 16x16. The reduction in the size of the feature maps is obtained with max-p o oling lay ers (lay ers 2, 4, and 6) with a stride of 2 follo wing the conv olution lay ers. After the feature generation la yers, the classification is implemented with 7 t wo fully-connected la y ers (lay ers 7 and 8). The first one has 150 neurons, also follow ed by a ReLU activ ation function trained with a drop out mechanism with probability 0.5. The second fully connected lay er has 2 neurons whose output is truncated into a single binary output by a sigmoid activ ation function to provide the final classification. 5. Data acquisition and augmentation Samples from the forearm were obtained from possible patients with as well as from aged-matc hed con- trols. Primary fibroblasts cultures w ere established using standard pro cedures [3]. Confluen t fibroblasts (patien t and con trol in parallel) were treated with 25 µ g/mL of L-ascorbic acid phosphate magnesium (W ako Chemicals GmbH, Neuss, Germany) for 24 hours. After that time, cells w ere fixed with 4% paraformalde- h yde in phosphate-buffered saline solution. Collagen VI was detected b y indirect immunofluorescence using a mono clonal antibo dy (MAB1944, Merck, Germany) as previously describ ed in [3] and fibroblast nuclei were stained using 4,6-diamidino-2-phen ylindole (Sigma Chemical, St. Louis, USA). The images w ere acquired with a Leica TCS SP8 X White Ligh t Laser confo cal microscop e with hybrid sp ectral detectors (Leica Microsystems, W etzlar, Germany). The confo cal images were acquired using a HC x PL APO 20x/0.75 dry ob jectiv e and with the confo cal pinhole set to 1 Airy unit. Collagen VI was excited with an argon laser (488 nm) and detected in the 500-560 nm and n uclei were excited with a blue dio de laser (405 nm) and detected in the 420–460 nm. Appropriate negative controls were used to adjust confo cal settings to av oid non-sp ecific fluorescence artifacts. The detector gain and offset v alues were adjusted to use the entire dynamic rate of the detector (12 bits) and to a void o v ersaturated v oxels. Sequential acquisition settings were used to av oid inter-c hannel cross-talk. T en sections of each sample were acquired every 1.5 µ m along the fo cal axis (Z-stack) and combined into an integrated intensit y pro jection to form a single image. Since the data acquisition pro cedure is complex and we are dealing with a rare disease, the av ailable data is limited. Thus, w e prop ose a data augmentation scheme inspired in the one described in [5] to generate enough inputs to train the CNN. The data is augmented by splitting the given full size images into small, non-ov erlapping patc hes. Eac h patc h is used as an indep enden t input to train the CNN mo del. In our approach, the patch is of size 64x64 pixels since it has b een shown to b e a particularly relev ant windo w size for CNN classification mo dels on similar images [26]. In our case, the patches capture the main features of the input images, i.e., a significant p ortion of the collagen netw ork and sev eral nuclei or parts of them. Since our input images are of 1024x1024 pixels, 256 patc hes p er image are generated. Each patch is further transformed to get even more v ariations of the data: They are rotated clo c kwise b y 90, 180, 270 and 360 degrees and every rotated patc h is flipp ed horizon tally . Thus, eight differen t v ariations of each original patch can b e obtained and, consequently , each input image generates 2048 training inputs for the CNN. Since initially we hav e 276 images, with this data augmentation pro cess, the training and testing sets include, respectively , 56320 and 14336 patches, without taking in to accoun t the rotated and mirrored patc hes. 8 Figure 6: Confusion matrix of the test set for the m odel trained with the 64x64 image patches. 6. Results and discussion The proposed system w as implemen ted using the Python programming language and the Keras 2.2 library with T ensorFlow 0.19 bac k end and it was executed on a workstation with a In tel Core i7-7700HQ pro cessor and 16 GB of RAM. All the pro cessing w as p erformed in a NVIDIA GeF orce GTX 1050 GPU. The batc h size is set to 32 and the training is executed while the performance of the classification of the test set impro ves. On a verage, eac h epo ch to ok ab out 14 min utes to complete and less than 10 epo chs are necessary to con verge. F or training the neural netw ork we use the Adam [27] optimizer, with a learning rate of α = 0 . 01, an exp onential deca y rate for the first moment estimates of β 1 = 0 . 9, an exp onential deca y rate for the second moment estimates of β 2 = 0 . 999, and = 10 − 8 to prev ent any division by zero. W e present results at tw o different levels. The first level is the p er-patc h p erformance of the CNN mo del and the second is the p erformance of the prop osed system on full images, by using ma jorit y voting. In this w ay , we ev aluate how the mo del performs using only local features (patches) and ho w it impro ves when in tegrating lo cal results to take a global decision (full images). Figure 6 giv es the confusion matrix of the system diagnosing on 64x64 patches on the test set. In this confusion matrix, the amount of patc hes correctly and incorrectly classified as b elonging to the control class are in the first row. F rom a total of 8115 control patc hes in the test set, 7585 are true negatives ( t n ), i.e., the inputs correctly classified as control and 530 are false p ositiv es ( f p ), i.e., the inputs incorrectly classified as patien t. The classification of patients is given in the second row, where, 102 are false negatives ( f n ), i.e., the inputs incorrectly classified as control, and 6119 are true p ositives ( t p ), i.e., the inputs correctly classified as 9 T able 2: The p erformance of the proposed systems on the test set. System Size A P R F 1 P atch 64x64 0.95 0.92 0.98 0.95 Image 1024x1024 1 1 1 1 patien t. In the ma jority v oting system the accuracy is p erfect and, thus, the confusion matrix is trivial and not giv en here. T able 2 gives the p erformance ev aluation metrics for eac h of the analyzed lev els. The accuracy , A , precision, P , recall, R , and F 1 score are used to assess the classification p erformance. The accuracy , A = t p + t n t p + f p + t n + f n , (6) refers to the correct classification rate, defined as the ratio of correctly classified cases with resp ect to the total n umber of cases. The precision, P = t p t p + f p , (7) is the ratio of inputs correctly classified as patien t with resp ect to the total n um b er of inputs (correctly or incorrectly) classified a patien t. The recall, R = t p t p + f n , (8) giv es the ratio of samples correctly classified as patient with resp ect to total inputs that are actually in the patien t class. Finally , the F 1 metric F 1 = 2 P R P + R , (9) is the w eighted harmonic mean of precision and recall. A t the level of patch classification, the system achiev es an accuracy of 0.95, a precision of 0.92, and a recall of 0.98. Consequen tly , the prop osed system attains a F 1 score of 0.95. A t the level of images, the system ac hieves p erfect classification results. CNNs can pro vide very accurate results, but they are often seen as black b o xes since it is hard to find out what are the features and the classification criteria learned from the data. How ever, recent works try to in terpret the CNNs after the training phase [28]. F ollo wing this approach, we provide a visualization of t w o relev ant parts of the CNN. First, Fig. 7 shows the contribution of each pixel in the image to the classification as con trol class. The net work fo cus on the fibroblast nuclei and on the regions without collagen VI. Note that the intensit y on the later is low er, but their extension is larger and, th us its actual con tribution to the classification is also significant. In second term, Fig. 8 shows the saliency maps of the conv olutional la yers with resp ect to the patien t class, where the saliency is the gradient of the output with resp ect to the corresp onding conv olutional la yer. At early lay ers, the net work learns to detect low level features, such as the presence of fibroblasts or the lack of collagen VI, confirming the previous analysis. In p osterior lay ers, the features b ecome more abstract and, thus, more difficult to relate with elements in the input images. 10 Figure 7: Left: Visualization of an image patch. Right: The saliency map with respect to the control class (in red the pixels with higher contribution to the classification). Figure 8: Visualization of the activ ation of each conv olutional lay er with resp ect to the patient class. 7. Conclusions This pap er describ es a system for the computer aided diagnosis of muscular dystrophies caused by defi- ciencies in the structure of collagen VI. The prop osed system relies on a deep conv olutional neural netw ork and on a data augmentation scheme to handle the problem of lack of data typical of rare diseases. The prop osed system is capable of achieving p erfect results in the diagnosis task in the a v ailable testing set. This pro vides a solid to ol to automatically and accurately trac k the effect of p otential therapies for the recov ery of collagen VI in patients. F urthermore, we visualized the contribution of each pixel to the classification as well as the features learned by the CNN in each con v olutional lay er by means of saliency maps. This iden tifies the primary features disco vered b y the CNN. Our current researc h endeav ours fo cus on extending this analysis to clarify the abstract features and the classification criteria identified by the prop osed CNN. Moreov er, we are studying the p ossible application of image-based computer aided diagnosis pro cedures to other rare diseases related to deficiencies in collagen VI or other extra-cellular matrix proteins. 11 Ethics Statement This study was carried out in accordance with the recommendations of the F undaci´ on Sant Joan de D´ eu Ethics Committee. W ritten informed consent was obtained from patients and/or their parents or guardians in accordance with the Declaration of Helsinki. The proto col was approv ed b y the F undaci´ on Sant Joan de D ´ eu Ethics Committee. Ac kno wledgements Adri´ an Bazaga was supp orted b y a JAE-in tro sc holarship gran ted b y the Sp anish Council of Scientific R ese ar ch . Josep M. Porta is funded by the Spanish Ministry of Economy and Comp etitiveness under pro ject DPI2017-88282-P . Cecilia Jim´ enez-Mallebrera and Carmen Badosa are funded b y the Health Institute ’Carlos I I I’ (ISCII I, Spain) and the Europ ean Regional Developmen t F und (ERDF/FEDER), ’A wa y of making Europ e’, grants references PI16/00579, CP09/00011 and F undaci´ on No elia. Author Contributions Adri´ an Bazaga – Conceptualization; Inv estigation; F ormal analysis; Metho dology; Soft ware; V alidation; Visualization; W riting - original draft; W riting - review & editing. M` onica Rold´ an – Data curation; Resources; W riting - original draft; W riting - review & editing. Carmen Badosa – Data curation; W riting - review & editing. Cecilia Jim´ enez-Mallebrera – Data curation; Resources; W riting - original draft; W riting - review & editing. Josep M. Porta – Conceptualization; F ormal analysis; Metho dology; Supervision; F unding acquisition; W riting - original draft; W riting - review & editing. References [1] A. Nadeau, M. Kinali, M. Main, C. Jimenez-Mallebrera, A. Aloysius, E. Clemen t, B. North, A. Y. Manzur, S. A. Robb, E. Mercuri, F. Muntoni, Natural history of Ullric h congenital m uscular dystrophy, Neurology 73 (1) (2009) 25–31. URL https://doi.org/10.1212/WNL.0b013e3181aae851 [2] S. R. Lamand ´ e, J. F. Bateman, Collagen VI disorders: Insights on form and function in the extracellular matrix and b ey ond, Matrix Biology 71-72 (2018) 348–367. URL https://doi.org/10.1016/j.matbio.2017.12.008 12 [3] C. Jimenez-Mallebrera, M. Maioli, J. Kim, S. Brown, L. F eng, A. Lamp e, K. Bushb y , D. Hicks, K. Flani- gan, C. Bonnemann, C. Sewry , F. Muntoni, A comparative analysis of collagen vi pro duction in muscle, skin and fibroblasts from 14 Ullrich congenital m uscular dystroph y patients with dominan t and recessive col6a m utations, Neuromuscular Disorders 16 (9) (2006) 571–582. URL https://doi.org/10.1016/j.nmd.2006.07.015 [4] K. An thony , V. Arec ha v ala-Gomeza, L. E. T aylor, A. V ulin, Y. Kaminoh, S. T orelli, L. F eng, N. Janghra, G. Bonne, M. Beuvin, R. Barresi, M. Henderson, S. Lav al, A. Lourbak os, G. Campion, V. Straub, T. V oit, C. A. Sewry , J. E. Morgan, K. M. Flanigan, F. Muntoni, Dystrophin quantification, Neurology 83 (22) (2014) 2062–2069. URL https://doi.org/10.1212/WNL.0000000000001025 [5] A. Krizhevsky , I. Sutskev er, G. E. Hinton, Imagenet classification with deep conv olutional neural net- w orks, in: Proceedings of the 25th International Conference on Neural Information Processing Systems - V olume 1, 2012, pp. 1097–1105. URL http://dl.acm.org/citation.cfm?id=2999134.2999257 [6] A. M. Schilham, B. v an Ginneken, M. Lo og, A computer-aided diagnosis system for detection of lung no dules in c hest radiographs with an ev aluation on a public database, Medical Image Analysis 10 (2) (2006) 247–258. URL https://doi.org/10.1016/j.media.2005.09.003 [7] M. M. Adankon, J. Dansereau, H. Lab elle, F. Cheriet, Non in v asive classification system of scoliosis curv e types using least-squares supp ort vector machines, Artificial Intelligence in Medicine 56 (2) (2012) 99–107. URL https://doi.org/10.1016/j.artmed.2012.07.002 [8] T. Ahonen, A. Hadid, M. Pietik ainen, F ace description with lo cal binary patterns: Application to face recognition, IEEE T ransactions on Pattern Analysis and Machine Intelligence 28 (12) (2006) 2037–2041. URL https://doi.org/10.1109/TPAMI.2006.244 [9] Z. Guo, L. Zhang, D. Zhang, A completed modeling of lo cal binary pattern operator for texture classi- fication, IEEE T ransactions on Image Pro cessing 19 (6) (2010) 1657–1663. URL https://doi.org/10.1109/TIP.2010.2044957 [10] L.-K. Soh, C. Tsatsoulis, T exture analysis of SAR sea ice imagery using gray lev el co-occurrence matrices, IEEE T ransactions on Geoscience and Remote Sensing 37 (2) (1999) 780–795. URL https://doi.org/10.1109/36.752194 [11] A. Khatami, A. Khosravi, T. Nguyen, C. P . Lim, S. Nahav andi, Medical image analysis using wa v elet transform and deep b elief netw orks, Exp ert Systems with Applications 86 (2017) 190–198. URL https://doi.org/10.1016/j.eswa.2017.05.073 13 [12] M. Sun, A. B. Blo om, M. H. Zaman, Rapid quantification of 3D collagen fib er alignmen t and fib er in tersection correlations with high sensitivity, PLOS ONE 10 (7) (2015) e0131814. URL https://doi.org/10.1371/journal.pone.0131814 [13] M. M. Subashini, S. K. Saho o, V. Sunil, S. Easwaran, A non-in v asive metho dology for the grade iden- tification of astro cytoma using image pro cessing and artificial intelligence techniques, Exp ert Systems with Applications 43 (2016) 186–196. URL https://doi.org/10.1016/j.eswa.2015.08.036 [14] M. E. Celebi, H. A. Kingravi, B. Uddin, H. Iyatomi, Y. A. Aslandogan, W. V. Stoeck er, R. H. Moss, A metho dological approach to the classification of dermoscop y images, Computerized Medical Imaging and Graphics 31 (6) (2007) 362–373. URL https://doi.org/10.1016/j.compmedimag.2007.01.003 [15] J. Nahar, T. Imam, K. S. Tic kle, A. S. Ali, Y.-P . P . Chen, Computational in telligence for microarray data and biomedical image analysis for the early diagnosis of breast cancer, Exp ert Systems with Applications 39 (16) (2012) 12371–12377. URL https://doi.org/10.1016/j.eswa.2012.04.045 [16] A. M. Shabut, M. H. T ania, K. T. Lwin, B. A. Ev ans, N. A. Y usof, K. J. Abu-Hassan, M. Hossain, An in telligent mobile-enabled exp ert system for tub erculosis disease diagnosis in real time, Exp ert Systems with Applications 114 (2018) 65–77. URL https://doi.org/10.1016/j.eswa.2018.07.014 [17] R. V enk atesan, P . S. Chandakk ar, B. Li, Simpler non-parametric metho ds pro vide as go od or b etter results to multiple-instance learning, in: IEEE In ternational Conference on Computer Vision (ICCV), 2015, pp. 2605–2613. URL https://doi.org/10.1109/ICCV.2015.299 [18] A. Menegola, M. F ornaciali, R. Pires, S. E. F. de Avila, E. V alle, T o wards automated melanoma screening: Exploring transfer learning sc hemes, CoRR abs/1609.01228. . URL [19] M. V. dos Santos F erreira, A. O. de Carv alho Filho, A. D. de Sousa, A. C. Silv a, M. Gattass, Con vo- lutional neural net work and texture descriptor-based automatic detection and diagnosis of glaucoma, Exp ert Systems with Applications 110 (2018) 250–263. URL https://doi.org/10.1016/j.eswa.2018.06.010 [20] P . Sudharshan, C. Petitjean, F. Spanhol, L. E. Oliv eira, L. Heutte, P . Honeine, Multiple instance learning for histopathological breast cancer image classification, Exp ert Systems with Applications 117 (2019) 14 103–111. URL https://doi.org/10.1016/j.eswa.2018.09.049 [21] Y. Lecun, L. Bottou, Y. Bengio, P . Haffner, Gradient-based learning applied to document recognition, Pro ceedings of the IEEE 86 (11) (1998) 2278–2324. URL https://doi.org/10.1109/5.726791 [22] K. Simony an, A. Zisserman, V ery deep conv olutional netw orks for large-scale image recognition, CoRR abs/1409.1556. . URL [23] I. Go o dfello w, Y. Bengio, A. Courville, Deep Learning, MIT Press, 2016. URL https://www.deeplearningbook.org [24] S. Hung, H. Adeli, Parallel bac kpropagation learning algorithms on CRA Y Y-MP8/864 sup ercomputer, Neuro computing 5 (6) (1993) 287–302. URL https://doi.org/10.1016/0925- 2312(93)90042- 2 [25] N. Sriv astav a, G. Hinton, A. Krizhevsky , I. Sutskev er, R. Salakhutdino v, Dropout: A simple w ay to prev ent neural netw orks from ov erfitting, Journal of Machine Learning Research 15 (2014) 1929–1958. URL http://jmlr.org/papers/v15/srivastava14a.html [26] F. A. Spanhol, L. S. Oliveira, C. P etitjean, L. Heutte, Breast cancer histopathological image classification using con volutional neural netw orks, in: International Joint Conference on Neural Netw orks (IJCNN), 2016, pp. 2560–2567. URL https://doi.org/10.1109/IJCNN.2016.7727519 [27] D. P . Kingma, J. Ba, Adam: A metho d for sto chastic optimization, CoRR abs/1412.6980. arXiv: 1412.6980 . URL [28] K. Simony an, A. V edaldi, A. Zisserman, Deep inside conv olutional netw orks: Visualising image classifi- cation mo dels and saliency maps, CoRR abs/1312.6034. . URL 15
Original Paper
Loading high-quality paper...
Comments & Academic Discussion
Loading comments...
Leave a Comment