MS-UNIQUE: Multi-model and Sharpness-weighted Unsupervised Image Quality Estimation
In this paper, we train independent linear decoder models to estimate the perceived quality of images. More specifically, we calculate the responses of individual non-overlapping image patches to each of the decoders and scale these responses based o…
Authors: Mohit Prabhushankar, Dogancan Temel, Ghassan AlRegib
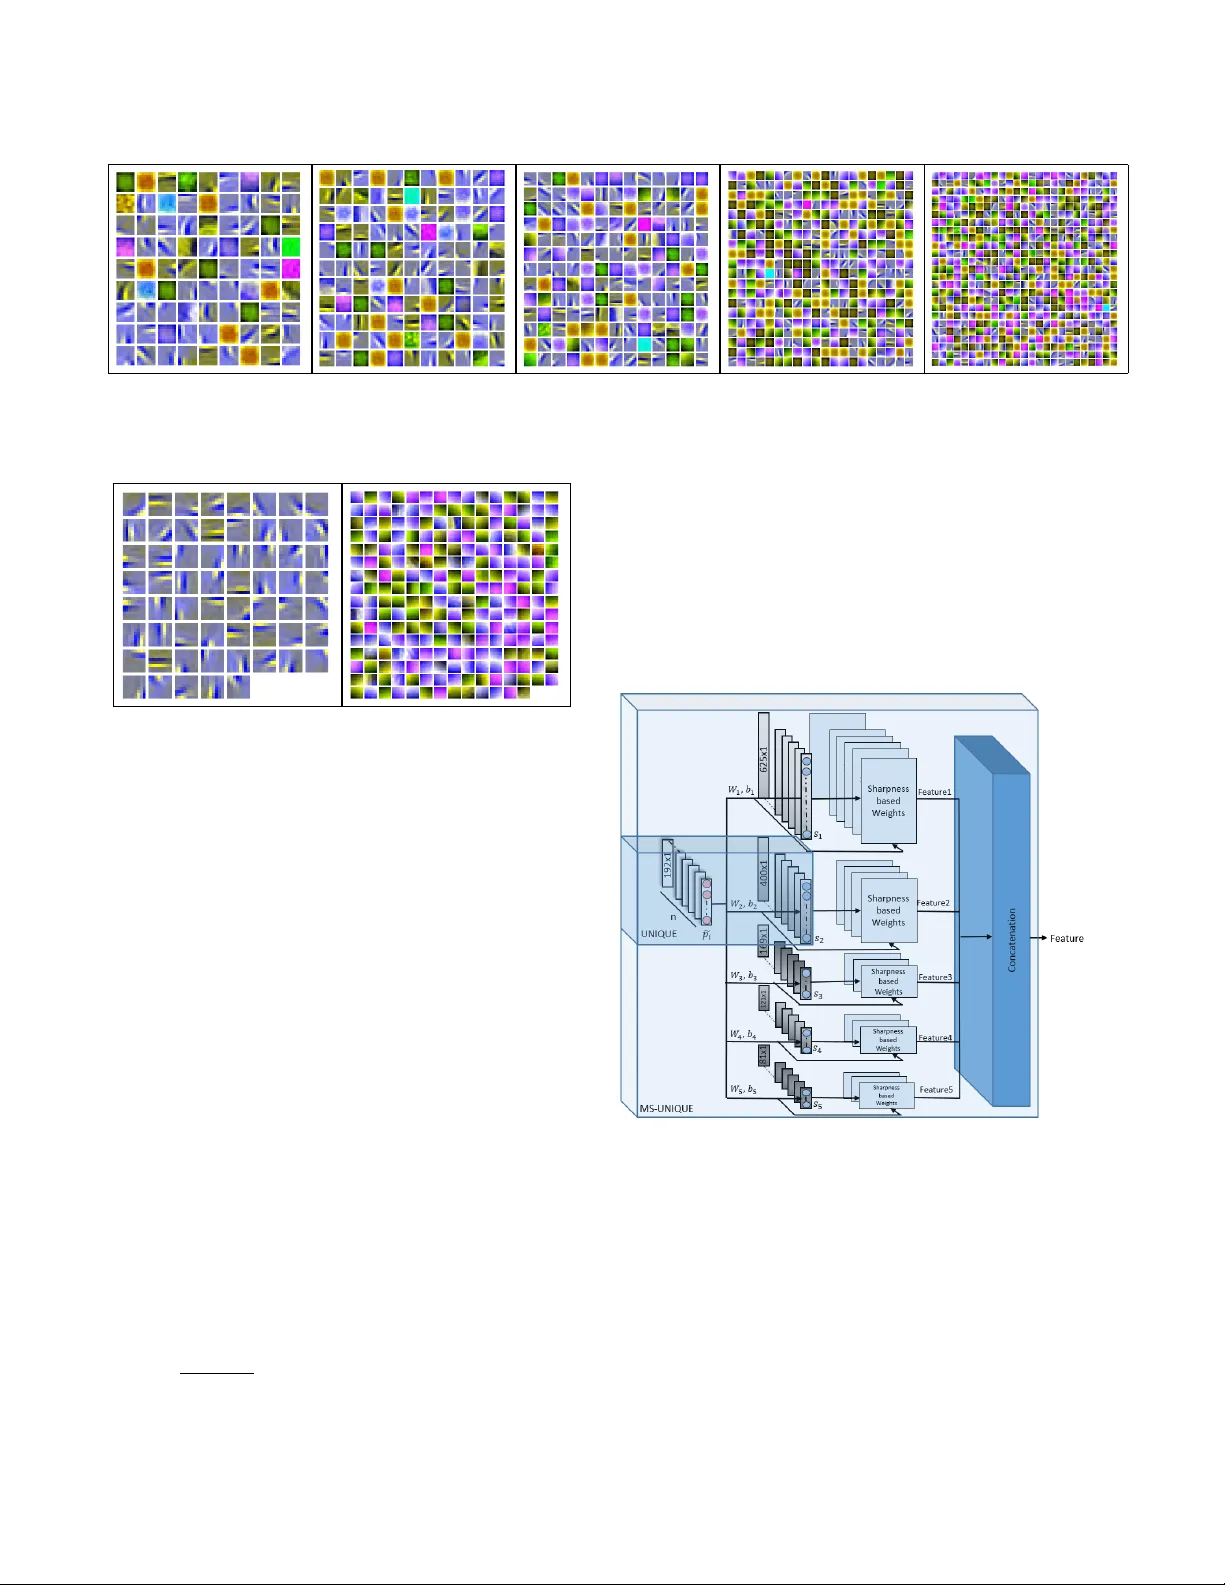
Citation M. Prabhushankar , D. T emel, and G. AlRegib, MS-UNIQUE: Multi-model and Sharpness-weighted Unsu- pervised Image Quality Estimation, the Electronic Imaging, Image Quality and System Performance XIV , Burlingame, California, USA, Jan. 29 Feb . 2, 2017. DOI https://doi.org/10.2352/ISSN.2470- 1173.2017.12.IQSP- 223 Review Publication date: January 29, 2017 Code/Slides https://ghassanalregib.com/publications/ Bib @article { T emel2017 EI, title = ”MS-UNIQUE: Multi-model and Sharpness-weighted Unsupervised Image Quality Estimation”, journal = ”Electronic Imaging”, year = ”2017”, number = ”12”, publication date =”2017-01-29T00:00:00”, pages = ”30-35”, itemtype = ”AR TICLE”, issn = ”2470-1173”, eissn = ”2470-1173”, url = ”https://www .ingentaconnect.com/content/ist/ei/2017/00002017/00000012/art00006”, doi = ”doi:10.2352/ISSN.2470-1173.2017.12.IQSP-223”, author = ”Prabhushankar , Mohit and T emel, Dogancan and AlRegib, Ghassan”, } Contact alregib@gatech.edu https://ghassanalregib.com/ dcantemel@gmail.com http://cantemel.com/ MS-UNIQUE: Multi-model and Sharpness-weighted Unsuper - vised Image Quality Estimation Mohit Prabhushankar 1 , Dogancan T emel 1 , Ghassan AlRegib 1 ; 1 Center f or Signal and Information Processing, School of Electrical and Computer Engineering, Georgia Institute of T echnology , Atlanta, GA Abstract In this paper , we train independent linear decoder models to estimate the per ceived quality of images. Mor e specifically , we calculate the r esponses of individual non-overlapping image patches to each of the decoders and scale these responses based on the sharpness characteristics of filter set. W e use multiple lin- ear decoders to capture differ ent abstr action levels of the image patches. T raining each model is carried out on 100,000 image patches from the ImageNet database in an unsupervised fash- ion. Color space selection and ZCA Whitening ar e performed over these patches to enhance the descriptiveness of the data. The pr oposed quality estimator is tested on the LIVE and the TID 2013 image quality assessment databases. P erformance of the pr oposed method is compared against eleven other state of the art methods in terms of accuracy , consistency , linearity , and monotonic behavior . Based on experimental r esults, the pr oposed method is generally among the top performing quality estimators in all cate gories. Introduction W ith the advent of social media and faster wireless netw orks, high quality digital images are one of the most popular forms of multimedia being shared online. Infact, on an average day , bil- lions of photos are shared through dedicated platforms. It is es- sential for these platforms to maintain high standards in acquir - ing, compressing, transmitting, and displaying these images with- out compromising it’ s visual quality to the end user . Such a task cannot be manually performed due to it’s mechanical and time consuming nature and the sheer volume of data in volv ed. The goal of image quality assessment (IQA) is to automate this pro- cess by de veloping objecti ve quality estimators that can predict subjectiv e scores. In other words, the perceived quality of im- ages is measured objectiv ely . Based on the availability of orig- inal distortion free images, image quality assessment algorithms are classified into three categories. Full-Reference (FR) metrics require the original image for predicting the quality of distorted image [4, 10, 11, 12, 13, 14, 15, 16]. No-Reference (NR) met- rics estimate the quality of a distorted image without requiring access to the corresponding original image [18, 19, 20]. Reduced- Reference metrics require a few feature sets extracted from the original image for quality prediction of the distorted image. In the proposed work, we focus on e xtending a FR model that we proposed in [1] which was based on a data dri ven approach. Data driven approaches are not uncommon in IQA litera- ture. The authors in [17] propose MLIQM, a metric that bene- fits from the already present IQA theory to construct features, and apply SVM classification to understand the quality class. Then a SVM regression is used to estimate the quality of a distorted image within that quality class. The authors in [18] apply a pre- training step in which they distort high quality images and feed them into their deep network to train a model that predicts the subjectiv e score. The authors in [19] propose an image quality as- sessment approach based on learning a set of filters through Sup- port V ector Regression. The weights of SVR are learnt through a Stochastic gradient descent algorithm and their responses are used to estimate quality . In [20], the authors propose an unsu- pervised learning approach to obtain quality-aware filters using distorted images. These filters are used to extract features that are then regressed using a random forest to obtain quality esti- mates. Ho wev er , the common thread in all these algorithms, is the requirement of distorted images and subjective scores during training. In this paper , we explore the combination of unsupervised learning and hand-crafting to extend learning networks to assess quality of images. In [1] we had proposed UNIQUE, a shal- low learning architecture to estimate quality . It had one hid- den layer which was trained using a sparsity criterion where the weights and bias were considered a domain transformation on non-ov erlapping patches of images. This technique outperforms majority of the existing methods in LIVE [8] and TID 2013 [9] databases. It is an unsupervised architecture since it does not re- quire any target labels during the neural network training. Also, there is no need for either subjectiv e scores or distorted images during training. Keeping all these advantages intact, we extend UNIQUE and improv e it’ s performance by analyzing the weights which we learnt, utilizing existing IQA literature that stresses the importance of sharpness in measuring quality [7]. W e also learn multiple self-contained and rev ersible representations of undis- torted data and use these representations to estimate quality of im- ages. W e propose MS-UNIQUE which is a full reference image quality assessment algorithm based on an unsupervised learning approach through distortion-free images. Methodology W e propose learning a set of weights and bias from a linear decoder . Before using the learning framework, we preprocess the data to mak e it more descriptive. The learnt weights from a linear decoder are considered as a filter set which are used to estimate the quality of an image. And if linear decoder models with differ - ent number of neurons in the hidden layer are trained, we obtain a number of filter sets all learning to model the same input using multiple representations. The filters are also made structure aware by differentiating the ones that capture edges from the ones that capture color . Color Space Selection W e use luminance (Y channel) as part of our input data. The human visual system is more sensitive towards changes in inten- sity domain rather than chroma [2]. The authors in [4] claim that structural information can be gleaned from the normalized luma domain. In addition to the Y channel, we use the green channel from RGB color space. Green channel is selected since it contains a large part of the information from R and B color channels. This is verified by measuring the cross correlation between channels of RGB representations - the cross correlation r RG between R and G color channels is 0 . 98 and r GB , between G and B color channels is 0 . 94 [3]. W e augment the Y and the G channels with the Cr chan- nel after a transformation into YCbCr colorspace. This is done to include chroma information as part of our data. The specific plane Cr is chosen ov er Cb based on experimental results. The three planes are combined to obtain a descriptiv e YGCr image. Data Matrix Preparation From the ImageNet 2013 test database, 1 , 000 images are randomly selected during training. W e do not use any annotated metadata associated with the images. Each image is first trans- formed into YGCr colorspace. From each image, we extract 100 patches of size 8x8x3 randomly . Each patch is then reshaped into a 192x1 column vector . The patch vectors from all images are stacked together to get a 192x100000 input patch matrix. The data matrix is then passed through a Zero Component Analysis (ZCA) Whitening algorithm. Whitening is performed to decorrelate ad- jacent pixels in raw data so as to lessen redundancy . The authors in [6] sho w that the HVS performs whitening. Essentially , this con verts the input data with a zero mean covariance matrix into whitened data with an identity cov ariance matrix. The adjacent features in the input matrix are decorrelated and the variance of each is one. ZCA also satisfies the property that the whitening matrix is orthogonal. Note that whitening is not performed on the 100 , 000 patches b ut on the 192 input features in each patch feature vector . Hence, individual pixels inside a patch are decor- related from other pixels in the same patch. This happens over all 100 , 000 patches hence lowering the redundanc y fed into the learning architecture from each feature v ector [5]. W e summarize the data matrix preparation in Figure 1. Figure 1: Data matrix preparation. Linear Decoder A linear decoder is an unsupervised neural network frame- work used to represent data in dif ferent dimensions. In this work, we use a framew ork with only one hidden layer . It can be used to sparsify data or learn a compact representation by changing the number of neurons in the hidden layer . The framework func- tions by transforming the input into hidden layer activ ations or responses and then reconstructing back the input using these re- sponses. T ransformation occurs through a set of weights and bias that are randomly initialized and then adjusted iterativ ely based on the reconstruction error using backpropagation. The hidden layer responses are obtained as s = sigmoid ( W T 1 P + b 1 ) , (1) where s is the response, W 1 and b 1 are the forward weights and bias. Each column in W 1 is a 192x1 vector that filters each patch from the data. Sigmoid is the non-linear layer used in our frame- work. These hidden layer responses are filtered using another set of backward weights W 2 and bias b 2 to obtain back a reconstructed version of the input ˜ P as ˜ P = W T 2 s + b 2 , (2) Note that there is no sigmoid layer after reconstruction. The ob- jectiv e function for backpropagation J ( W 1 , W 2 , b 1 , b 2 ) is gi ven by J ( W , b ) = k ( W T 2 s + b 2 ) − P k 2 2 + β N ∑ j = 1 KL ( ρ || ˆ ρ j ) + λ k W k 2 2 , (3) where the first term is the reconstructed L 2 norm error , the second term is the sparsity penalty term and the third is the weight decay or re gularization term. N is the total number of patches, which amounts to 100 , 000. Sparsity penalty is included to constrain the av erage activ ation of neurons to be close to zero and this penalty is obtained using KL-Diver gence o ver all training patches. ρ is the desired a verage activ ation which is set to 0 . 035. The sparse penalty term goes to 0 when the actual a verage acti vation ˆ ρ comes close to ρ . It is weighted by β which is set to 5. The weight decay term λ , which is set to 3 e − 3 acts as a regularization term by de- creasing the magnitude of weights thereby prev enting overfitting. W e sho w the architecture of a linear decoder in Figure 2 in which Figure 2: Linear decoder architecture h corresponds to the number of neurons in the hidden layers. W e change the number of neurons h to obtain models that can either sparsely or compactly represent the input data. W e visualize the weight sets corresponding to different v alues of h in Figure 3. (a) 81 neurons (b) 121 neurons (c) 169 neurons (d) 400 neurons (e) 625 neurons Figure 3: W eight V isualizations. In each set, each square can be used to infer input patches that maximally activ ate it. Each individual square in all sets is of size 8x8x3 and is scaled here for visualization purposes. (a) Edge Filters (b) Color Filters Figure 4: Result V isualization of differentiating a 625 filter model into edge and color aware filters. Multi-model training The data matrix is fed into a linear decoder model with h = 81 and trained for 400 epochs. The trained forward weights and bias are stored. This step is repeated to obtain weights and bias for h = 121 , 169 , 400 , 625 separately . The sparsity parameter dur- ing training ensures that none of the filters from any model get activ ated abnormally over the others. This multi-model approach ensures that we represent an image patch both sparsely and com- pactly and learn multiple filter sets that combine non-linearly to reconstruct it. Also, a sparse filter set learns more localized fea- tures while a compact set learns global features. Sharpness aware filter s Sharpness is an important determining factor in the percep- tual quality assessment of images [7]. The HVS is adept at detect- ing blur and ev aluating quality based on sharpness. Howev er , our learning frame work does not use an y handcrafted features like in- corporating edges. Hence we add this feature to the already con- structed filter set. W e make our filters sharpness aware by ana- lyzing their descriptiveness and then weighing their responses ac- cordingly . W e gi ve higher importance to filters that capture edges rather than color . Distinguishing filters based on edge charac- teristics is performed using the bias corrected implementation of kurtosis. Kurtosis is defined as, k = E ( x − µ ) 4 σ 4 (4) Hence, further away a data point is from the mean of the distri- bution, larger is it’ s influence on kurtosis. W e theorize that filters that capture edge components consist of more data points that are away from the mean of the o verall data making them outliers. The presence of these outliers giv es a higher kurtosis score to edge filters. The kurtosis of each vectorized, zero centered, and nor- malized filter is measured against a threshold to capture it’ s edge characteristics. Any filter with a kurtosis greater than 5 is labeled as an edge filter while filters with kurtosis less than 2 are labeled as color filters. The results of thresholding on a 625 filter model set is shown in Figure 4. Figure 5: Feature generation Image Quality Assessment W e preprocess images as described previously and utilize the formulation in Eq.1 to obtain filter responses. These responses are weighted based on the sharpness characteristics of corresponding filters. The edge filter responses are given a higher weightage of 2 while the color responses are lowered by a weight of 0 . 5. This is performed for all models to obtain one feature vector per im- age. The feature generation process is summarized in Figure 5. The responses in feature vector that are significantly less than the av erage activ ation value set during training are assigned a zero to mimic the suppression mechanisms in the HVS. W e generate T able 1: Performance of image quality estimators. Methods PSNR PSNR PSNR SSIM MS CW IW SR FSIMc PerSIM UNIQUE MS- HA HMA SSIM SSIM SSIM SIM UNIQUE [10] [10] [4] [11] [12] [13] [14] [15] [16] [1] Outlier Ratio TID13 0.725 0.615 0.670 0.732 0.697 0.855 0.700 0.632 0.727 0.655 0.640 0.611 Root Mean Square Err or LIVE 8.61 6.93 6.58 7.52 7.43 11.2 7.11 7.54 7.20 6.80 6.76 6.61 TID13 0.87 0.65 0.69 0.76 0.68 1.20 0.68 0.61 0.68 0.64 0.60 0.57 Pearson Corr elation Coefficient LIVE 0.928 0.953 0.958 0.945 0.946 0.872 0.951 0.945 0.950 0.955 0.956 0.958 TID13 0.705 0.850 0.827 0.789 0.832 0.227 0.831 0.866 0.832 0.854 0.870 0.884 Spearman Correlation Coefficient LIVE 0.909 0.937 0.944 0.949 0.951 0.902 0.960 0.955 0.959 0.950 0.952 0.949 TID13 0.700 0.847 0.817 0.741 0.785 0.562 0.777 0.807 0.851 0.853 0.860 0.870 T able 2: Distributional difference between subjecti ve scores and objectiv e quality estimates. Metric Difference-LIVE Difference-TID13 EMD KL JS HI L2 EMD KL JS HI L2 PSNR-HMA 0.226 0.205 0.053 0.226 0.066 0.360 0.927 0.117 0.360 0.124 IW -SSIM 0.297 0.325 0.072 0.297 0.076 0.500 1.678 0.196 0.500 0.180 UNIQUE 0.236 0.258 0.055 0.236 0.069 0.386 0.855 0.120 0.386 0.109 MS-UNIQUE 0.209 0.176 0.038 0.209 0.057 0.357 0.734 0.108 0.357 0.103 feature vectors for both reference and distorted images. The fea- ture vectors corresponding to the original and distorted images are compared using 10 t h power of Spearman correlation coefficient to fully utilize quality estimation range. The proposed method is an extension of the quality estima- tor UNIQUE [1] as sho wn in Figure 5. It builds on UNIQUE by weighing filter responses. W e also propose using multiple de- coders with dif ferent number of neurons in the hidden layer to abstract local and global characteristics in image patches. V alidation Database The proposed quality estimator is validated on the LIVE image quality [8] and TID 2013 [9] databases. The databases hav e more than 3500 distorted images between them. These images can be classified into 7 categories based on their dis- tortion types - compression artifacts, image noise, communica- tion errors, blur artifacts, color degradations, global, and local distortions. The compression artifacts category consists of the JPEG and the JPEG2000 compressions, and lossy compressions of noisy images. The noise category includes Gaussian noise and additiv e noise added in color components, spatially correlated noise, masked noise, high frequency noise, impulse noise, quanti- zation noise, image denoising, multiplicati ve Gaussian noise, and comfort noise. The communication errors cate gory includes the JPEG and the JPEG2000 transmission errors of noisy images. The blur artifacts category consists of Gaussian blur, and sparse sam- pling and reconstruction. The color de gradations category contain changes in color saturation, image color quantization with dither , and chromatic aberrations. The global category includes inten- sity shifts, and contrast changes while the local category contains non-eccentricity pattern noise, and local blockwise distortions of different intensities. P erformance Metrics V alidation of MS-UNIQUE and compared algorithms are carried out in terms of root mean square error, outlier ratio, Pear- son and Spearman correlation coefficients. In the outlier ratio calculations, we use those data points that lie two standard de- viations aw ay from the a verage subjecti ve scores. Also, outlier ratio is only reported for TID 2013 database since the standard deviations of subjecti ve scores are not reported in LIVE database. The regression formulation from [8] is used to calculate regress estimates of all methods before comparing. W e report the differ - ence between the normalized histograms of subjective scores and the regressed quality estimates through common histogram differ - ence metrics including Earth Mov ers Distance (EMD), Kullback- Leibler (KL) div ergence, Jensen-Shannon (JS) di vergence, his- togram intersection (HI), and L2 norm. Results The proposed quality estimator is compared ag ainst ele ven other commonly used or state of the art full reference quality assessment methods based on fidelity , perceptually-extended fi- delity , structural similarity , feature similarity , and perceptual sim- ilarity . The performances of all these metrics are summarized in T able 1 with the highest performing metric in each category displayed in bold. PSNR-HMA, IW -SSIM, UNIQ UE, and MS- UNIQUE are among the top performing metrics. MS-UNIQUE outperforms all these estimators in TID13 database among all per- formance metrics. In the LIVE database it consistently performs well in all but tw o of the metrics. IW -SSIM performs better in terms of SR OCC in this database. Howe ver , MS-UNIQUE out- performs IW -SSIM among all the other categories. Both MS- UNIQUE and PSNR-HMA provide similar results in terms of PCC. MS-UNIQUE’ s results for RMSE are slightly lesser than PSNR-HMA. MS-UNIQUE builds on UNIQUE among all cate- gories except in SR OCC in LIVE database. T o better analyze the distribution of subjective scores against (a) LIVE PSNR-HMA (b) TID PSNR-HMA (c) LIVE IW -SSIM (d) TID IW -SSIM (e) LIVE UNIQUE (f) TID UNIQUE (g) LIVE MS-UNIQUE (h) TID MS-UNIQUE Figure 6: Scatter plots of top performing quality estimators the estimated scores, scatter plots of the best performing metrics are shown in Figure 6. The X-axis corresponds to the estimated scores while the Y -axis is the ground truth subjectiv e mean opin- ion scores (MOS) or differential Mean Opinion Scores (DMOS). For an ideal quality estimator, the scatter plot data should fol- low a linear curve with low deviation. This is not observed in PSNR-HMA which shows a parabolic curv e in LIVE database. There is a much sharper drop of f in IW -SSIM with most of the points concentrated on the far end of the curve in LIVE database. UNIQUE and MS-UNIQUE have a far more linear curve with scores extending throughout the range. T o numerically differenti- ate between MS-UNIQUE and other metrics in terms of regressed quality estimates, we present the difference between the normal- ized histograms of ground truths and re gressed results, in T able 2. The best results are highlighted in bold and MS-UNIQ UE con- sistently performs well in both the databases among all compared metrics. Overall, MS-UNIQUE is the best performing metric in 15 out of 17 compared metrics ov er both databases. Conclusion W e proposed an extension to the quality estimator UNIQUE, by analyzing the learning network used and handcrafting a weigh- ing scheme that captures sharpness. This is done in the prepro- cessing and postprocessing blocks by enhancing information ac- quired from the data, analyzing the edge characteristics of learnt filters so that their responses are weighed based on quality as- sessment theory . Multiple models of linear decoders, where the number of hidden layer neurons represent the local or global char- acteristics captured, are used to obtain different levels of abstrac- tion. The performance of MS-UNIQUE shows that performance of metrics that use a data driv en approach can be enhanced by handcrafting features. References [1] D. T emel, M. Prabhushankar, and G. AlRegib, ”UNIQUE: Unsuper- vised Image Quality Estimation, ” in IEEE Signal Processing Letters , vol.23, no.10, pp.1414-1418 [2] V an den Branden Lambrecht, Christian J. ”V ision models and appli- cations to image and video processing” Springer Science and Busi- ness Media, 2013. [3] M. Tkalcic and J. F . T asic, Colour spaces: perceptual, historical and applicational background, in EUR OCON 2003. Computer as a T ool. The IEEE Re gion 8 , Sept 2003, vol. 1, pp. 304308 v ol.1. [4] Z. W ang, A. C. Bovik, H. R. Sheikh, and E. P . Simoncelli, Image quality assessment: from error visibility to structural similarity , IEEE T ransactions on Image Processing, v ol. 13, no. 4, pp. 600612, April 2004. [5] A.Krizhevsky , and Geof frey Hinton. ”Learning multiple layers of fea- tures from tiny images. ” (2009), Appendix A, The ZCA Whitening Algorithm. [6] Y . Dan, J. J. Atick, and R. C. Reid, ”Efficient coding of natural scenes in the lateral ganiculate nucleus: Experimental test of a computational theory”, The Journal of Neuroscience, vol. 16(10), pp. 33513362, 1996. [7] Rania Hassen, Zhou W ang, and Magdy Salama. ”No-reference image sharpness assessment based on local phase coherence measurement. ” 2010 IEEE International Conference on Acoustics, Speech and Signal Processing. IEEE, 2010. [8] H. R. Sheikh, M. F . Sabir, and A. C. Bovik, A statistical ev aluation of recent full reference image quality assessment algorithms, IEEE T ransactions on Image Processing, vol. 15, no. 11, pp. 34403451, Nov 2006. [9] N. Ponomarenk o, L. Jin, O. Ieremeiev , V . Lukin, K. Egiazarian, J. As- tola, B. V ozel, K. Chehdi, M. Carli, F . Battisti, and C.-C. Jay K uo, Im- age database TID2013: Peculiarities, results and perspectiv es , Signal Processing: Image Communication, vol. 30, pp. 57 77, 2015. [10] N. Ponomarenko, O. Ieremeie v , V . Lukin, K. Egiazarian, and M. Carli, Modified image visual quality metrics for contrast change and mean shift accounting, the proceedings of CADSM, 2011. [11] Z. W ang, E. P . Simoncelli, and A. C. Bovik, Multiscale structural similarity for image quality assessment, in Signals, Systems and Computers, 2004. Conference Record of the Thirty-Sev enth Asilo- mar Conference on, Nov 2003, v ol. 2, pp. 13981402 V ol.2. [12] M. P . Sampat, Z. W ang, S. Gupta, A. C. Bovik, and M. K. Markey , Complex wavelet structural similarity: A new image similarity in- dex, IEEE Transactions on Image Processing, vol. 18, no. 11, pp. 23852401, Nov 2009. [13] Z. W ang and Q. Li, IW -SSIM: Information content weighted struc- tural similarity index for image quality assessment, IEEE T ransac- tions on Image Processing, vol. 20, no. 5, pp. 11851198, May 2011. [14] L. Zhang and H. Li, SR-SIM: A Fast and high performance IQA index based on spectral residual, in Image Processing (ICIP), 2012 19th IEEE International Conference on, Sept 2012, pp. 14731476. [15] L. Zhang, L. Zhang, X. Mou, and D. Zhang, FSIM: A Feature sim- ilarity index for image quality assessment, IEEE T ransactions on Im- age Processing, vol. 20, no. 8, pp. 23782386, Aug 2011. [16] D. T emel and G. AlRe gib, PerSIM: Multi-resolution image quality assessment in the perceptually uniform color domain, in Image Pro- cessing (ICIP), 2015 IEEE International Conference on, Sept 2015, pp. 16821686. [17] C. Charrier,O. Lzoray , and G. Lebrun, Machine learning to de- sign full-reference image quality assessment algorithm,Signal Pro- cessing:Image Communication, vol. 27, no. 3, pp. 209 219, 2012. [18] H. T ang, N. Joshi, and A. Kapoor, Blind image quality assess- ment using semi-supervised rectifier networks, in Proceedings of the 2014 IEEE Conference on Computer V ision and Pattern Recognition, W ashington DC, USA, 2014, CVPR 14, pp. 28772884, IEEE Com- puter Society . [19] P . Y e, J. Kumar , L. Kang, and D. Doermann, Real-time no- referenceimage quality assessment based on filter learning, in Pro- ceedings of the 2013 IEEE Conference on Computer V ision and Pattern Recognition, W ashington, DC, USA, 2013, CVPR 13, pp. 987994, IEEE Computer Society . [20] Z. Gu, L. Zhang, X. Liu, H. Li, and J. Lu, Learning quality-aware filters for no-reference image quality assessment, in Multimedia and Expo (ICME), 2014 IEEE International Conference on, July 2014, pp.16. A uthor Biograph y Mohit Prabhushankar r eceived the M.S. degr ee in Electrical and Computer Engineering with a minor in Computer Science fr om Georgia Institute of T echnology , Atlanta, in 2015. Since then, he has been pursuing Ph.D. de gree in the Center for Signal and Information Processing (CSIP), Geor gia Institute of T echnology , USA, as a Researc h Assistant. His r e- sear ch interests include image quality assessment, ima ge denoising and enhancement featur e design thr ough data driven appr oaches. Dogancan T emel r eceived an M.S. de gree with a minor in Manage- ment in 2013, and a PhD degr ee with a minor in Computer Science in 2016 from the school of Electrical and Computer Engineering in Geor- gia Institute of T echnology , Atlanta. While his studies at Georgia T ech, Dr . T emel worked in the Multimedia and Sensors Lab at the Center for Signal and Information Processing as a Graduate Resear ch Assistant and in T exas Instruments as a Systems Engineering intern. Dr . T emel worked on various pr ojects including per ceived image quality assessment, deep learning-based image pr ocessing and computer vision, high color range imaging, vital sign monitoring, computational aesthetics, seis- mic inter- pr etation, 3D reconstruction, str eaming, and quality assessment. Ghassan AlRegib is currently Associate Professor at the School of Electrical and Computer Engineering at the Geor gia Institute of T ech- nology in Atlanta, GA, USA. His resear ch gr oup is working on projects r elated to image and video pr ocessing and communications, immersive communications, collabor ative systems, quality of images and videos, and 3D video pr ocessing. Pr of. AlRegib is a Senior Member of IEEE. Pr of. AlRe gib served as the chair of the Special Sessions Pr ogram at the IEEE International Confer ence on Image Pr ocessing (ICIP) He was the T rack Chair in the IEEE International Confer ence on Multimedia and Expo (ICME) in 2011 and the co-chair of the IEEE MMTC Inter est Gr oup on 3D Rendering, Pr ocessing, and Communications, 2010-present. Pr of. Al- Re gib is a member of the Editorial Board of the W ireless Networks Journal (W iNET), 2009-present. Pr of. AlRe gib co-founded the ICST International Confer ence on Immer sive Communications (IMMERSCOM) and served as the Chair of the first event in 2007. Pr of. AlRegib is the founding Editor-in-Chief (EiC) of the ICST T ransactions on Immersive Communi- cations to be inaugur ated in late 2012. He is also the Chair of the Speech and V ideo Pr ocessing T rack at Asilomar 2012.
Original Paper
Loading high-quality paper...
Comments & Academic Discussion
Loading comments...
Leave a Comment