PerSIM: Multi-resolution Image Quality Assessment in the Perceptually Uniform Color Domain
An average observer perceives the world in color instead of black and white. Moreover, the visual system focuses on structures and segments instead of individual pixels. Based on these observations, we propose a full reference objective image quality…
Authors: Dogancan Temel, Ghassan AlRegib
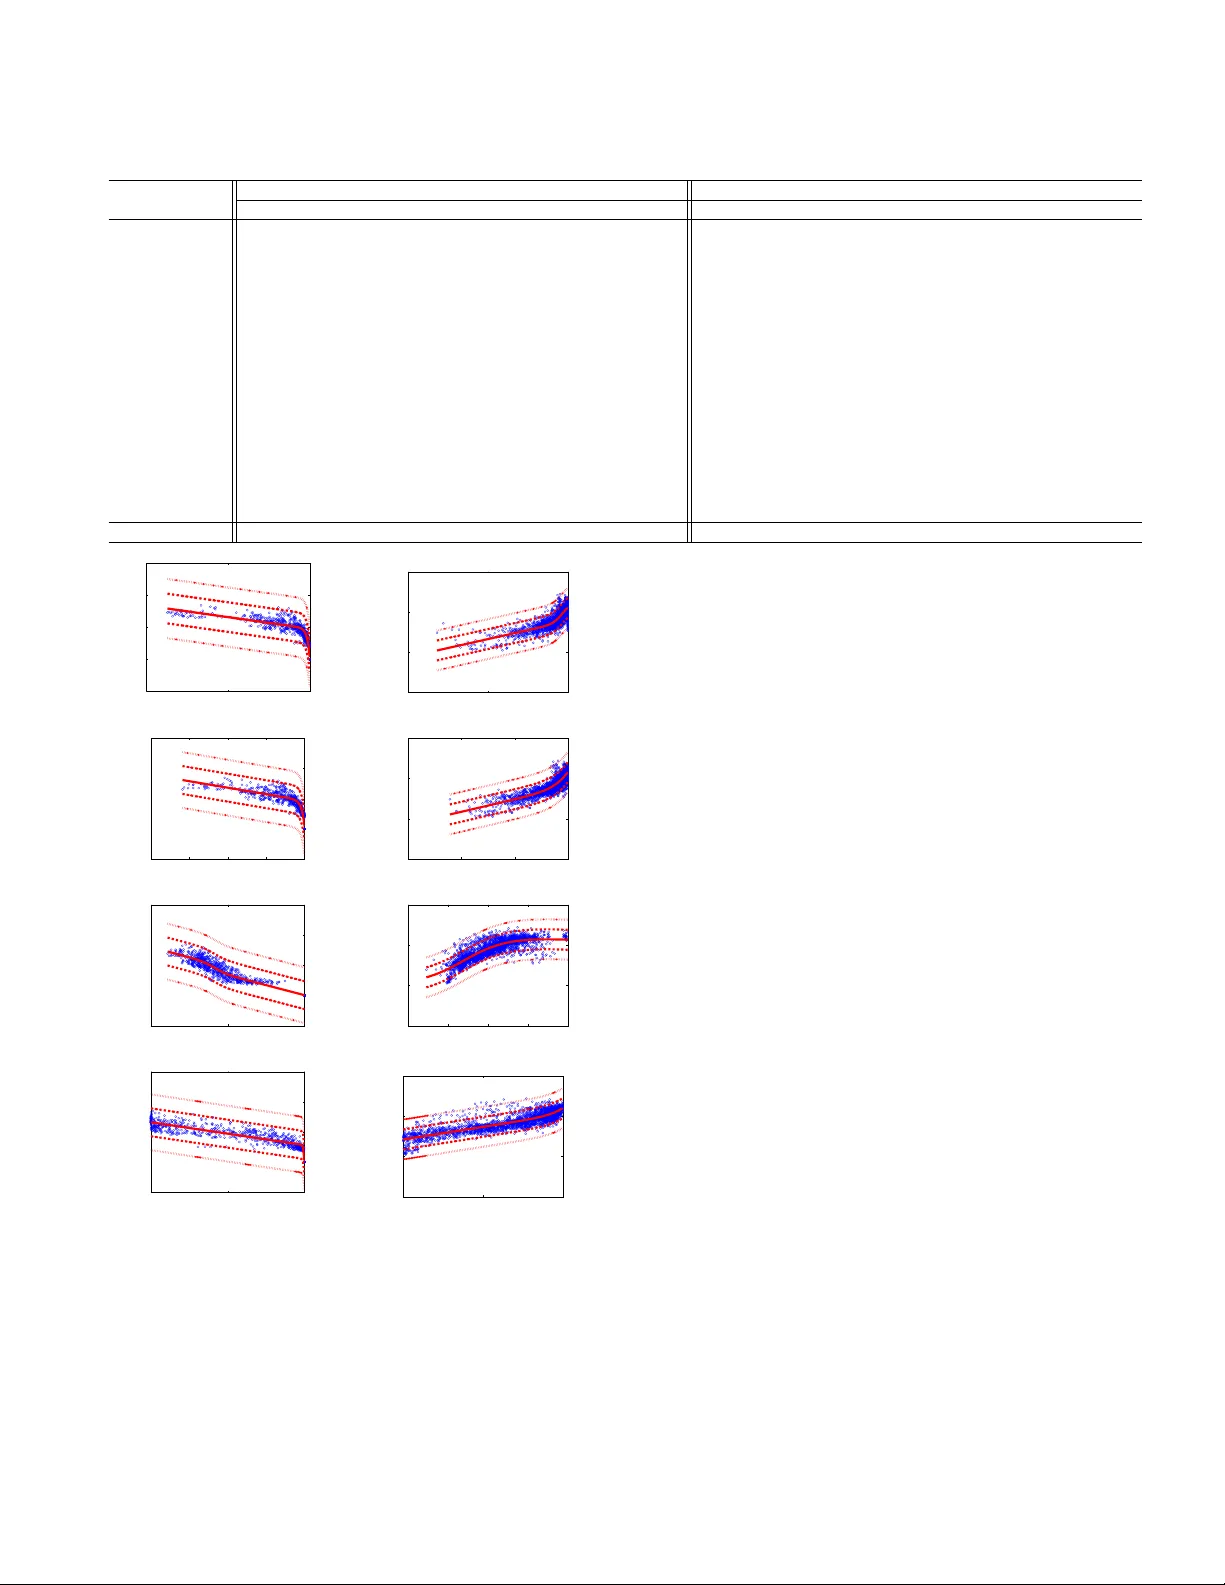
Citation D. T emel and G. AlRegib, ”PerSIM: Multi-resolution image quality assessment in the perceptually uni- form color domain, ” 2015 IEEE International Conference on Image Processing (ICIP), Quebec City , QC, 2015, pp. 1682-1686. DOI https://doi.org/10.1109/ICIP.2015.7351087 Review Date added to IEEE Xplore: 10 December 2015 Code/Poster https://ghassanalregib.com/publications/ Bib @INPR OCEEDINGS { T emel2015 ICIP , author= { D. T emel and G. AlRegib } , booktitle= { 2015 IEEE International Conference on Image Processing (ICIP) } , title= { PerSIM: Multi-resolution image quality assessment in the perceptually uniform color domain } , year= { 2015 } , pages= { 1682-1686 } , doi= { 10.1109/ICIP .2015.7351087 } , month= { Sept } , } Copyright c 2015 IEEE. Personal use of this material is permitted. Permission from IEEE must be obtained for all other uses, in any current or future media, including reprinting/republishing this material for advertising or promotional purposes, creating new collectiv e works, for resale or redistribution to servers or lists, or reuse of any copyrighted component of this w ork in other works. Contact alregib@gatech.edu https://ghassanalregib.com/ dcantemel@gmail.com http://cantemel.com/ PerSIM: MUL TI-RESOLUTION IMA GE QU ALITY ASSESSMENT IN THE PERCEPTU ALL Y UNIFORM COLOR DOMAIN Dogancan T emel and Ghassan AlRe gib Center for Signal and Information Processing (CSIP) School of Electrical and Computer Engineering Georgia Institute of T echnology , Atlanta, GA, 30332-0250 USA { cantemel,alregib } @gatech.edu ABSTRA CT An average observer perceives the world in color instead of black and white. Moreov er , the visual system focuses on structures and segments instead of individual pixels. Based on these observations, we propose a full reference objectiv e image quality metric modeling visual system characteristics and chroma similarity in the perceptually uniform color do- main ( Lab ). Laplacian of Gaussian features are obtained in the L channel to model the retinal ganglion cells in human visual system and color similarity is calculated over the a and b channels. In the proposed perceptual similarity index ( PerSIM ), a multi-resolution approach is followed to mimic the hierarchical nature of human visual system. LIVE and TID2013 databases are used in the validation and P erSIM outperforms all the compared metrics in the o verall databases in terms of ranking, monotonic behavior and linearity . Index T erms — image quality analysis, human visual sys- tem, perception, LoG features, similarity index 1. INTRODUCTION Image quality metrics are designed to estimate the perceived quality . A full reference objecti ve image quality metric tries to quantify the differences between the original and the dis- torted image if both the images are av ailable. Root mean- squared error (RMSE) is calculated by obtaining the pixel- wise dif ference between the two images, taking the square root of the difference and calculating the mean. RMSE is scaled with the bit depth of the image and mapped using a monotonic logarithmic function to obtain the peak signal-to- noise ratio (PSNR). The authors in [1] introduce PSNR-HVS by stretching the contrast block-wise, quantizing the DCT coefficients with the JPEG compression table and removing mean shift. PSNR-HVS is further modified by multiplying the difference between the DCT coefficients with contrast masking metric (PSNR-HVS-M) [2]. The authors in [3] add mean shift sensitivity and contrast change to the pixel-wise metrics and the modified versions are denoted as PSNR-HA and PSNR-HMA. Signal-to-noise ratio (SNR) is weighted by the authors in [4] using contrast sensitivity function and the authors in [5] use wa velet-based models of visual masking. In addition to pixel-wise metrics, structural metrics are also commonly used to estimate the quality of images. The authors in [6] compare the reference and distorted images in terms of luminance, contrast and structure similarity in the spatial domain to estimate the image quality . These structure-based metrics are also extended to multi-scale (MS- SSIM) [7], complex domain (CW -SSIM) [8] and information- weighted (IW -SSIM) [9] versions. Instead of directly using the pixel values, phase and magnitude of the images can also be used separately to estimate the quality . FSIM is a fea- ture similarity index introduced by the authors in [10] which consists of phase congruenc y (PC) and gradient magnitude (GM). PC consists of log-Gabor filter and Gaussian spread function and GM is based on gradient operators. The feature similarity index is further extended as FSIM-c which also in- cludes the color similarity in the YIQ domain. GM is utilized along with the LoG features to obtain joint statistics that can be used for blind image quality assessment by the authors in [11]. LoG features are also used in [12] to directly asses the image quality b ut they o verlook the hierarchical procedure and color perception in the visual system. In this paper , we operate in the perceptually uniform Lab color space where luma and chroma information are sepa- rated. Retinal ganglion cells in the visual system are modeled using the LoG features in the L channel. Chroma similarity is calculated over the a and b channels. W e obtain the similar- ity maps at different resolutions and calculate the geometric mean of these maps to obtain the multi-resolution similarity maps. LoG and chroma similarities are tuned using the ratios in the 4:2:2 chroma sub-sampling format. After sensitivity tuning, the minimum similarity is selected pix el-wise ov er the quality maps. Mean pooling is performed ov er the full map to calculate a single quality value. The resulting value is mono- tonically mapped by taking the po wer to obtain the perceptual similarity index PerSIM . 2. PERSIM 2.1. Log F eatures Instead of using the pixel values as raw data, image fea- tures are extracted to represent the images in a more compact and distinctiv e w ay . Dif ference of Gaussian and Laplacian of Gaussian are among the most commonly used operators in the image processing literature and the computer vision literature. Dif ference of Gaussian operators can be used to model the retinal Ganglion cells of the cat as discussed in [13]. Moreo ver , the authors in [14] discuss that Gaussian deriv ative-lik e approaches can model neural mechanisms in the human foveal retinal vision. These Gaussian deriv ativ e- like approaches also outperform the Gabor filter-based mod- els according to model-free W iener filter analysis as explained in [14]. In the dif ference of Gaussian models, standard de via- tion and the scale of the difference need to be tuned to obtain distinctiv e features. In case of using various scales, fusion of these models also becomes an issue. Dif ference of Gaus- sian operator can be used as an approximation to the second deriv ative of Gaussian when the scale is adjusted. And the second deriv ativ e of Gaussian corresponds to the Laplacian of Gaussian operator . In order to avoid the tuning of the scale and simplify the problem, we use Laplacian of Gaussian as formulated in Eq. (1). ˆ LoG “ 1 ? 2 π σ 2 m 2 ` n 2 ´ 2 σ 2 σ 4 e ´p m 2 ` m 2 q{p 2 σ 2 q (1) The standard deviation of the LoG operator is represented with σ and m and n are the respectiv e pixel locations . Ref- erence ( f 1 ) and distorted ( f 2 ) images are con volved with the LoG operator as formulated in Eq. (2) where i corresponds to the image index. LoG i “ f i r m, n s˚ ˆ LoG r m, n s (2) The similarity between LoG maps is calculated using the familiar similarity formulation that has been part of most of the structural and pixel-wise comparison metrics as expressed in Eq. (3). LoGS I M r m, n s “ 2 ¨ LoG 1 r m, n s ¨ LoG 2 r m, n s ` c 1 p LoG 1 r m, n sq 2 ` p LoG 2 r m, n sq 2 ` c 2 (3) Similarity metric becomes 1 . 0 when the images are same and it gets closer to 0 . 0 as the differences between images become very large. W e set constants c 1 and c 2 to 0 . 001 to av oid the issues when the denominator con ver ges to 0 . 0 . 2.2. Color Similarity Color similarity is directly calculated over the a and the b channels separately . W e use the similarity formulation as ex- pressed in Eq. (4) and Eq. (5). aS I M r m, n s “ 2 ¨ a 1 r m, n s ¨ a 2 r m, n s ` c 3 p a 1 r m, n sq 2 ` p a 2 r m, n sq 2 ` c 4 (4) bS I M r m, n s “ 2 ¨ b 1 r m, n s ¨ b 2 r m, n s ` c 5 p b 1 r m, n sq 2 ` p b 2 r m, n sq 2 ` c 6 , (5) where a 1 r m, n s and b 1 r m, n s are the chroma channels in the reference image and a 2 r m, n s and b 2 r m, n s are the chroma channels in the distorted image. c 3 , c 4 , c 5 and c 6 are the con- stants set to 0 . 001 . 2.3. Fusion The human visual system is more sensitive to structural infor- mation compared to color . Based on this observ ation, chroma sub-sampling is introduced in image and video coding to as- sign less resolution to chroma information. 4 : 2 : 2 is one of the most commonly used chroma sub-sampling format where chroma channels get half the resolution of luma channels. In the proposed work, we follow a similar approach and tune the significance of the intensity and the color-based components. The power of LoG similarity is set to 4 . 0 and the powers of similarities for chroma channels are set to 2 . 0 . After this sen- sitivity adjustment, we choose the minimum among the simi- larity indexes as formulated in Eq. (6) because the perceiv ed quality is dominated by the most significant degradation. LabS I M S R r m, n s “ min pp LoGS I M r m, n sq 4 , p aS I M r m, n sq 2 , p bS I M r m, n sq 2 q (6) W e perform mean pooling to obtain a single quality v alue corresponding to the distortion map. Similarity is calculated ov er the full feature map so the pixels that are slightly dis- torted would bias the metric to be close to 1 . 0 . In order to increase the variation of the metric and spread the range of the estimations, we monotonically scale the resulting value with a power function as gi ven in Eq. (7). P er S I M S R “ ˜ M ÿ m “ 1 N ÿ n “ 1 LabS I M S R r m, n s M ¨ N ¸ c 7 (7) Mean pooling is performed over the whole image where M is number of rows, N is the number of columns and c 7 is the power index. S R refers to single resolution since we use the reference and distorted images at the original resolution. Power index is set to 25 so that the metric similarity index goes down to 0 . 0 under sev ere degradation. Po wer index es less than 25 does not use the full metric range and indexes more than 25 become extra sensitiv e to even slight degrada- tion. This monotonic scaling does not bias the results since ranking-based validation metrics are insensitiv e to the mono- tonic mapping and the re gression step before the linear corre- lation calculation perform monotonic mapping automatically . 2.4. Multi-Resolution Perception in the visual system is hierarchical. At first, the raw data is acquired with the sensor -like structures. Then, the data is processed and transferred into different abstrac- tion layers with varying resolutions. Different features and regions of interest can be more distinctiv e at different resolu- tions. Therefore, we calculate the perceptual similarity maps at different resolutions and fuse them together . W e start by calculating LoGSIM , aSIM and bSIM o ver three dif ferent resolutions. The first set is calculated over the full resolution while the second and third are calculated at 3 { 5 and 2 { 5 times the full resolution, respectively . W e refer to all the maps as LoGS I M , aS I M and bS I M and the scales of the resolution are sho wn with a subscript. LoG features and chroma similar - ities are extracted over the scaled maps and then interpolated to the original resolution using the bicubic approach. Since the av erage value and range of the metrics are not kno wn, we directly calculate the geometric mean of the interpolated maps pixel-wise to obtain the multi-resolution perceptual similarity map as formulated in Eqs. (8)-(10). LoGS I M M R r m, n s “ 3 a LoGS I M 1 . 0 ¨ LoGS I M 0 . 6 ¨ LoGS I M 0 . 4 (8) aS I M M R r m, n s “ 3 a aS I M 1 . 0 ¨ aS I M 0 . 6 ¨ aS I M 0 . 4 (9) bS I M M R r m, n s “ 3 a bS I M 1 . 0 ¨ bS I M 0 . 6 ¨ bS I M 0 . 4 (10) Multi-resolution indexes are combined in the same way as the single resolution giv en in Eq. (11). LabS I M M R r m, n s “ min pp LoGS I M M R r m, n sq 4 , p aS I M M R r m, n sq 2 , p bS I M M R r m, n sq 2 q (11) Finally , multi-resolution perceptual quality map is mean pooled and monotonically mapped as formulated in Eq. (12). P er S I M “ ˜ M ÿ m “ 1 N ÿ n “ 1 LabS I M M R r m, n s M ¨ N ¸ 25 (12) As the resolution gets lower , it becomes more challeng- ing to detect distinctiv e features. Therefore, we decrease the block-size and standard deviation accordingly as tabulated in T able 1. The scale v alues, standard deviation and block size are selected by visually assessing the distinctiveness of ran- domly selected feature maps. T able 1 . Multi-resolution PerSIM parameters Scaling Ratio Standard Deviation Block Size 1.0 10.0 13x13 0.6 8.0 4x4 0.4 7.0 2x2 3. V ALID A TION LIVE and TID2013 image databases are used in the valida- tion of PerSIM . LIVE database includes 29 reference im- ages and 779 degraded images under the distortion of JPEG, JPEG2000 (Jp2k), White Noise (Wn), Gaussian blur (Gblur) and Fast Fading Rayleigh channel errors (FF). TID2013 con- sists of 25 reference images that are originally from Kodak Lossless T rue Color Image Suite [15]. Reference images are degraded with 24 different types of distortions that fall into the categories of Noise, Actual, Simple, Exotic, Ne w and Color . TID2013 database is introduced in [16] where ranking based metrics Spearman and K endall correlation coefficients are used for the validation. Therefore, we follow the same approach as in [16]. Objectiv e image quality metrics are defined in dif ferent numerical ranges and monotonic regression is necessary for a T able 2 . LIVE Results Sequence Jp2k Jpeg Wn Gblur FF All Pearson (PLCC) PSNR 0.923 0.913 0.945 0.843 0.887 0.898 SSIM 0.963 0.957 0.976 0.940 0.956 0.945 MS-SSIM 0.962 0.961 0.977 0.943 0.948 0.946 IW -SSIM 0.959 0.959 0.981 0.957 0.953 0.951 FSIMc 0.960 0.953 0.977 0.955 0.953 0.950 PSNR-HA 0.976 0.971 0.980 0.935 0.953 0.953 CW -SSIM 0.926 0.927 0.949 0.768 0.835 0.872 LogSIM 0.956 0.952 0.987 0.943 0.942 0.943 PerSIM 0.976 0.959 0.968 0.967 0.946 0.955 RMSE PSNR 9.92 10.10 8.34 11.80 10.22 10.12 SSIM 7.11 7.74 8.65 7.54 6.45 7.52 MS-SSIM 7.12 7.30 8.38 7.38 7.04 7.43 IW -SSIM 7.38 7.64 6.95 6.37 6.86 7.11 FSIMc 7.55 7.73 6.97 6.71 6.68 7.20 PSNRHA 6.59 6.89 5.98 8.27 6.83 6.93 CW -SSIM 9.75 9.30 9.24 14.45 13.62 10.87 LogSIM 7.93 8.36 6.06 7.70 7.71 7.66 PerSIM 6.22 7.30 7.25 5.68 7.36 6.80 fair comparison if validation includes metrics that are based on linearity and accuracy including b ut not limited to Pearson linear correlation coef ficient (PLCC) and root mean-squared error (RMSE). In the literature, v alidation of the metrics in the LIVE database are mostly based on PLCC and RMSE and the function formulated in Eq. (13) is used for monotonic regression. Therefore, we also calculate the PLCC and the RMSE after the monotonic regression as tab ulated in T able 2. S “ β 1 ˆ 1 1 ´ 1 2 ` exp p β 2 p S 0 ´ β 3 qq ˙ ` β 4 S 0 ` β 5 (13) W e use the TID2013 benchmark data to compare the pro- posed metric with the state of the art. In the LIVE database, we use the common structural metrics and the best perfom- ing ones in the TID benchmark. In order to show the ef- fect of color similarity in the overall metric, we replace the LabS I M M R r m, n s in Eq. 12 with LoGS I M M R r m, n s and report the results as Log S I M . T op three performance values are highlighted in the results tables to indicate best perform- ing metrics. In the LIVE database, PerSIM is among the top metrics in the compression-related degradation JPEG2000 and JPEG and also in Gaussian blur . Howe ver , PerSIM is not as good as structure and phase conjugacy-based metrics in case of White noise and Fastfaing artifacts. White noise artifacts are captured by the LoG features but color similarity is less sensitiv e to these artifacts. In case of the Fastfading, communication channel errors can lead to local errors that are perceptually v ery disturbing but they w ould be ov erlooked by PerSIM since relati ve size of the errors can be ne gligible compared to the rest of the sharp transitions in the image. In the o verall LIVE database, PerSIM still performs better than the compared metrics. The performance of PerSIM in the TID2013 databse is tabulated in T able 3. According to the validation results, PerSIM is among the best performing metrics in all the cat- T able 3 . TID2013 Results Sequence Spearman (SROCC) Kendall (KCC) Noise Actual Simple Exotic New Color Full Noise Actual Simple Exotic New Color Full FSIM-c 0.902 0.915 0.947 0.841 0.788 0.775 0.851 0.722 0.742 0.792 0.651 0.611 0.592 0.666 PSNR-HA 0.923 0.938 0.953 0.825 0.701 0.632 0.819 0.760 0.787 0.818 0.624 0.541 0.477 0.643 PSNR-HMA 0.915 0.934 0.937 0.814 0.738 0.675 0.813 0.745 0.777 0.785 0.610 0.572 0.507 0.631 FSIM 0.897 0.911 0.949 0.844 0.649 0.565 0.801 0.715 0.736 0.795 0.655 0.518 0.447 0.629 MS-SSIM 0.873 0.887 0.905 0.841 0.631 0.566 0.787 0.679 0.697 0.720 0.647 0.490 0.450 0.607 IW -SSIM 0.871 0.887 0.911 0.840 0.619 0.549 0.778 0.678 0.701 0.730 0.644 0.475 0.424 0.597 PSNRc 0.769 0.803 0.876 0.562 0.777 0.734 0.687 0.562 0.596 0.689 0.392 0.576 0.536 0.496 VSNR 0.869 0.882 0.912 0.706 0.589 0.512 0.681 0.676 0.690 0.731 0.519 0.437 0.378 0.508 PSNR-HVS 0.917 0.926 0.951 0.601 0.646 0.555 0.654 0.754 0.766 0.809 0.435 0.512 0.441 0.507 PSNR 0.822 0.825 0.913 0.597 0.618 0.535 0.640 0.623 0.624 0.745 0.425 0.468 0.408 0.470 SSIM 0.757 0.788 0.837 0.632 0.579 0.505 0.637 0.551 0.577 0.628 0.455 0.418 0.378 0.463 NQM 0.836 0.857 0.875 0.589 0.625 0.538 0.635 0.641 0.666 0.681 0.412 0.478 0.401 0.466 PSNR-HVS-M 0.906 0.917 0.938 0.564 0.646 0.553 0.625 0.733 0.749 0.780 0.403 0.513 0.433 0.481 VIFP 0.784 0.815 0.897 0.557 0.589 0.506 0.608 0.587 0.621 0.714 0.406 0.445 0.385 0.456 WSNR 0.880 0.897 0.933 0.423 0.646 0.555 0.580 0.696 0.718 0.772 0.297 0.510 0.429 0.446 LogSIM 0.910 0.923 0.947 0.806 0.662 0.604 0.787 0.736 0.756 0.799 0.615 0.521 0.473 0.618 PerSIM 0.925 0.936 0.950 0.799 0.863 0.856 0.854 0.760 0.778 0.807 0.606 0.681 0.674 0.677 0 1 −50 0 50 100 150 0.5 IWSSIM DMOS (a) LIVE-IW -SSIM 0 1 −5 0 5 10 0.5 IWSSIM MOS (b) TID-IW -SSIM 0.2 0.4 0.8 1 −50 0 50 100 150 0.6 FSIMC DMOS (c) LIVE-FSIM-c 0.4 0.6 0.8 1 −5 0 5 10 FSIMC MOS (d) TID-FSIM-c 0 1 −50 0 50 100 150 0.5 PSNRHA DMOS (e) LIVE-PSNR-HA 0.2 0.4 0.8 1 −5 0 5 10 0.6 PSNRHA MOS (f) TID-PSNR-HA 0 1 −50 0 50 100 150 0.5 PerSIM DMOS (g) LIVE-PerSIM 0 1 −5 0 5 10 0.5 PerSIM MOS (h)TID-PerSIM Fig. 1 . Scatter plots of objective image quality metrics values egories except Exotic. Exotic category includes local block- wise distortions and JPEG2000 tranmission errors that can lead to local and slice-based distortions that are overlooked by the LoG features and color similarity . In the ov erall TID2013, PerSIM is still the best performing objecti ve quality metric among the compared ones. As it can be seen in T able 2 and T able 3, the performance of the quality metric over the full image set degrades without the color similarity in both LIVE and TID2013. If we compare the metrics in both LIVE and TID2013 databases, the best performing metrics are IW -SSIM, FSIMc, PSNR-HA and PerSIM. The scatter plots of the best perform- ing metrics are giv en in Fig. 1 to observe the distributional characteristics. Information theoretic-weighting based struc- tural metric (IW -SSIM) scores mostly cluster around the high quality region and the same observ ation is valid for the metric based on phase-conjugacy (FSIMc). PSNR-HA has an outlier problem when we include identical images and the range of the metric is not bounded. In order to obtain the scatter plot in Fig. 1(f), we exclude the outliers. PSNR-HA estimates are mostly centered in the metric range and it has a higher lin- earity compared to the strucutral and phase-conjugacy-based metrics. PerSIM scores are distributed in the full metric range and show a high linearity . Almost all the estimates are in the one standard deviation range in the LIVE database. Howe ver , in the TID2013 database, some of the estimates are located between one and two standard deviation and only a minority is located outside of two standard deviation range. Most of the outliers in the TID2013 database correspond to the Exotic class since PerSIM has difficulty in capturing lo- cal degradations. 4. CONCLUSION W e proposed a full reference multi-resolution image quality metric based on LoG features and chroma similarity in the perceptually uniform Lab domain. LoG features are used to model the retinal ganglion cells in the human visual system and the color similarity complements the structural similar- ity . The results in the LIVE and TID2013 database show that PerSIM outprforms state of the art metrics in terms of mono- tonicity , accurac y and linearity . Even PerSIM detects major - ity of the distortions accurately , it overlooks local distortions. As an ongoing work, we are working on a smarter pooling strategy to make the metric sensiti ve to local distortions. 5. REFERENCES [1] K. Egiazarian, J. Astola, N. Ponomarenko, V . Lukin, F . Battisti, and M. Carli, “A Ne w Full-reference Quality Metrics based on HVS, ” in Pr oceedings of the Second International W orkshop on V ideo Pr ocessing and Qual- ity Metrics, , 2006. [2] N. Ponomarenko, F . Silvestri, K. Egiazarian, M. Carli, J. Astola, and V . Lukin, “On between-coefficient con- trast masking of dct basis functions, ” in Pr oceedings of the Second International W orkshop on V ideo Process ing and Quality Metrics , 2007, pp. 1–4. [3] N. Ponomarenko, O. Ieremeiev , V . Lukin, K. Egiazarian, and M. Carli, “Modified Image V isual Quality Metrics for Contrast Change and Mean Shift Accounting, ” Pr o- ceedings of CADSM , 2011. [4] T . Mitsa and K. L. V arkur , “Evaluation of Contrast Sensitivity Functions for the Formulation of Quality Measures Incorporated in Halftoning Algorithms, ” in ICASSP , 1993. [5] D. M. Chandler and S. S. Hemami, “VSNR: a wavelet- based visual signal-to-noise ratio for natural images., ” IEEE T ransactions on Image Processing , v ol. 16, no. 9, pp. 2284–98, Sept. 2007. [6] Z. W ang, A. C. Bovik, H. R. Sheikh, and E. P . Simon- celli, “Image quality assessment: from error visibility to structural similarity ., ” IEEE transactions on image pr o- cessing : a publication of the IEEE Signal Pr ocessing Society , vol. 13, no. 4, pp. 600–12, Apr . 2004. [7] Z. W ang, E. P . Simoncelli, and A. C. Bovik, “Multi- Scale Structural Similarity For Image Quality Assess- ment ( Invited Paper ), ” the Thirty-Se venth Asilomar Confer ence on Signals, Systems and Computers , vol. 2, pp. 9–13, 2004. [8] Z. W ang and E. P . Simoncelli, “T ranslation Insensitive Image Similiarity In Complex W av elet Domain Zhou W ang and Eero P . Simoncelli, ” vol. II, no. March, pp. 573–576, 2005. [9] Z. W ang and Q. Li, “Information Content W eighting for Perceptual Image Quality Assessment., ” IEEE T ransac- tions on Image Processing , vol. 20, no. 5, pp. 1185–98, May 2011. [10] L. Zhang, L. Zhang, X. Mou, and D. Zhang, “FSIM: A Feature Similarity Inde x for Image Quality Assess- ment., ” IEEE T ransactions on Image Pr ocessing , vol. 20, no. 8, pp. 2378–86, Aug. 2011. [11] W . Xue, X. Mou, L. Zhang, A.C. Bovik, and X. Feng, “Blind Image Quality Assessment Using Joint Statistics of Gradient Magnitude and Laplacian Features, ” Imag e Pr ocessing, IEEE T ransactions on , vol. 23, no. 11, pp. 4850–4862, Nov 2014. [12] X. Mou, W . Xue, C. Chen, and L. Zhang, “LoG Acts as a Good Feature in the T ask of Image Quality Assessment , ” Pr oc. SPIE , vol. 9023, pp. 902313–902313–7, 2014. [13] C. Enroth-Cugell and J. G. Robson, “The Contrast Sen- sitivity of Retinal Ganglion Cells of the Cat, ” The Jour - nal of Physiology , 1966. [14] R. A. Y oung, “The Gaussian Deriv ativ e Model for Spa- tial V ision: I. Retinal Mechanisms, ” Spatial V ision , 1987. [15] Eastman K odak Company , “Lossless True Color Image Suite, ” http://r0k.us/graphics/kodak/, [Online]. [16] N. Ponomarenko, O. Ieremeiev , V . Lukin, K. Egiazar- ian, L. Jin, J. Astola, B. V ozel, K. Chehdi, M. Carli, F . Battisti, and C.-C.J. Kuo, “Color Image Database TID2013: Peculiarities and Preliminary Results, ” pp. 106–111, June 2013.
Original Paper
Loading high-quality paper...
Comments & Academic Discussion
Loading comments...
Leave a Comment