Mathematical Modeling of Arterial Blood Pressure Using Photo-Plethysmography Signal in Breath-hold Maneuver
Recent research has shown that each apnea episode results in a significant rise in the beat-to-beat blood pressure and by a drop to the pre-episode levels when patient resumes normal breathing. While the physiological implications of these repetitive…
Authors: Armin Soltan Zadi, Raichel M. Alex, Rong Zhang
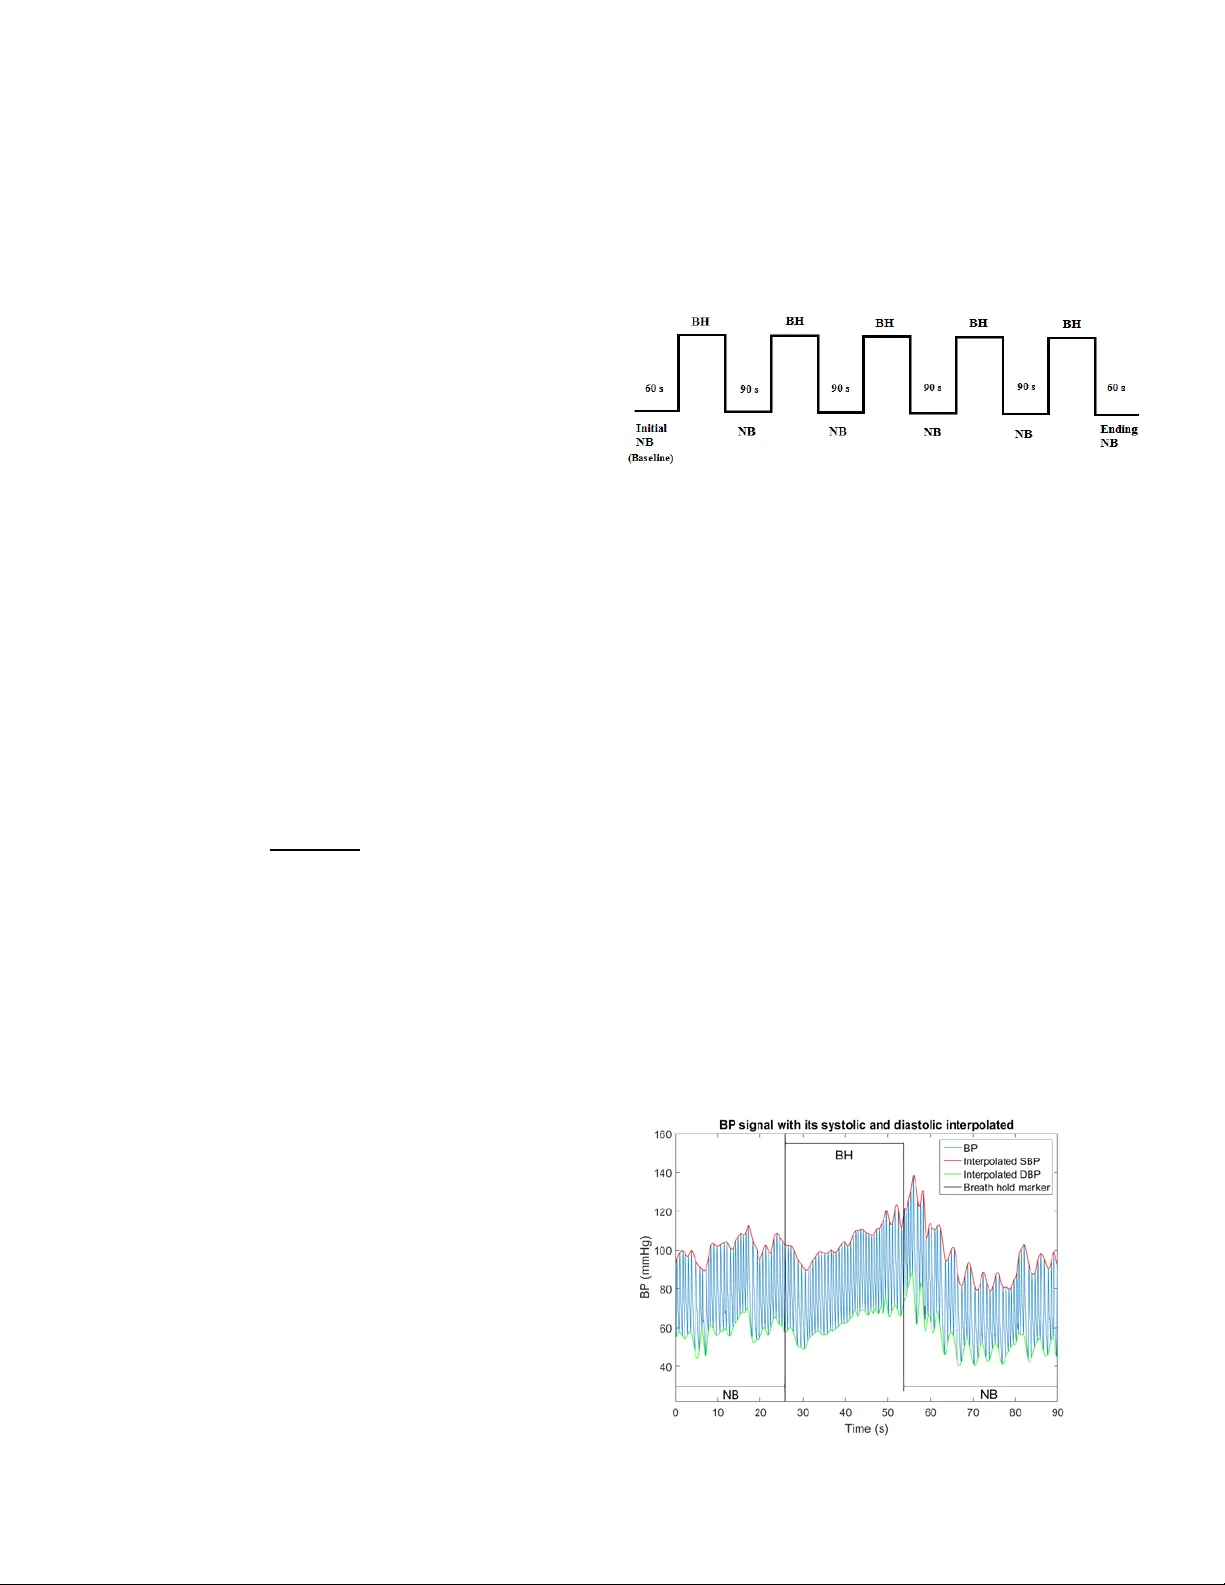
Abstract — recent researc h has s hown t hat eac h apne a epis ode re sults in a significan t rise in the b eat -to - be at bl ood pr essure and by a d rop to the pre - episo de level s w hen pa tie nt res umes n or ma l breat hing . While the ph ysiological implica tio ns of th ese repetiti ve and significan t oscillation s are still unkno w n, it is of interest to quantify them. Since cu rrent array of instruments depl oye d for pol yso mnog raphy stu dies d oes not incl ude beat -to- beat measure me nt of bloo d pres sure, b ut incl udes ox i metry, it is both of cl inic al inte rest to e sti mate t he mag nit ude of B P oscillat ion s fr om the p hotop lethysm ograp hy (PPG ) signa l that is readily available from sleep lab oximeters. We ha ve investi gate d a new metho d for conti n uous esti mation of systol ic (SBP) , diastolic (DBP), and mean (MBP) blood press ure w avefor ms from PPG . Pe aks and tr oug hs of P PG w avefor m are u sed a s input to a 5 th order a utoregress ive moving averag e model to construct estimates of SBP, DBP, and MB P waveform s . Sinc e breat h hol d mane uvers are sh ow n to si mulate ap nea epi so des faithfully, w e evaluate d t he performance of t he pro pos ed met hod in 7 subje cts (4 F; 32 ±4 yrs. , BMI 24.57± 3.87 kg/m 2 ) in s upi ne positi on doing 5 bre ath maneuv ers w it h 90s of normal bre athin g b etween the m . T he modeling error ra nges were ( all units are i n mmH g ) - 0.88±4 .87 to - 2. 19±5. 73 (SBP ); 0.29± 2.39 to - 0.97 ±3.83 (DB P); and - 0.42±2.64 to - 1. 17±3.82 ( MBP) . Th e cross vali dati on error ranges were 0. 28±6.45 t o - 1.7 4±6.55 (SBP); 0.09± 3.37 t o - 0.97± 3. 67 (D BP); a nd 0.33± 4.34 t o - 0.87± 4.42 ( MBP). The level of esti mation error in, as measured by the root mean squar ed of the model resi duals, w as l ess than 7 m mHg . I. I NTRODUCTION Recently, i nvesti gato rs hav e sho wn the presen ce of significant oscil lations i n nocturnal blood pre ssure (BP) in a sample of obstructiv e sleep apnea (OSA) patients [1] . T he significant le vel of these osc illation s and their high fr eque ncy (occurring at ev ery apnea episode) have heightened the interest of researchers to explore the extend of these oscillations in the larger samples of OSA patie nts, as such investigatio n may provide clues to ro ot cause of the cardiov ascular and cerebrovascular comorbidities of OSA. The knowled ge of t he extend of these oscilla tions is particu larly importan t because num erous stu dies have sh own suf ficie nc y of t he sys tolic blood press ure ( SBP ) a nd diastoli c blood pres sure ( DBP ) and comp u ted Mean arterial blood pressur e ( MBP ) as a predictor of m orta lity [2 - 5] . With curre nt state of t he art technolog y, quantifica tion of the noc tur nal osc illa tio ns in BP r equire s the use of ra the r costly devices that can provide beat - to - beat measure of BP (e.g., Finapres) in s leep studies. Considering that larg er Soltan zadi , K Beh beh ani , D . E. Waten pau gh are with t he Un ivers ity o f Texas at Arlington , Arlington , TX 76019 ( armin.so ltanzad i@uta.ed u , and kb@u ta.ed u , ). Ra ich el M. Alex, 805 23 USA ( raiche lmary .alex@m avs.uta.ed u ). Rong Zha ng is wit h the N euro lo gy populat ion studies f or this purpose , by nec essity , involves multiple sleep lab s. Gi ven tha t mea sure ment o f noct urn al beat - to - beat BP is not part of the poly somnogra phy studi es in the sleep labs, it is of interest to d e velop me thods of esti mati ng the exte nt o f apnea - drive n BP oscilla tion from t he equipment that are cu rrently part of th e standar d pol ysomno grap hy ins tr u m e ntation. Recent stud ies ha ve hi ghlig hted t he bene fits o f usi ng photopl ethysm ography ( PPG ) signa l that is availab le from most, if not all, sleep labor atory oximeter to estimate the BP oscillations indir ectly [6] . Indeed, som e inves tigators have explored using pulse transit time (PTT ) extracted from PPG to estimate BP in aw ake subject s [7 - 9] . These studies have shown a correlation coef ficient of around 0.8 in experimental studie s. Howeve r, the esti matio n of noc tur nal BP oscillation has no t bee n stud ied b efore. The obj ective of this study is to estimate the key features of blood press ure f rom P PG. Specifically , we estimate systolic BP (SBP) , diastolic BP ( DBP) and m ea n arterial B P ( MBP ) from PPG pe aks a nd tro ughs . The motivation i s to accurately estimate an d trac k th e changes of BP d uring simulated sleep apnea by using photopl ethysm ograph probe which is easier to a pply and less costl y. II. M ETHOD We use d peaks and trou ghs of th e PPG waveform to model SBP and DB P cor respo ndingl y usin g Auto regre ssiv e Moving - average (ARMA) models. Using th e estimated values of s ystolic and diasto lic BP , we then estimat ed the MB P. ARMA model is a system identificatio n method which can provide a m athematical model for the dynamics of the system as w ell as any pure time dela y [10] . It has b een sho wn to be efficient for the biolo gical systems with multiple inputs and delays [11] . For the purposes of this study, we apply a single input (i.e., PPG feature) and single output (i.e., BP feature). A single - input - singl e - outp ut, time - invariant , and causal A RMA mode l can be re presente d as a dynam ic diffe rence equ ation inv olving prese nt and past values of the input and output as descr ibed in equatio n (2): ( ) + ( 1 ) + + ( ) = ( ) + + ( + 1 ) + ( ) (1) where m is the sample number, y is the output , u is the input Departm ent, Un iversity of Te xas So uth Weste rn, Dall as, TX 75390 US A (e - mai l: RongZhan g@texash ealth.org ). Mathematical Mo deling of Arterial Blo od Pr essure Using Photo - Plethysmography Signal in Breath - hold Ma neuver Arm in Soltan zad i, Raic hel M. A lex, Rong Z hang, Donald E. Watenpaugh, Kho srow Behbehani and e stands for error, for = 1,2 … , and fo r = 1,2, … , ar e the model par ameters th at need to be compu ted , and n a and n b signi fy the order s of AR MA model wh ile n k is the num be r of pure - time delay samples. A major decision in developing an effective ARMA model is the selection of the order of t he model and any pure - time delay that may b e invol ved. In thi s st udy, we u se pr incipl e o f parsi mon y an d model adequacy to find the least mean s q uare error in a certain range of orders. A com pro mise was reached for the orders and the delays to b e 5. Then ARMA model parameters are estimated in MATLAB using least square method to minimize the model error for specific orders. A ll the model subs et s (with all possible combinatio ns of orders) are generated and compared by their MSE. The lowes t MSE is selected to be best m odel generated in the s pecified n a and n b and n k . T here are other methods including Akaike 's information criter ion ( AI C ) [12 - 13] to find the best model but it does not n ecessarily give the lowest MSE . In o ur st udy, we limited the model orders to be less than 5 and therefore there is n o need f or findi ng sim plest m ode l. These orders are selected based on trial and er ror as we compared hig her orders mode ls and did not see any signifi cant improv ement in result s. A. Focal poi nts on BP s ignal For th is study , we opted t o use S BP, DBP an d M B P si nce these are proven to be in wide use in clinical practice as robust indi cators of blood pres sure h ealth . The measured MBP was obtained from measured SBP and measured DBP using Eq. (2): = (2) In estimating the m odel para meters for est imati ng SB P a nd DBP ( Eq . (1) ) , we use measured SBP and DBP as outp ut s an d peaks and t roughs of PPG signal as inputs, respectivel y . F ro m estimated SBP and DBP – denoted a s SB P and – , we compute the es timated MBP (i.e., u sing Eq. ( 2). Since the applicatio n of the ARMA mode l (Eq. (2)) requi res equidi stance s amplin g of both t he in put and ou tput data, w e use c ubic sp line met hod to interpolate DB P, SBP and MBP values at the same sampling rate of the BP and PPG signal, i.e. , 100 Hz. B. Experimen tal setup The prot ocol an d wri tt en subject consent form for tes ting subject s we re approved by our Hum an Subjec t Inst itutional Review Board. Seven s ubjects (4 F , 32±4 yrs. , B MI 24.57±3. 87 kg/m 2 ) wit h no k nown ai lme nt voluntee red for this s tudy a nd sig ned the conse nt for m. The subj ects wer e asked to avoid any caffeine intake f or 6 hours before the experiments. The subjects were tested in su pine position, performing a sequence of five bre ath hold ing maneuve rs. T he seque nce of t he mane uve rs is sho wn in Fi gure 1 . At the st art, each subject was asked to brea the n ormal ly for 60 s t o obta in baseline data. Afterward each subject performed a series of five b rea th hold maneuve r s to i nduce d yna mic chan ges i n BP change. During each breath hold (BH), subjects w ere instructed to ho ld their breath for as long a s the y can. H ence , the du ration of each bre ath hol d varied, dependin g on the ability of the subject to prolong the brea th hold. Inter breath hold interva ls , i.e. nor m al breathings (NB), w ere fixed at 90 seconds to provide adequate recovery time betw e en consecutive breath h olds . Dat a was collect ed for the entire dura tion, fro m the i nitia l ba seline thr ough the final ‘endi ng NB’ peri od (Fig. 1). Fi gure 1- Timi ng di agram o f prot ocols (NB: Nor mal breat hing, BH: Bre ath hold) We used a Finapres b lood pres sure monitor (Finapre s Medical System s, Enschede, Ne therlands ) for b eat - to - beat meas urement of BP [ 14] . Photoplethys mography signal wa s acquire d using Nellcor OxiMax N - 600x monitor (M edtronic, Minne ap olis, USA). Altho ugh the signa ls were acquired at 1000 sample per second, bo th BP a nd PPG signals w er e down sampled to 100 sample s per second. T his w as do ne t o make computation of the m odels more effici ent, wh ile still preser ving the i mportant d ynamics o f the signal. A ty pical blood pres sure signal and its s ystoli c and diastolic values are shown in Fig. 2 . The black line shows the breat h holds intervals w henever it jumps u p. At its low values, the su bject is in normal breathing co ndition. Obviousl y, the b lood pressure follows a rising tre nd during BHs and it c an be s een in both systolic va lues int erpolated in red an d diastolic value s interpolate d in green . C. Model Imple mentation Applyi ng ARMA model (Eq. (1)), w e obtaine d the model parameters for estimating SBP (i.e., SB P ) and DBP (i.e., DB P) from PPG signal. A RMA mod els f or each of the five BH intervals were c alculated separa tely for both s ystolic and diast olic BP in a ll 7 subjec ts. In ot her w ords, we obta ined 5 SBP m odel and 5 DBP m odel f or each su bject. Then , for both measured MBP and estimated MBP (i.e. MA P), we applied Eq. (2). Fi gure 2- BP sig nal and systoli c and d iastoli c interpol ated val ues dur ing breat h - hold Fi gure 3- Estim ated MBP signal versus Measured MBP from the sam e inte rval (Modelin g) Figure 4- Estimated MBP signal versus measured MBP in another interval (Validati on) D. Model and C ross Val idation To ascertain the accuracy and predictive ability of the models, we c onducted tw o types of evalu ations. Fir st, we computed the residuals for the model by comput ing the difference between the experimentally measured (e.g. , SB P) a nd the model estimat e of the outp ut (e. g. SB P ) ; referred to as Model Errors. S econd , w e co m puted the cross validation e rrors by apply ing a model obt ained usin g one inter val to pr edict t he BP in other intervals . We computed the cross v alidation errors for all unique per mutations of mod e ls. III. R ESU LTS Diastolic values are shown in Fig.2. The straight blac k lines d enote the br eath ho lds i nterva l (hi gh leve l) and nor mal breathing cond ition (lo w level). T he rise in blood pr essure during BH and its drop afterwards can be easi ly seen. Fig. 3 sho ws a sample o f computed MA P superi mpos ed on the respective m easured valu es of MBP from t he same interval (in this case, BH2) . Fi g. 4 s ho ws the estimated M A P supe rimposed on measured MBP validated in another interva l (in this case, BH 2 validated with BH3). T he mean ± standard devi ation of th e model and cross validation erro rs for all SBP , DBP , and MBP a re sho wn in Table 1 and Table 2 , respectively . Table 1- Mea n ±Std.Dev. of mode l errors for eac h BH int erval (in mmHg) 1 st BH 2 nd BH 3 rd BH 4 th BH 5 th BH Systolic 1.00 ±3.77 - 0.29±3. 81 - 2.19±5. 73 - 0.88±4. 87 - 0.62±4. 88 Diastolic 0.29 ±+2. 39 - 0.49±2. 63 - 0.66±3. 98 - 0.31±3. 16 - 0.97±3. 63 MBP 0.53 ±2.32 - 0.42±2. 64 - 1.17±3. 82 - 0.50±3. 14 - 0.85±3. 53 Table 2- Mea n ±Std.Dev. of cross validation errors of each BH interval obt ained us ing m odels of all other BH interval s (in mmHg) 1 st BH 2 nd BH 3 rd BH 4 th BH 5 th BH Systolic 0.28 ±6.45 0.20 ±5.49 - 1.74±6. 55 - 0.93±5. 10 - 0.64±4. 91 Diastolic 0.35 ±4.08 0.09 ±3.37 - 0.44±4. 37 - 0.46±3. 55 - 0.97±3. 67 MBP 0.33 ±4.34 0.13 ±3.64 - 0.87±4. 42 - 0.62±3. 49 - 0.86±3. 56 To estimate the accuracy of the v alues of S B P , DB P , and MA P obtained from each model, the root m ean square error (rMSE) for th e Model Errors for all BH intervals were comp uted. The results of ave ragin g th e rMSE values derived from the model e rrors for all s ubjects are tabulated in Table 3. To asses s how a m odel developed f rom the data of one inter val ( e.g. B H1) predicts the correspon ding BP me asures (i.e. SBP, DB P or MBP ) o f anothe r con grue nt in terva l, we computed the rMSE of the cross validation e rrors for BH and tabulated the m in T able 4 . Table 3- rMSE s of model errors of BH intervals (in mmHg ) 1 st BH 2 nd BH 3 rd BH 4 th BH 5 th BH Systolic 3.90 3.83 5.1 1 4 .95 4.9 2 Diastolic 2.41 2.68 4.03 3.18 3.76 MBP 2.38 2.67 4.00 3.18 3.63 Table 4- rMSE s of valid ation of eac h BH int erval by all other BH intervals (in mmHg ) 1 st BH 2 nd BH 3 rd BH 4 th BH 5 th BH Systolic 6.46 5.49 6.78 5.18 4.95 Diastolic 4.10 3.37 4.39 3.58 3.8 0 MBP 4.35 3.65 4.50 3.54 3.66 IV. D ISCUSSION Fig. 3 and F ig. 4 sho w tha t MA P w ell track the overall rising trends of the MBP signa ls d uring t he BH i nterval s. T he means of the model errors and c ro ss validation e rrors in Table1 an d Table 2 prov ide an assessment of the level of accuracy of estimation of the SBP, DBP, and MBP . As ca n b e seen, the largest estim ation errors f or BH interval i s less than 2.1 9 mmH g. Indeed, a majority of the cases have error means that are with i n ± 1 mmHg. With taking the le vel of dispersio n of the e rrors in Table 1 and Table 2 into considera tion, it ca n be seen that t he sta ndard dev iations f or the m odeling and validation erro rs for B H intervals are all below 5 mmHg. This relatively small window of variatio n is also corrobor ated by rMSE va lu es that are shown in Table 3 and Table 4 . As can be seen f r o m the res ults sho wn i n these tables , the upper bou nd for t he dispe rsion of th e cross v alidation e rrors is larger than dispe rsion for m od el e rrors (i. e. 6.55 vs 5 .73 mmHg, respectively). This is somewhat expected as Cross Validation Er rors reflect the ability of the models in pre dict ing BP under t he co ndit ion d iffer ent fr om the co nditio n that model was derived for. In particu lar, the experimental protoc ol w as designed to exam ine the effect of successive bre ath hol ds o n the e stima tio n of BP . In future, we will be rep orti ng on the a nalys is of NB p ortio n of the exp eri ment al protocol. C om paring the rMSE values in Table 3 w ith t hose i n T able 4 shows that rMSE values ha ve a max m ean of approximately 7 mm Hg. Hence, if rMSE is used to gaug e the level of the error, for both Model Errors an d Cross Validati on Errors, an overall error of less than 7 mmHg can be expected. When compared with some of the previous ly repor ted techn iques, one finds that our results are com par able to techniques which used P TT i n esti mating B P fr om PPG signal s [15] . Th ese findi ngs show that AR MA model approach i s capable of trac king slo w fr eque ncy tre nd a nd also high fre que ncy hem odynamic cha nges of t he body an d exhibi t adequate accuracy for possible clini cal app lications . It is note d, ho wever, tha t it is unl ikely t hat a sin gle mo del would be able to es tim ate BP for m embers of all popul ation sectors from the PPG variations . The likely need for person - specific m odels ste ms f rom the fact that there is a wide variation in the physiolog ical syste ms involve d i n the co ntrol of blood pre ssure which inclu des res ponsiveness of the sympathetic nervo us system, mechanical, fluid mechanics, dynamical properties of the cardiovascular system, and metabolic rate . V. C ONCLUS ION The fi ndings of this pilot study demonstrate that estimating systolic and dia stolic BP from PPG measure ments usin g ARMA m odels can be a viable meth od for continu ous and non - i nvasi ve mea sure ment of ke y BP fo cal p oints in OS A subje cts w ith accuracy levels comparable to previous ly repo rt ed values . VI. R EFERENCES [1] H. Sekizu ka, K. Kida, Y. J. Akashi, K. Yoneyama, N. Osad a, K. Omiya, F. Miyak, "Relatio nship between sleep apnea sy ndrome and sle ep blood pre ssure in patients withou t hype rtens ion," Jour nal of Cardiology , vol. 55, no. 1, pp. 92 - 98, 2010. [2] M. J . Domanski, G. F . Mitchell, J. E . Norman, D. V . Exner, B. Pitt, M. A. Pfef fe r, "Inde pendent prog nostic i nform ation provide d by sphyg mom anom etric ally deter mine d pulse pressu re and mean arter ial p ressure in patie nts with lef t vent ricular dys functi on," Journal of American col lege of Cardiology , vol. 33, no. 4, pp. 951 - 958, 1999. [3] L. Pala niappan, L . A. Sim ons, J . Sim ons, Y. Fri edlande r, J . McCallum, " Comparison of Us efulness of Sy stolic, Diastolic, and M ean Bl ood P res sure and Pulse Pressur e as Predictors of Cardio vascular Death i n P atien ts ≥60 Years of Age, " Amer ican Jour nal of Cardiology , vol. 90, no. 12, pp. 1398 - 1401, 2002. [4] B. C. Tay lor, T. J. Wilt, H. G . W elch , "Impact o f Diasto lic and Sy stolic Blood Pressure on Morta lity : Im plicat ions for the Definition of “Norm al”," Journal of Ge neral I nterna l Medicin e, vol. 26, no. 7, pp. 685 - 690, 2011. [5] V. Kovacic, L . Roguljic, V . Kovacic, B . Bacic, T . Bosnja k, "Mean arter ial p ressure and pulse pressu re are associated with different clinical parameters in chro nic haemodial ysis patients," Journal of Human H yperte nsion, vol . 17, pp. 353 - 360, 2003. [6] E. C. Chua, S . J. Redm ond, G. McDa rby and C. Heneg han, "T owar ds using phot oplethy sm ogram am plitude to m eas ure blood pre ssure during sl eep," Annals of Biomedic al Enginee ring, vol. 38, no. 3, pp. 945 - 954, 2010. [7] H. Gesche , D. Gross kurth, G. Kuchler , A. Patzak , "Conti nuous blood pre ssure mea surem ent by using the pulse transit time : compar ison to a cuff - base d met hod," Europe an Journal of Applie d Physiology , vol. 112, no. 1, pp. 309 - 315, 2012. [8] H. Sch malgem eier, T. Bitter , S. Bart sch, K. Bullert , T. Fischb ach, S. E cke rt, D. Horstk otte, O . Oldenbur g , "P u lse trans it tim e: valida tion of blood pr essur e mea surem ent under positive airw ay pressure ventilation," Sl eep and Breathin g, vol. 16, no. 4, pp. 1105 - 1112, 2012. [9] R. Smith, J . Argod, J. Pepin, P. Levy , "Pulse tr ansit time: an appraisal of potential clinical applications," Thorax, vol. 54, no. 5, pp. 452 - 457, 1999. [10] L. Lj ung, Sys tem Identif icat ion: The ory for the us er, Se cond ed., Uppe r Saddle Rive r, NJ: Print ice Ha ll, 1999. [11] M. H. Perrott and R J. C ohen, A n Ef fic ient Approa ch to ARMA Modeling of Bio logical Sy stem s with Multiple Inputs and Del ays," IEEE Trans action on Biomedi cal Enginee ring , vol. 43, N o. 1, 1996 . [12] H. Akaik e, "Fitting Autoreg ressive Mod els For Prediction," Annals of th e Institute of Statistical Mathem atics, vol. 21, no . 1, pp. 243 - 247, 1969. [13] H. A kaik e, "On The Use of A Line ar Model For T he Identif ica tion of Feedbac k Sy stem s," Annals of the Ins titute of St atistic al Mat hem atics , vol. 20, no. 1, pp. 425 - 439, 1968. [14] B. P. Im holz, W. Wieling , G. A. van Montfra ns, K. H. Wesseling , "Fifteen y ears experien ce with finger art erial press ure m onitor ing: as sess ment of the t echnolog y," Cardiov asc Re s., vol. 28, no. 3, pp. 605 - 616, 1998. [15] A. Patzak , Y. Me nd oza, H. Gesche, M. Kon ermann , "Conti nuous blood pres sure meas urem ent using the pulse tran sit time : Comparison to intra - arterial measur ement, " Blood pre ss, vol . 24, no. 4, pp. 217 - 221, 2015.
Original Paper
Loading high-quality paper...
Comments & Academic Discussion
Loading comments...
Leave a Comment