Joint Acoustic and Class Inference for Weakly Supervised Sound Event Detection
Sound event detection is a challenging task, especially for scenes with multiple simultaneous events. While event classification methods tend to be fairly accurate, event localization presents additional challenges, especially when large amounts of l…
Authors: S, eep Kothinti, Keisuke Imoto
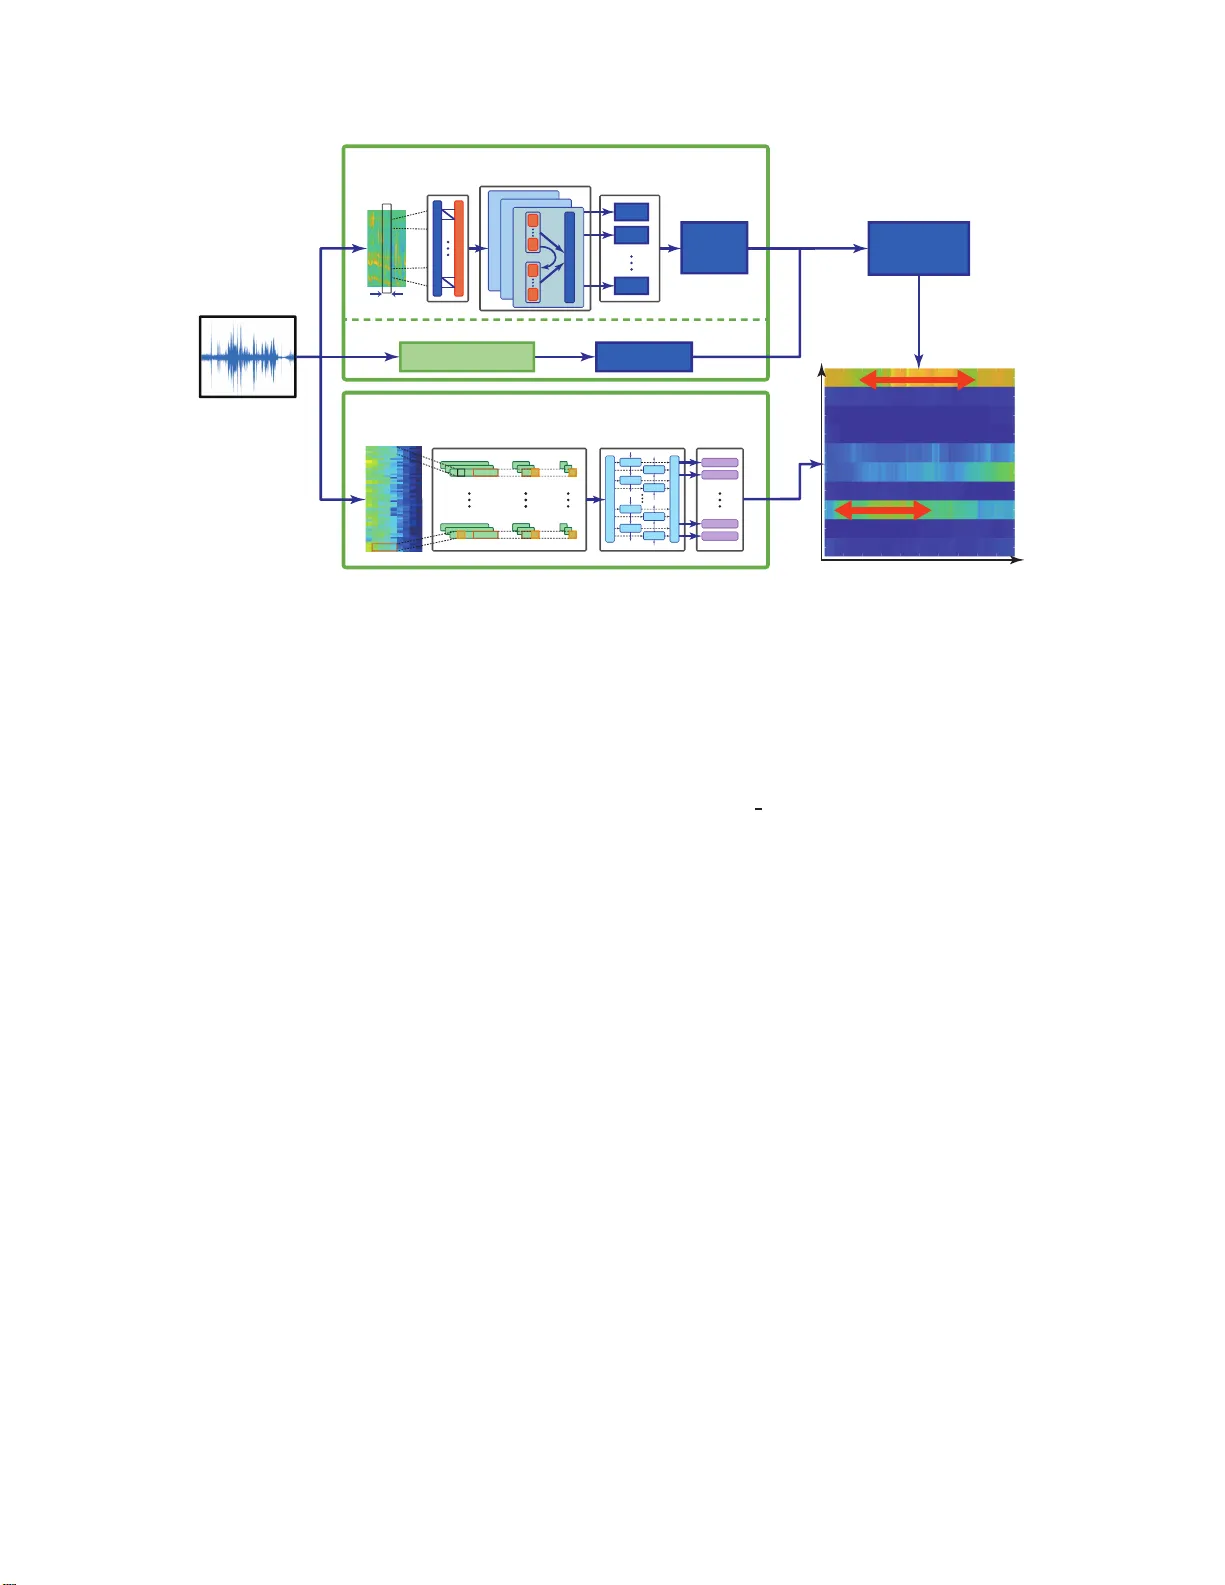
JOINT A COUSTIC AND CLASS INFERENCE FOR WEAKL Y SUPER VI SED SOUND EVENT DETECTION Sandee p K othinti 1 , K eisuke Imoto 2 , Debmalya Chakrabar ty 1 , Gr e gor y Sell 3 , Shinji W atanabe 1 , Mounya Elhilali 1 1 Department of Electrical and Computer Engin eering, Johns Hopkins Univ ersity , Baltim ore, MD, USA. 2 College of Information Science and Engineering, Ritsumeikan Unive rsity , Shi g a, Japan. 3 Human Language T echnology Center of Excellence, Johns Hopkins Univer sity , B altimore, MD, USA. ABSTRA CT Sound ev ent detection is a challeng ing task, especially for scenes with multiple simu ltaneous e vents. While e ven t classification meth- ods tend to be fairly accurate, e ven t localization presents ad ditional challenges, especially when large amounts of labeled data are not av ailable. T ask4 of the 201 8 DCASE challenge prese nts an e vent de- tection task that requires accuracy in both segmentation and recogni- tion of ev ents while providing only weakly labeled training data. Su- pervised methods can produ ce accurate ev ent labels but a re limited in e vent segmentation wh en training data lacks ev ent timestamps. On the other hand, unsupervised methods that model the acoustic prop- erties of the audio can produce accu rate even t boundaries but are not guided by the characteristics of e ven t classes and so und cate gories. W e present a hyb rid approach that combines an acoustic-dri ven e vent boundary detection and a supervised label inference using a deep neural network. This framewo rk lev erages benefits of both unsu- pervised and supervised methodologies and takes adv antage of larg e amounts of unlabeled data, making i t ideal for large-scale weakly l a- beled e vent detection. Compared to a baseline system, the proposed approach delivers a 15% absolute improvement in F-score, demon- strating the benefits of the hybrid bottom-up, top-down approach. Index T erms — Sound ev ent detection, unsupervised l earning, weakly labeled data, restricted Boltzmann mac hine, conditiona l re- stricted Boltzmann machine 1. INTRODUCTION Everyday so undscapes present a real challenge for aud io technolo- gies that seek to parse the changing nature of the scenes and detect relev ant e vents in the en vironment. With growing interest in smart de vices, smart assistants and interactiv e technologies, there are in- creased ef forts to de velop robust ambient sound an alysis systems able t o d etect and track d ifferent sound sources and identify even ts of interest. Parsing a scen e to identify important ev ents is a nontrivial task. Even humans exh ibit a notable degree of v ariability in detecting oc- currences of salient ev ents when presented with realistic busy scenes [1]. Machine audition has tackled the problem of sound eve nt de- tection by lev eraging labeled data that allo w machine learning al- gorithms to ‘learn’ characteristics of sound e vents, hence allowing the system to d etect them whene ver they occur [2]. T his sup ervised approach yields a reasonable performance espec ially in co nstrained settings where the nature of sound ev ents and background sounds This research was supported in part by Natio nal Institute s of Health grants R01HL133043 and U01A G058532 a nd Office of Nav al Research grants N000141612045 and N000141712736. is well captured by the labeled data av ail able for training [3]. In reality , h o wev er , a fully s upervised approach h as limit ed scalability especially when dealing with e veryday sound en vironments that can v ary drastically depending on t he setting and density of the sources present. Acquiring large amounts of fully-labeled data in uncon- strained env ironments is practically infeasible. The challenges of provid ing supervised data for e vent detection stem from t he need to not only identify sound ev ents in a scene, but also accurately label timestamps of occurrence of such events. This, in turn, raises the question of potential benefits of unla- beled data to augment supervised training methods. There is a grow- ing number of corpora t hat represent v arious urban soundscapes, do - mestic or w orkplace en vironments as well as every day sounds (e.g. [4, 5]). The ab undance of such labeled datasets can enrich our ability to tackle ambient sound analysis provided the right kinds of tools are av ailable to take advan tage of both labeled and unlabeled data. In its latest iteration, the DCASE 20 18 task4 challenge focu sed on scenar- ios with a large amount of unlabeled data along wi th a small set of labeled data [6]. T he av ail abili ty of both d ata sets c an be le veraged in a number of wa ys. A num ber of app roaches have been proposed to sup plement supervised training using unlabeled data by mean s of data augmentation, which can result in impro ved training of the ma- chine learning systems as well as more robust e vent detection accu- racies [7, 8, 9]. In pa rallel, unsupervised techn iques have also been proposed to infer characteristics of sound even ts hence taking into account the dynamics of sound classes [10, 11] . In the current wo rk, we ai m to le verage both the po wer of ma- chine learning using a combination of labeled and unlabeled data to learn the characteristics of ev ent classes, as well as our knowledg e of the physical and p erceptual att ributes of sounds that can help guide the segmen tation of sound ev ents as the y occur in a scen e. The lat- ter app roach emplo ys principles from b ottom-up auditory attention models where we kno w changes in sound structure are flagged by the human perceptua l sy stem as salient ev ents t hat attract our atten- tion for further processing [1, 12, 13]. Detecting the onset and of f - set of these e vents of interest prov ides an anchor to our ev ent label- ing system that eliminates discontinuities in ev ent labels as well as minimizes false identification from our supervised system, resulting in notable impro vemen t o ver a p ure labe l-guided classification sys- tem. This work is an extension to our su bmission to DCASE 2018 [14], with more detailed analysis o f subsystems and improved per- formance on the ev aluation data. Section 2 provides an overvie w of related ev ent d etection systems, and focuse s on prior w ork t hat h as lev eraged deep learning to tackle the challenge of ev ent detection, much in the same vein as the proposed model. Secti on 3 presents the proposed system for e vent detection and details the interplay between a bottom-up, acoustic-dri ven analysis and top-do wn su per- vised approach. The expe rimental setup i s described in S ection 4 while the sy stem performance and comp arison to baseline systems is presented in Section 5. Finally , Section 6 discusses concluding remarks and future directions. 2. RELA TED WORK A large body of work related to ev ent detection systems has focused on innov ations to feature representations t hat provide a suitable task- relev ant mapping of the raw acoustic si gnal (e.g. [ 15]). More re- cently , progress in deep learning methods has provided a notable jump in performan ce ov er con ventiona l modeling methods for ev ent detection systems (see [2, 16] for a revie w). All best performing systems i n e ve nt detection tasks in DCASE 201 6 [17] and DCASE 2017 [18] include some f ormulation based on deep neural networks (DNN) with variou s flavo r . While such DNN systems are gener- ally quite powerful for t heir specific tasks, their performance is often limited to the e xact co nfiguration of the task itself. In [18], conv o- lutional r ecurrent neural networks were used in a semi-supervised setting t o provide notable performance impro vements in segment- based ev aluations, but they p erformed rat her poo rly on e vent-ba sed e va luations in a similar task for DCAS E 2018 [6]. Generati ve mod els such as Restricted Boltzmann Machines (RBMs) and Conditional RBMs (cRBMs) ha ve also been used to model audio scenes in high-dimen sional representation s [19]. These models follo w in the tradition o f exp loring robust feature repre- sentations for audio signals and can in fact reliably track multiple audio streams by encod ing their regu larities ov er new embedd ing spaces. In [20], mixtures of cRBMs were sho wn to predict unex- pected ev ents in a noisy subway station with high precision by locat- ing time wind ows that deviate from an underlyin g statistical struc- ture of the scene. In the present study , we employ similar models based on RBMs in order to le verag e their generativ e nature with a focus on onset detection unlik e a discriminative method [21]. 3. PROPOSED ARCHITECTU RE The proposed system combines a bottom-up (acoustic-driv en) and top-do wn (label-gu ided) approa ch to de tect soun d e ven ts. Fi gure 1 delineates the proposed methodology with an example. The bottom- up approach relies solely on acoustic characteristics of the audio signal to flag chang es over time as captu red in a high-dimensional mapping of t he signal. The top-down approach is a supervised label- driv en characterization of the sound labels deriv ed from a DNN. T he outputs are then com bined with the bottom-up subsy stem providing guidance to the windo ws of interest while the top-do wn subsystem characterizes the labels for these windows. 3.1. Event boun dary detection Event b oundaries are identified in a purely acoustic-driv en manner by tracking chang es in acoustic properties of the input audio. W e em- ploy a gen erativ e frame work to extract a rich mapping of the acoustic wa veform that captures both local and glo bal spectro-temporal regu- larities in the signal. The output of this representation is a ri ch array of activ ations in a high-dimensional space which allows tracking au- ditory even ts with different spectro-temporal characteristics. This acoustic analysis is structured as a hierarchical system with 3 main stages as sho wn the top block o f figure 1. First , a 1 28 chan- nel biomimetic auditory spectrogram S ( t, f ) is extracted from the input audio wit h integration over 10ms and a frame-shift of 10ms [22]. 3 consecutiv e frames of S ( t, f ) are st acked to produce a tem- poral contex t of 30ms and are used as input to a Restr i cted Boltz- mann Machine (RBM) [19, 23]. The RBM, t rained using Contrastiv e Div erge nce (CD), is a generative model and is expected to capture local spectro-temporal dependencies of the incoming audio signal. Gaussian-Bernoulli units are used to model visible-hidden connec - tions. After training, RBM weights ( W ) and hidden bias ( b ) are used to transfo rm input data ( v ) as gi ven in (1). h i = X j v j W j i + b i (1) The n ext stage in the acoustic map ping further processes RBM outputs ( h ) using an array of 10 conditional RB Ms [24, 25]. The cRBM array further analyzes the output of the first st age along a range of temporal contexts from 30ms to 300ms, hence capturing global dynam ics in the signal and tracking e ve nts with different temporal charac teristics. The cRBM layer also emplo ys Gaussian- Bernoulli visible-hidden units and is trained using CD. The weights ( W , A ) and biases ( b ) of the cRBM array are used as an af fine transform to generate a final high-dimension al representation of the acoustic signal, as given in (2). b t i = X j h t − 1 j A j i + b i c t i = X j h t j W j i + b t i (2) The activ at i ons across the nodes of each cRBM network are fur- ther processed using Principal Compone nt Analysis (PCA) to get directions of maximal v ariance and reduce dimensionality to 16 di- mensions per cRBM [26]. The P CA outputs are then pro cessed through fi r st -order difference and smoothe d using a moving aver- age with window length in versely proportional to the cRBM con- text length. T he smoothed deriv atives from all the dimensions are summed t o produce a measure of activity in time. W e fl ag local maxima in this activity to indicate notable changes in the acoustic signal and he nce a likely index of incre ased a coustic ev ent acti vity . The closest preceding sample at 25% of the detected peak is marked as the o nset point. In parallel, ev ent of fsets are an alyzed using the short term en ergy ( S TE) of the audio signal. STE i s computed u s- ing a 2 0ms wind ow and i s thresholded to locate low-acti vity points immediately following the detected onsets from the upper branch. These low-acti vity points paired with corresponding onsets form the e vent boundaries. 3.2. Event labeling T o labe l the aco ustic e ven t detected by t he bottom-up approach, we employ a deep neural network trained t o classify gi ven sound classes. This neural network o utputs a posterior of acoustic e vents for each frame, which is combined with t he even t boundary detection results for the class inference of aco ustic e vents. 3.2.1. Con volutional recurr ent neural network For the classification of acoustic eve nts, we apply a con vo lutional recurrent neural netw ork (CRN N ) , which is used as the baseline sys- tem for task 4 of DCA S E 2018. This is depicted in the bottom block of fig. 1. T he acoustic features used in t his system consist of 64- dimensional log mel-band energy extracted in 40 ms Hamming win- do ws with 50% o verlap. The log mel-band ener gy is then fed to the CRNN, which has three 2-D con volutiona l l ayers and then a layer Audio Event labeling Event boundary detection Onset detection Offset detection Mel-band energy (500×64dim.) GRU GRU GRU GRU GRU GRU GRU GRU BiGRU (1 layer) Dense (500×10units, sigmoid) CNN (3 layer, 1 × 3 convolution , ReLU) Maxpooling Maxpooling Maxpooling Thresholding Combine onset-offsets Short term energy Spectrogram RBM 10 CRBMs 30ms Boundarie s Posterior ogram Time Event Offsets Onsets Posterior s Peak detection PCA PCA PCA Present Past τ = 300ms τ = 30ms Speech Dishes Fig. 1 . P roposed system for acoustic ev ent detection. The system consists of 2 main components that operate i n parallel: (i) the ev ent boundary detection (top branch) which operates as a purely acoustic-based un supervised analysis and yields time stamps of onsets and offsets of e vents of i nterest; and (ii ) the even t labeling (bo ttom branch) which is a supervised network trained to provide probabilistic labels of ev ents in the input audio. of bi-directional gated recurrent un its (BiGR U) followed by a dense layer with sigmoid activ ati on to compute posterior probabilities of the d ifferent sounds classes. Pooling alon g the time axis i s used in training wi th the segmen t-lev el labels, but i s omitted for inference i n order to yield frame-level estimations. 3.2.2. L abel infer ence An acoustic ev ent label is gi ven to the unlabeled ev ent by calculating an average posterior of each acoustic even t in the active duration. The labels are chosen based on a maximu m po sterior cri terion. An examp le of the labeling process is shown in fig. 1 . 4. EXPERIMENT AL SETUP 4.1. Dataset The dataset used to test this system consists of the data provided for T ask4 of the DCASE Challenge 2018. It i s a subset of Audioset drawn from Y outube videos and consists of various sound classes occurring in domestic conte xts [5]. Training data includ es 1578 au- dio files labeled at the segment level (referred to as weak ly labe led data) a long with 14,412 unlabeled in-d omain 399 99 out-of-domain files. T est data consists of a dev elopment set (Dev) with 2 88 audio files and an ev aluation set (Ev al) with 880 audio files. T est d ata is annotated wi th time boundaries for each labeled e vent. T est files can hav e more than one e vent o f the same or different class with some e vents e ven o verlapp ing with other ev ents. In our system, we used only weakly labeled and unlabeled in-domain training data for both the unsupervised and supervised models. 4.2. Evaluation metric Event detection is ev aluated e vent-by -ev ent using the mac ro average and micro av erage of F-scores. Macro averag e is computed as the av erage of class-wise F-sco res and micro a verag e is the F-score o f all ev ents irrespecti ve of classes. Error rate (ER) is used as a sec- ondary metri c to assess errors in terms of insertions, deletions, and substitutions. sed e va l toolbox [27] is used to compute F-scores and ER. Onsets are ev aluated with a collar tolerance of 200ms. T olerance for of fsets is computed pe r e ven t as the maximum of 200 ms or 20% of ev ent length. An ev ent is considered to be a hit only when the predicted label matches with the ground truth and the even t bou nd- aries correspond t o the an notated boundaries. Hence any mismatch in either the labels or boundaries will result in a false positiv e and a false negati ve. 4.3. Baseline system The baseline system is a CRNN with 3 CNN layers and 1 BiGR U layer , trained in two stages. During the first stage, weakly labeled data i s used for training with an objecti ve of predicting the label at clip lev el. The fi r st trained model is used to define labels for the unlabeled in-domain data, wh ich is then used in the second stage of training. Training progress is monitored using a held-out validation set. During the first stage of training, 20% of weakly labeled data is used as the v alidation set and during the second stage of training, the entirety o f t he we akly labeled data is used as the v alidation set. 64-dimensiona l log Mel-band magnitud es are used as input features and the whole sound clip is g iv en as the input to the CRNN which uses 2-D con volution in ti me and frequency . During test time, strong labels are assigned based on the posterior probabilities and smoothed using a median filter of length 1s. 4.4. System training In the proposed system, both bottom-up and top-do wn subsystems are trained independently . The RBM-cRBM model for ev ent bound- ary detection is trained using weakly labeled and unlabe led in- domain training data. The number of hidde n units is fi xed at 350 for the RBM an d 300 for the cRBM mode ls. Both models are trained using a contrastiv e d iv ergen ce-based g radient descent wit h 10 s am- pling steps. For the even t labeling subsystem, we compare 3 v ariants of the top-do wn module described abov e in Section 3.2.1. In System 1, event labels are predicted w i th a CRNN trained using only the weakly labeled data. In System 2, the CRNN is t rained using weakly labeled data (1,578 clips) and augmented data (1,080 clips) which are generated by mixing multi ple weakly labeled clips. In Systems 1 and 2, the number of cha nnels, k ernel size, stride an d pooling size in the con volution al layers are { 128, 128,192 } , { 1 × 3, 1 × 3, 1 × 3 } , { 1, 1, 1 } , and { 1 × 8, 1 × 4, 1 × 2 } , and the number of GR U units is 64. System 3 uses predictions from t he DCASE 2018 baseline model for T ask4. An ensemble system uses majority vote on predictions from Systems 1-3. All parameters are tuned to max imize the performance on the de velop ment set. 5. RESUL T S T able 1 com pares the performance of the propos ed systems wi th the baseline system for both Dev a nd Ev al sets. As noted in the t able, the proposed metho d impro ves significantly o ver the baseline mode l in terms of F -score and error rate. The Ensemble system sho ws t he best performance and improv es over the baseline by 15.18% on Dev and 14.80% on Eval set. Both deve lopment and ev aluation sets yield similar performance improvemen ts across all systems, validating the generalizability of the proposed method. Looking closely at the detection scores, S ystem 3 highlights the contribution s of the acoustic-driv en branch of the proposed system relativ e to the baseline system, since System 3 in fact utilizes the posteriors from the baseline system itself. It i s also worth noting that bo th System 1 and System 2 are trained only using the weakly- labeled dataset. Their performance seems to indicate that labels de- riv ed from weakly labeled data are more accurate. T able 1 . F-score and error rate in eve nt-based metrics Method Dev Eval F-score Error rate F-score Error rate Baseline 14.87% 1.52 10.80% 1.77 System 1 29.31% 1.40 23.58% 1.25 System 2 29.69% 1.44 23.88% 1.34 System 3 27.20% 1.46 23.74% 1.21 Ensemble 30 .05% 1.36 25.40% 1.19 W e look closely at the system performance across the dif ferent sound classes present in the dataset. T able 2 compares the perfor- mance for individual c lasses on De v an d Ev al sets. T o analyz e the performance for d ifferent classes, we sep arate the e vents into small duration (av erage duration ≤ 2s) and long duration (average d ura- tion > 2s) ev ents. This analysis sheds l i ght on an interesting pattern. The proposed system appears to perform better compared to baseline for classes wi th smaller duration (marked with * in table 2); whereas it does not yield any notable improv ements relative to baseline on longer duration e vents. This can be attributed to two factors. Fi r stly , e vent boundaries detected using our system are more accurate for smaller duration even ts a s these e vents do not hav e overlapp ing ac- tivity from other ev ents. The acoustic-dri ven analysis does in fact track t he st atistical r egularity of the incoming signal, hence allowing it to detect deviations in this regularity . The presence of o verlap- ping ev ents weakens the efficacy of this tracking process and sub- sequently the ef fecti veness of bou ndary detec tion on longer e vents. Secondly , the tolerance for error in of fset is defined to be higher for longer ev ents which minimizes the impact of boundary errors. T able 2 . Class-wise F- score (* marks short-duration eve nts) Class Dev Eval baseline ense mble baseline ensemble Alarm/Bell* 5.0 34.9 4.8 4 3.5 Blender 17.8 20.3 12.7 24.0 Cat* 0.0 31.2 2.9 21.9 Dishes* 0.0 17.8 0.4 12.7 Dog* 0.0 48.1 2.4 28.9 Electric shaver 35.1 22.6 20.0 30.5 Frying 29.4 10.5 24.5 0.0 Running water 10.3 33.3 10.1 11.6 Speech* 0.0 36.2 0.1 34.9 V acuum cleaner 51.1 45.5 30.2 45.8 In order to further examin e the contrib ution of the acoustic- driv en analysis to the overall e ven t detection system, we further an- alyze the performance of different components of the proposed sys- tem by looking at indiv idual modules in the pipeline. T able 3 shows performance of onset detection, offset detection, onset-offset com- bination and finally o ve rall system performance. For this analysis, we computed F-score only on the corresponding annotation. For ex- ample, for onset detection, we compute F-score excluding offse t and labels a nd fo r onse t-offset, we exclude labels. This c omparison in- dicates that e vent labeling is poor in classifying the detected eve nts, which deteriorates the ov erall performance significantly . W e believe this gap can be closed by designing classificati on systems that are better at classifying the se gments of detected even ts. T able 3 . F-scores (Macro av erage for dif ferent sub systems) Metric Dev(F%) Eval(F%) Onset only 62.35% 59.97% Offset only 59.67% 54.10% Onset+Of fset 47.07% 41.66% Onset+Of fset+Label 30.05% 25.40% 6. CONCLUSION In t his work, we propose a segmentation and recognition method for sound e vent detection based on joint unsupervised and semi- supervised methods. This approach combines acoustic-dri ven e vent boundary detection and supervised acoustic even t classification to annotate sound e vents in complex acoustic scenes. One of the ad- v antages of a parallel analysis of the incoming signal is to le ver - age not on ly known i nformation about sound e vent classes ( as cap- tured by dataset labels) bu t also the inherent structure of t hese classes that distinguishes them from other classes. The use of a generati ve frame work in the form of RBM -cRBM networks en ables th e tr ack- ing of these statistics in an appropriate embedding space which is subsequen tly used to flag dev iations corresponding to new even ts. An interesting follo w-up direction is to explore common alities in these generativ e embedding spaces and those generated by t he ev ent- labeling model which is constrained by the sound classes. 7. REFERENCES [1] N. Huang and M. E lhilali, “ Auditory Salience Using Natural Soundscapes, ” The Journ al of t he A coustical Society o f Amer- ica , vol. 14 1, no. 3, p. 2163, mar 2017. [2] T . V irtanen, M. D. Plumbley , and D. Ellis, Computational anal- ysis of sound scenes and even ts . Springer , 2018. [3] E. C akir , G. Parascandolo, T . Heittola, H. Huttunen, and T . V irtanen, “Con volutional recurrent neural networks for p oly- phonic sound e ven t detection, ” IEEE/ACM T ransa ctions on Audio, Speech an d Langua ge Pr ocessing: Special issue on Sound Scene and Event Analysis , vol. 2 5, no. 6, pp. 1291–1303 , June 2017. [4] J. Salamon, C. Jacoby , and J. P . Bell o, “ A dataset and taxon - omy for urban sound research, ” Proc. ACM Interna tional Con- fer ence on Multimedia ( A CMMM ), pp. 1041– 1044, 2014. [5] J. F . Gemmek e, D. P . W . El lis, D. F reedman, A. Jansen, W . Lawrence , R. C . Moore, M. Pl akal, and M. Ritter , “ Audio set: An ontology and human-labeled dataset for audio e vents, ” Proc. IEEE International Con fer ence on Acoustics, Speech and Signal Pr ocessing ( I CASSP ), pp. 776–78 0, 2017. [6] R. Serizel, N. Turpault, H. Eghbal-Zadeh, and A. Parag Shah, “Large-Scale W eakly Labeled Semi-Supervised S ound Event Detection in D omestic En vironments, ” Jul. 2018, submitted to DCASE2018 W orkshop. [7] Z. Zhang an d B. Schuller , “Semi-supervised learning helps in sound e vent classification, ” Proc. IEEE International Confer- ence on Acoustics, Speech and Signal Pr ocessing ( ICASSP ), pp. 333–336, 2012 . [8] B. Elizalde, A. Shah, S. Dalmia, M. H. Lee, R. Badlani, A. Ku- mar , B. Raj, and I. Lane, “ An approach for self-training au- dio even t detectors using web data, ” in Signal Pr ocessing Con - fer ence (EUSIPCO), 2017 25th Eur opean . IEEE, 2017, pp. 1863–1 867. [9] W . Han, E. Coutinh o, H. Ruan , H. Li, B. Schuller, X. Y u, and X. Zhu, “S emi-supervised acti ve learning for sound classifica- tion in hybrid learning en vironments, ” PloS one , v ol. 11, no . 9, p. e0162075, 2016 . [10] J. Salamon and J. P . Bello, “Unsupervised feature learning for urban sound classification, ” Proc. IEEE Internation al Confer- ence on Acoustics, Speech and Signal Pr ocessing ( ICASSP ), pp. 171–175, 2015 . [11] M. Espi, M. Fujimoto, K. Kinoshita, and T . Nakatani, “Exploit- ing spectro-temporal l ocality in deep learning based acoustic e vent detection , ” EUR ASIP J ournal on Aud io, Speech, and Music Pro cessing , vol. 2015, no . 1, p. 26, Sep 2015. [Online]. A v ailable: https://doi.or g/10.1186/s13 636- 015- 0069 - 2 [12] K. Kim, K. H. Lin, D. B. W alther , M. A. Hasegaw a-Johnson , and T . S . Huang, “ Automatic detection of auditory salience with optimized linear filters derive d from human annotation, ” P attern Reco gnition Letters , no . 38, pp. 78–8 5, 2014. [13] E . M. Kaya and M. Elhilali, “Modelling Auditory At t ention, ” Philosophical tr ansactions of the Royal Society of Londo n. Se- ries B, Biological sciences , vol. 372, no. 1714, p. 2016010 1, 2017. [14] S . Kothinti, K. Imoto, D. Ch akrabarty , S. Greg ory , S. W atan- abe, and M. Elhilali, “Joint acoustic and class inference for weakly supervised sound ev ent detection, ” DCASE2018 C hal- lenge, T ech. Rep., September 2018. [15] J. Schroder , S . Goetze, and J. Anemller , “Spectro-temporal gabor filterbank features for acoustic even t detection, ” IEEE/ACM T rans actions on Audio, Speec h, and Langua ge Pr ocessing , vol. 23, no. 12, pp. 2198–2208 , D ec 2015. [16] A. Mesaros, T . Heit tola, E. Benetos, P . Foster , M. Lagrange, T . V irtanen, and M. D. Plumble y , “Detection and classification of acoustic scenes and ev ents: Outcome of the dcase 2016 chal- lenge, ” IE EE/ACM Tr ansactions on Audio, Speech, and Lan- guag e Pr ocessing , vol. 26, no. 2, pp. 379–393, Feb 201 8. [17] S . Adav anne, G. Pa rascandolo, P . Pertil ¨ a, T . Heittola, and T . V irtanen, “Sound ev ent detection in multichannel audio using spatial and harmonic features, ” CoRR , vol. abs/1706.02 293, 2017. [18] Y . Xu, Q. Ko ng, W . W ang, and M. D. P lumbley , “Surrey - CVSSP system for DCAS E 2017 challenge task4, ” CoRR , vol. abs/1709.00 551, 2017. [19] G. E. Hinton, “Learning multi ple layers of representation, ” T rend s in Cognitive Sciences , vol. 11, no. 10, pp. 428–434 , 2007. [20] D. Chakra barty an d M. Elhilali, “ Abnormal sound e vent detec- tion using temporal trajectories mixtures, ” Proc. IE EE Interna- tional Confer ence on Acoustics, Speec h and Signal Pro cessing ( ICASSP ), pp. 216–220 , March 20 16. [21] T . Hayashi, S. W atanabe, T . T oda, T . Hori, J. L . Roux, and K. T akeda, “Duration-controlled lstm for polyph onic sound e vent detection, ” IEEE/ACM T ransactions on Audio, Speech, and Languag e Proc essing , vol. 25, no. 11, pp. 2059–20 70, N ov 2017. [22] T . Chi, P . Ru, and S. A. Shamma, “Multiresolution spectrotem- poral analysis of co mplex sounds, ” The J ournal of the Aco usti- cal Society of America , v ol. 118, no. 2, pp. 887–906, 2005 . [23] G. E. Hinton, “A P ractical Guide to Training Restricted Boltz- mann Machines, ” in Neural Networks: T ricks of the T rade , 2012, v ol. 7700, pp. 599–619. [24] G. W . T aylor, G. E. Hinton, and S. T . Ro weis, “Modeling h u- man motion u sing binary latent v ariables, ” Proc. Advan ces in neura l information pr ocessing systems ( NIPS ), pp. 1345–13 52, 2007. [25] G. W . T aylor , L. Sigal, D. Fl eet, and G. E. Hinton, “Dynam- ical binary latent v ari able models for 3d human pose track- ing, ” Proc. IEEE Confere nce on Computer V ision and P attern Recognition ( CVPR ), pp. 631– 638, 06 2010. [26] K. P earson, “LIII. on lines and planes of closest fit to systems of points in space, ” The London, Edin bur gh, and Dublin Philo- sophical Magazine and J ournal of S cience , v ol. 2, no. 11, pp. 559–57 2, 1901. [27] A. Mesaros, T . Heittola, and T . V irtanen, “Metrics for poly- phonic sound even t detection, ” Applied Sciences , vol. 6, no. 6, pp. 1–17, 2016.
Original Paper
Loading high-quality paper...
Comments & Academic Discussion
Loading comments...
Leave a Comment