Precise Detection of Speech Endpoints Dynamically: A Wavelet Convolution based approach
Precise detection of speech endpoints is an important factor which affects the performance of the systems where speech utterances need to be extracted from the speech signal such as Automatic Speech Recognition (ASR) system. Existing endpoint detecti…
Authors: Tanmoy Roy, Tshilidzi Marwala, Snehashish Chakraverty
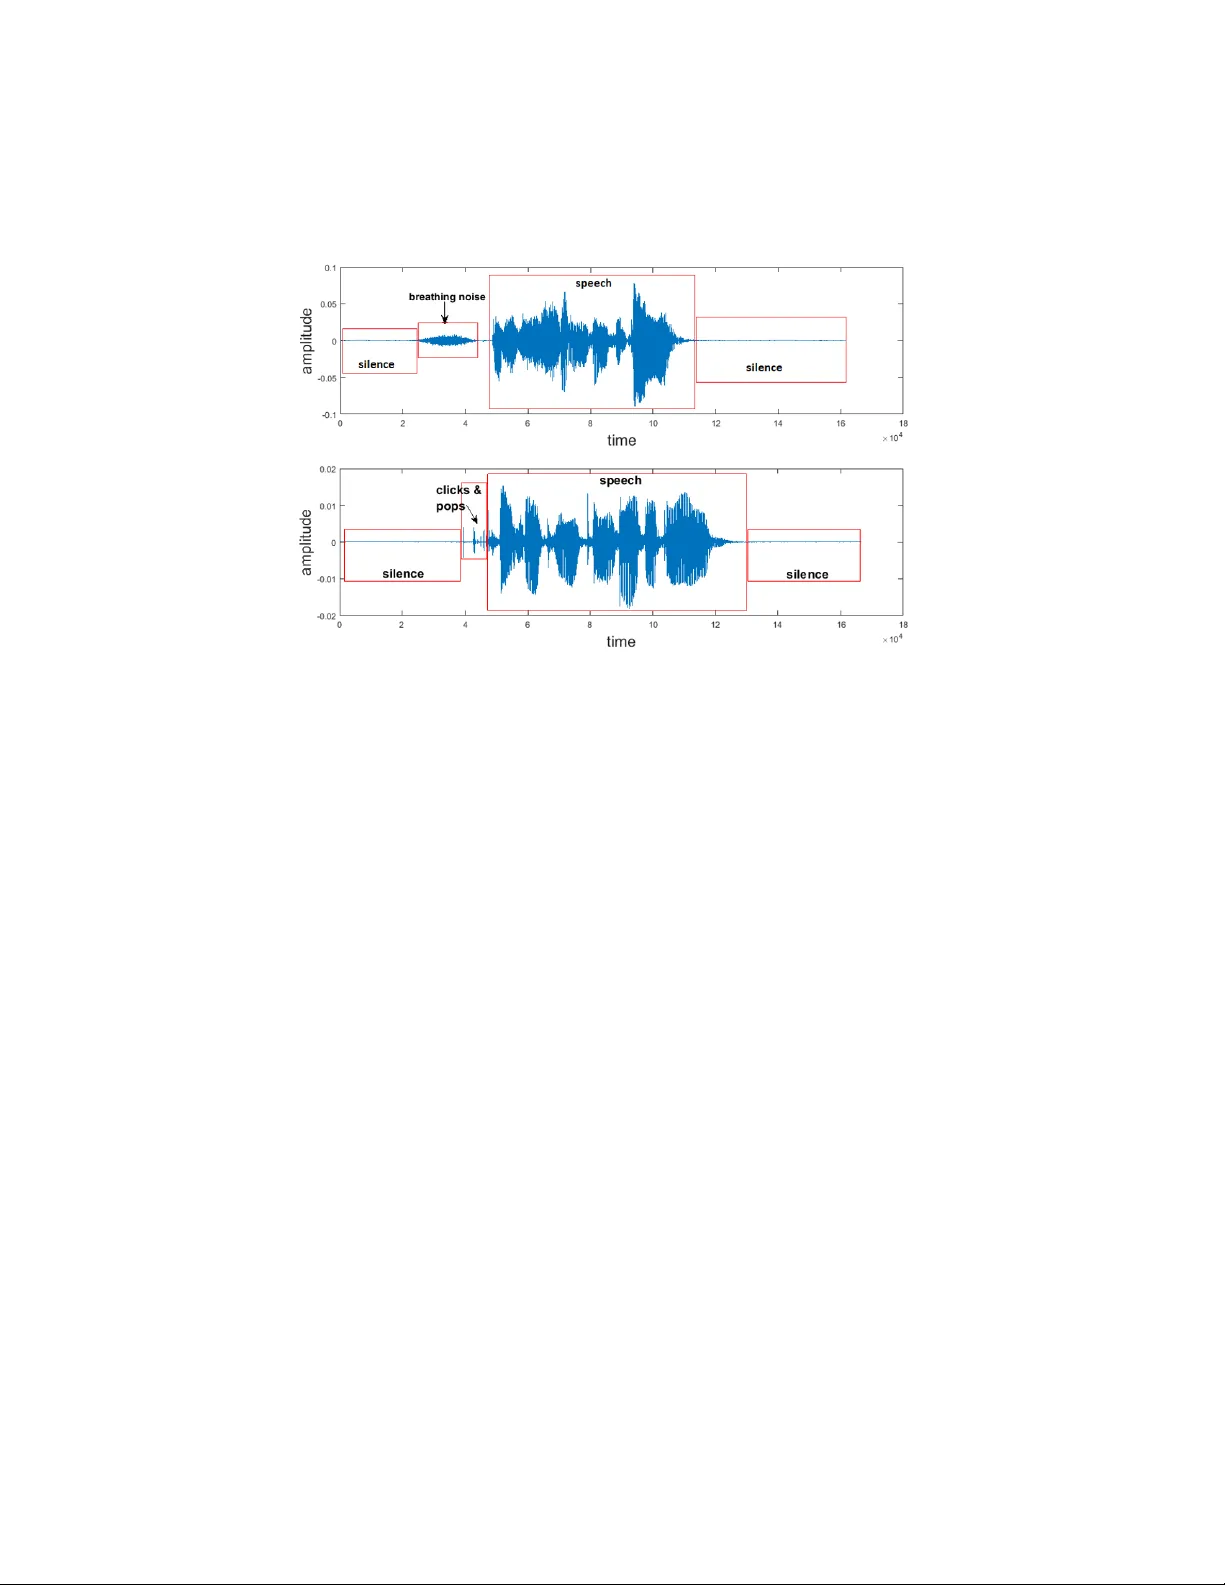
Precise Detection of Sp eec h Endp oin ts Dynamically: A W a v elet Con v olution based approac h T anmo y Ro y Ele ctric al & Ele ctr onic Engine ering, University of Johannesbur g, South Afric a Tshilidzi Marw ala Ele ctric al & Ele ctr onic Engine ering, University of Johannesbur g, South Afric a Snehashish Chakra v erty Dep artment of Mathematics, National Institute of T e chnology R ourkela, India Abstract Precise detection of sp eec h endp oin ts is an imp ortan t factor whic h affects the p erformance of the systems where speech utterances need to b e extracted from the speech signal such as Automatic Sp eec h Recognition (ASR) system. Exist- ing endp oint detection (EPD) metho ds mostly uses Short-T erm Energy (STE), Zero-Crossing Rate (ZCR) based approac hes and their v ariants. But STE and ZCR based EPD algorithms often fail in the presence of Non-speech Sound Ar- tifacts (NSAs) pro duced b y the speakers. Algorithms based on pattern recog- nition and classification techniques are also prop osed but require lab eled data for training. A new algorithm termed as W a velet Con v olution based Sp eec h Endp oin t Detection (WCSED) is prop osed in this article to extract sp eech end- p oin ts. W CSED decomp oses the sp eech signal into high-frequency and low- frequency comp onen ts using wa v elet conv olution and computes entrop y based thresholds for the tw o frequency comp onen ts. The low-frequency thresholds are used to extract v oiced sp eec h segments, whereas the high-frequency thresholds are used to extract the unv oiced speech segmen ts by filtering out the NSAs. Email addr esses: tanmoy@tanmoy.in (T anmoy Roy), tmarwala@gmail.com (Tshilidzi Marwala), sne_chak@yahoo.com (Snehashish Chakra vert y) Pr eprint submitte d to Communic ations in Nonline ar Scienc e and Numeric al SimulationApril 18, 2018 W CSED does not require any lab eled data for training and can automatically extract sp eec h segments. Experiment results sho w that the proposed algorithm precisely extracts speech endp oints in the presence of NSAs. Keywor ds: Sp eec h Endpoint Detection, Sp eec h Recognition, W a v elet Con volution, Contin uous W a v elet T ransform, P attern Recognition 1. In tro duction Sp eec h endp oin ts are the b eginning and end p oints of the actual sp eec h utterance within the sp eech signal. Speech Recognition and its related field of researc h has come a long w a y and has matured enough. But still, precise detection of speech endp oin ts is an imp ortant factor affecting the recognition p erformance of Automatic Sp eec h Recognition (ASR) systems. Lamel & Rabi- nar (1981) explained the imp ortance of accurate endpoint detection in speech recognition and has shown that the sp eech recognition p erformance dramat- ically reduces due to an error in endp oint detection. Background noise and other sound artifacts whic h are not the part of the actual sp eec h utterance ex- ists in the sp eech recordings. When a recording with noise is used for analysis, the presence of those noise distorts the results. Also, the silent sections b efore and after the actual utterance are not required in the analysis for most of the cases, thus the requirement for precise extraction of the sp eec h utterance b y separating it from those noises and silence sections. Digitally recorded speech can be acquired from differen t sources suc h as tele- phone recordings, studio recordings, conv ersations recorded in the natural en- vironmen t. All these recordings con tain v arious noise dep ending on the record- ing en vironment. Even the recordings in nearly noise-free environmen t contain sound artifacts produced b y the speaker during the recording. Examples of suc h sound artifacts are mouth clic ks and p ops, hea vy breathing and lip smac king. In this article, these sound artifacts are referred as Non-sp eech Sound Artifacts (NSAs). These NSAs need to b e filtered out in most of the sp eech based ap- plications for estimating go o d results because their effect is similar to noise in 2 Figure 1: A speech signals containing breathing noise and mouth clicks and p ops along with leading and trailing silence section. systems lik e ASR. Though the quest to find a solution for End-Poin t Detection (EPD) problem started a long time ago in the 1970s, the searc h is still on b ecause the precise solution is still not found which can cater all the difficult scenarios. Figure 1 sho ws examples of NSAs present in speech recordings suc h as breathing noise, mouth clic ks, and pops. Existing EPD methods frequently use Short-T erm Energy (STE) and Zero- Crossing Rate (ZCR) based metho ds and their v arian ts. Rabiner & Sambur (1975) proposed a simple and fast algorithm to determine endpoints based on energy and ZCR. Sa vo ji (1989) also used STE and ZCR as features and their prop osed algorithm uses the kno wledge-based heuristics for speech classification. Lamere et al. (2003) utilized the STE based approach with three energy thresh- olds, t wo for b eginning and one for ending. Energy and ZCR based algorithms w ork w ell when there is no background noise and no NSA type noise exists in the sound recordings. Constant background noises presen t in speech utterances 3 Figure 2: This figure shows how STE and ZCR plots lo ok like in the presence of heavy breathing noise. F rom the plot its clear that there is not muc h visible distinction b et ween the v alues of STE and ZCR in sp eec h segmen t and noise segment. can b e filtered out using a suitable noise reduction algorithm for sound. But segregating NSAs, presen t in the sp eech recordings, is a c hallenging task b ecause STE and ZCR based attributes are not enough to segregate speech from NSAs. It is observed that presence of NSAs n ullifies the distinction in v alues for STE and ZCR for sp eec h and non-sp eec h sections (see Fig.2). Also, Lamel & Ra- binar (1981) ha v e shown that energy based explicit approaches for EPD failed in the presence of NSAs. While using a heuristic approach they ha v e classified the EPD problem into implicit, explicit and hybrid with resp ect to the sp eec h recognition system. In explicit approac h, EPD task is an independent module in the sp eec h recognizer, whereas in implicit approach there is no separate stage in the recognizer for EPD. The Hybrid approach has an EPD mo dule at the initial phase but after recognition, the initial EPD results of EPD are up dated. So, when NSA type noises are present in speech utterances, STE and ZCR based approac hes are not suitable for solving the EPD problem. Researc hers hav e applied pattern recognition (PR) and mac hine learning (ML) tec hniques to solv e EPD problem. Classification tec hniques suc h as Sup- 4 p ort V ector Machine (SVM), Hidden Mark ov Mo del (HMM), Neural Netw ork and other suitable techniques for sequence classification are extensively used in differen t algorithms. A tal & Rabinar (1976) considered pattern recognition approac h using Energy of the signal, ZCR, Auto Correlation co efficien t, First predictor co efficient, Energy of the prediction error as feature set. They also men tioned the limitations of using PR tec hniques. First of all, the algorithm needs to b e trained for particular recording conditions. Second, manually lo- cating v oiced, unv oiced and silence for preparing training data is a tedious and time-consuming process. Hidden Mark ov Mo del (HMM) classification tec hnique is applied b y Wilp on & Rabiner (1987) and hav e shown that HMM-based EPD approac h p erforms significantly b etter in the noisy environmen t compared to energy-based approac h. Qi & Hun t (1993) used the multila y er feed-forward net work with hybrid features to classify voiced, un voiced and silence from the sp eec h and ac hieved 96% classification rate. Kun et al Kun & W ang (2012) applied SVM for sp eech segregation in computational auditory scene analysis (CASA) problem domain and considered pitch and amplitude mo dulation sp ec- trum (AMS) based features. But the presumption to work for classification tec hniques require prop erly lab eled data for training and the task of lab eling data is a man ual or off-line process. Since man ual interv en tion is required in the classification approac h for endp oin t detection, it will b e difficult to automate the whole EPD pro cess. Lamel et al Lamel & Rabinar (1981) also pointed that pattern classification approaches should not b e readily applied in EPD owing to strong ov erlapping b etw een NSAs and sp eec h sounds. So, these are the reasons to look for tec hniques other than classification. Threshold-based EPD algorithms are also prop osed by some researchers. Zh u & Chen (1999) utilized the distance b et ween auto correlated functions and threshold as the feature set to find the endp oin ts. They hav e assumed that there exist some leading and trailing frames in the sp eech recording whic h can b e considered as silence section. But this assumption migh t not hold for all sp eec h databases or in real-world scenarios and that is the reason why efforts ha ve b een made to relax these assumptions. 5 In this article, a new algorithm is prop osed as an indep enden t mo dule and named as WCSED (W av elet Conv olution based Sp eec h Endp oint Detection). The WCSED algorithm is a deviation from the energy and ZCR based ap- proac hes. It is formulated by utilizing the simple fact that NSAs are high- frequency sound, and used the concepts of wa v elet conv olution and entrop y as a building block. First, the input speech signal is decomposed into high-frequency (HF) and lo w-frequency (LF) components using w a velet con v olution metho d. It is observed (Fig 4) that the NSAs are muc h prominent in the HF comp onents than in the LF comp onents. Also, the v oiced sections of a sp eec h utterance are low-frequency sounds whereas unv oiced sections are high-frequency sounds. Th us it can b e stated that the HF comp onents represent b oth the un voiced sp eec h and the NSAs, and the LF comp onents represent the voiced sp eec h. Tw o sets of thresholds are computed based on the en tropy v alues for b oth the HF and LF comp onents. The sp eec h signal is broken down into manageable frames to calculate the entrop y of the decomp osed comp onen ts. The LF thresh- olds extract the voiced sp eech segment whereas the HF thresholds are used to segregate the unv oiced speech segments from the NSAs. Results sho w that W CSED precisely extracts sp eech segmen ts in the presence of NSAs. Moreov er, the prop osed algorithm works with unlab eled data as there is no training in- v olved. Which contributes to the easy automation of the EPD process by the prop osed algorithm. Also, in WCSED, threshold computation do not assume that there exists a fixed num ber of leading and trailing frames, which further impro ves the flexibilit y of the algorithm as far as the use of dataset is concerned. This article is organized in to following sections. Section 2 describ es the problem in hand. Section 3 dedicated to describing the prop osed solution in detail and relev an t concepts are also discussed. Section 4 briefly describes the dataset we used. In Section 5 results of the algorithm and observ ations are elab orated. And finally Section 6 concludes this article and men tions possible directions whic h can be explored to extend or utilize this w ork. 6 2. The Problem In this section, the problem of speech endp oin t detection is elab orately de- scrib ed. 2.1. Difficulties in endp oint dete ction Con tinuous speech signals are recorded, digitized and stored as discrete time signals whic h are mostly used for sp eec h-based applications such as ASR, Sp eech Emotion Recognition (SER) etc. Apart from sp eec h segmen t, speech recordings con tain t wo more segments, the silence section at the b eginning and at the end of the recordings and the noise section (see Fig.1). Sp eech databases from differen t pro jects are recorded with a different degree of background noise. Here we are considering sp eec h database which is recorded in a quiet en vironment with very little or no con- tin uous bac kground noise. Although there is negligible background noise, there are some unw an ted sound artifacts got generated during the course of recording b y the sp eak ers suc h as lip smacking, heavy breathing, mouth clicks, and pops. Fig.1 sho ws the presence of NSAs in speech recording. The problem here is to separate sp eech utterances from silence and noise segmen ts. Silence can b e usually separated by applying algorithms based on STE and ZCR when there is negligible contin uous bac kground noise and no NSAs exists in the recordings. But STE based approaches fail to segregate the energy lev el of speech and noise when noise exists in recordings. Moreov er, noise and sp eech segments of a recording don’t contain any standard c haracteristics whic h can distinguish them. Also, h uman sp eech con tains tw o types of sound, V oiced sounds suc h as vo w els (a,e,i,o,u) and unv oiced sounds such as k and p. The c haracteristics of unv oiced sounds are v ery similar to noise and that needs to be taken care of while filtering out the noise. So the problem here has three folds • segregate speech from trailing and leading silence • consider the presence of noise 7 • need to be careful ab out not to consider un v oiced speech sounds as noise. 2.2. Pr oblem Statement W e are considering discrete-time sp eec h signals as input to our system. A discrete time signal X can b e mathematically represented as a sequence of num- b ers as follows: X “ t x r n su , w here x r n s “ t x 1 , x 2 , ..., x n u , ´ 8 ă n ă 8 , p x 1 , x 2 , ..., x n q P R (1) here n is an in teger and x r n s is the sequence usually generated b y taking a p eriodic sample from an analog signal. x r n s “ t idle r k s , speech r m s , noise r l su , wher e n “ k ` m ` l (2) This sequence x r n s comprises of three sections (eq 2), the idle section idle r k s , the noise section noise r l s and the sp eech section speech r m s where n “ k ` l ` m . These sections are not distinguishable b y mere ev aluation of the v alues in these sequences because no predefined ranges or thresholds of v alues exists. The task here is to extract only the speech r m s section from x r n s . It is assumed here that speech r m s contains a con tinuous sequence extracted from x r n s . But the noise r l s and idl e r k s sections can contain combination of m ultiple sequence fragments from x r n s . So, the sequence of x r n s con tained in speech r m s cannot be found in either noise r l s or in idl e r k s . So, the ob jectiv e here is to lo ok for pattern in x r n s , that can distinguish speech r m s from noise r l s and idl e r k s and finally extract the speech r m s from x r n s . 3. The Prop osed Solution A solution based on wa v elet con volution to the problem stated in section 2.2 is prop osed here. The pattern has b een found in the sp eec h signals that 8 demarcate sp eec h utterances from a non-sp eec h section of the recording. The concept of entrop y is applied to get an approximation of information conten t in w a velet conv olution coefficients. In the follo wing subsections, these concepts are discussed before form ulating the actual solution. 3.1. Convolution Con volution is an imp ortant op eration in signal and image pro cessing do- main. It is a concept extensiv ely used in linear algebra. Conv olution is one of the cornerstones of wa v elet transform concept and con tin uous w a velet transform is applied to solve the endp oin t detection problem. In this section concept of con tinuous conv olution is briefly discussed. Con volution operates with t wo functions, one is input and another is ker nel , and pro duces a third function. First, the k ernel is flipp ed (rotation by 180 ) ab out its origin and slided past the input to compute the sum of pro ducts at eac h displacemen t. Let there b e an input function f and kernel function g . Then the con v olution betw een f and g , denoted b y h , is defined as follo ws: h p i q “ p f ˙ g qp i q “ ż 8 ´8 f p i ´ j q g p j q d j (3) where the minus sign accounts for the flipping of the kernel function g , i is the required displacement and j is a dummy v ariable that is integrated out Gonzalez & W o o ds (2008). 3.2. Wavelets The Concept of W av elet decomp osition is the key to solving the sp eec h endp oin t detection problem in this algorithm. This section describ ed imp ortan t and relev ant areas of the W av elet concept in as m uch detail required for this w ork. 3.2.1. Why Wavelets? Signals carry o v erwhelming amounts of data which needs to b e extracted as information. But often the difficulties in volv ed in the task of extracting relev ant 9 information from those data b ecomes a hurdle for the field of study to which those signals b elong. Sparse representation of signals is an efficient wa y to lo ok for relev an t information and patterns in signals. Sparse representation is ac hieved through decomp osing signals ov er oscillatory wa v eforms using F ourier or wa v elet bases. Sp eec h signals to o carry differen t types of data that need to be extracted as information for better results in v arious research areas and applications that uses sp eech signals. Non-stationary signals are the signals whose frequencies and other statis- tical prop erties v aries ov er time. F ourier T ransform (FT) is not suitable for analyzing non-stationary signals. Short Time F ourier T ransform (STFT) was in tro duced to o v ercome this shortcoming of FT. But during STFT process while transforming time domain signal into frequency domain vital time information is lost. This phenomenon of losing time information can be explained b y Heisen- b erg’s Uncertaint y Principle [see Mallat (1986)]. W a velet analysis is b est suited in this scenario where we hav e to analyze the non-stationary signal to lo ok for a c hange in frequency comp onen ts ov er time. Sp eec h is a non-stationary signal. F or this reason, w av elet decomp osi- tion is applied here to find relev an t frequency comp onen ts in sp eech signals. W a velets define a sparse represen tation of well-localized piecewise regular signal through the co efficien t amplitudes and few co efficients are required to represent that transient structure. That sparse representation ma y include transients and singularities. This wh y w av elet analysis is imp ortan t in speech pro cessing. 3.2.2. Wavelet A nalysis This section describ es the metho d of w av elet analysis. Consider a finite energy signal x p t q where the energy of x is defined b y its squared norm and is expressed as } x p t q} 2 “ ż `8 ´8 |p x p t qq| 2 dt ă `8 So, the space on which the } x p t q} 2 norm is defined has to be square integrable b ecause the in tegral ş ´8 `8 |p x p t qq| 2 dt must exists. That space is denoted as L 2 p R q 10 is a Hilb ert space and is the vector space of the finite energy functions and thus x p t q P L 2 p R q . The ob jectiv e here is to decompose the signal x into a linear com bination of a set of functions whic h belongs to L 2 p R q . Let us consider a function ψ p x q P L 2 p R q whose dilation and translation forms a set of functions in L 2 p R q space ψ τ ,s p t q “ 1 ? s ψ ˆ t ´ τ s ˙ , w her e τ P R , s P R ` and s ‰ 0 τ and s are the translation and scaling (dilation) parameters resp ectiv ely and s cannot b e negative since negative scaling is undefined. Normalization by 1 ? s ensures that } ψ τ ,s p t q} is indep endent of s . The family of functions ψ τ ,s is called wavelets and ψ is called the mother wavelet . So, now the signal x can b e represen ted as wa v elet inner-pro duct co efficien ts x x, ψ τ ,s y “ ż 8 ´8 x p t q ψ τ ,s p t q dt (4) here b oth x and ψ are considered as real-v alued signals. When ψ is a com- plex wa v elet, the right hand side of equation 4 will hav e complex conjugate of ψ as ψ ˚ τ ,s p t q . The mother wavelet , also referred to as the wavelet function or the kernel function , has zero a verage, meaning ş 8 ´8 ψ p t q dt “ 0. Apart from satisfying zero a v erage condition wavelet functions has to satisfy tw o more math- ematical criteria. First one is that the wa v elet function must ha ve finite energy: E “ ş 8 ´8 | ψ p t q| 2 dt ă 8 , which ensures that ψ is square integrable and the inner pro duct in eq 4 exist. And the second one is called the admissibility condition which even tually b oils down to the condition of zero a verage, stated earlier, whic h ensure that x can b e reconstructed again after decomp osition. The wavelet function need to b e selected carefully based on the t ype of analysis to be performed on the input signal because that will help to iden tify regularities and singularities. The choice of the mother wavelet to b e used in contin uous w av elet transform is restricted only to the conditions of finite energy and ad- missibilit y Daub echies (1992). Wavelet function can b e either orthogonal or nonorthogonal and only the orthogonal functions form wavelet b asis . That is 11 wh y the orthogonal wa v elets give compact represen tation of the signal and are useful for signal pro cessing. On the other hand nonorthogonal wa v elets pro duce w av elet spectrum whic h is highly redundant at high scales and are more useful for time series analysis (T orrence & Compo (1998)). Here contin uous w av elet transform (CWT) is used for the analysis, so we will concen trate on CWT. But b efore going in to details of CWT here are tw o reasons b ehind selecting CWT ov er Discrete W av elet T ransform (DWT) for this solution. Mallat (1986) mentioned, discrete sequence of τ is complex to describ e and amplitudes of wa velet co efficien ts are difficult to interpret since the regularit y of a discrete sequence is not w ell defined. Moreov er, the purpose of the CWT is to extract information from signal whereas DWT is go o d at reconstructing the signal. Here information needs to b e extracted from speech signals and thus CWT is chosen. The scaling parameter s in CWT can v ary con tinuously o ver R and can take an y v alue, whereas v alues s are restricted in D WT. So, signal analysis at arbitrary scale (or frequency) is p ossible in CWT and not in DWT, which is an imp ortan t criteria for the current problem. No w, CWT of x p t q with resp ect to wa v elet function ψ p t q at scale s and p osition τ is the pro jection of x on ψ and is defined as inner pro duct co efficien ts in eq 4: C p τ , s ; x p t q , ψ p t qq “ x x, ψ τ ,s y “ ż 8 ´8 x p t q ψ τ ,s p t q dt whic h measures the v ariation of x in the neighborho o d of τ prop ortional to s . Calderon (1964) has shown that CWT can b e defined as a conv olution op eration. C p τ , s ; x p t q , ψ p t qq “ ż 8 ´8 x p t q ψ τ ,s p t q dt “ x ˙ ¯ ψ p τ q (5) where ¯ ψ p τ q “ 1 ? s ψ ˆ ´ t s ˙ 12 So, CWT extracts information by con volution and not exactly decomp oses the signal into sub-signals. Since CWT uses non-orthogonal wa velets, recon- struction frame is less imp ortan t and problematic as well b ecause the inv erse w av elet transform for CWT is still not well defined. This w a velet conv olution op eration is the foundation of the prop osed solution. CWT must b e discretized to b e implemented in a computer. That is what is done here by selecting a discrete set of relev an t scales for analysis rather than con tinuous scale. The shifting (translation) has to b e done contin uously ov er for all the points of the signal to b e analyzed through con v olution operation as defined in Eq 3. 3.3. Entr opy En tropy was introduced in physics as a thermo dynamic state v ariable. It pro vides an appropriate measure of randomness or disorganization in a system and increases along with the randomness of the system. Statistically its defined as (see. Kullback (1959)): E p X q “ N ÿ i “ 1 p p x i q log 10 p p x i q , (6) where X “ t x 1 , x 2 , ..., x N u is a set of random phenomena, and p p x i q is the probabilit y of a random phenomenon x i . During this w ork, its observ ed that en tropy of amplitude v alues of a signal con tinues to be significantly high and stable when there is descen t disturbance in the system. This is a useful observ ation to k eep trac k of voice activity in a signal recording and separate voice from silence. So, from the curren t problem p erspective describ ed in section 2.2 we can write E p speech r m sq " E p idle r m sq (7) In the prop osed algorithm the concept of entrop y is a key component in separating speech section from silence. 13 3.4. Conc ept of F r ame Human speech generation apparatus that is tongue, lip and the other parts of our v ocal system inv olv ed in producing sound needs appro ximately 25-30 mil- liseconds gap b et ween tw o uttered words b ecause it needs that time to prepare the system to produce next sound. So, if it is required to break the signal into smaller frames the size should be c hosen within that range. F rames are needed for this algorithm and its fixed at 20ms and is termed as fr ame length . Also, the concept of fr ame shift is used to define the actual shift of data points in the signal, whic h is fixed at 10ms . Combination of fr ame length and fr ame shift is used to av oid the effect of the abrupt split of wa ves during frame splits, to some exten t. 3.5. F ormulation of the Solution The first step to apply w a velet decomp osition method for analysing asignal is to select a suitable mother w avelet . Here Daub ec hies wa v elet hav e been selected for this algorithm, sp ecifically D B 8 . Daub ec hies wa v elets are one of the popu- lar w av elets among researchers for sp eech pro cessing (T an et al. (1996),Campo et al. (2016)). Shape of a D B 8 signal is shown in Fig.3. Since con tinuous w av elet transform is considered here, the scaling and translation parameters s , τ can v ary contin uously o ver R Daub ec hies (1992). So, from con tin uous scales, arbitrary set of scales is selected to co ver the p ossible frequency range of the h uman sp eech recording signals. Here an orthogonal wa velet function DB 8 is con volv ed ov er the discrete input signal to get the coefficient v alues at differen t scales (frequencies). Orthogonalit y of D B 8 helps to remo v e the redundancy of w av elet coefficient. Ob jective here, as describ ed in Section 2.2, is to find pattern in discrete sequence x r n s (eq 1) to segregate sp eec h segment from rest of the sequence. W a velet con volution operation is applied to analyze the sequence x r n s and searc h for relev ant patterns. Its observ ed during the exp erimen ts that presence of NSAs are prominent in co efficien t amplitude plot when wa velet scale is small (high- frequency) (Fig.4). It is equiv alen t to the fact that NSAs has similarities with 14 Figure 3: Figure shows D B 8 wa v elet shape at scale 100 high-frequency wa v elets since lo w scale v alue implies high-frequency . But as we go on analyzing the co efficien ts in higher scales (low-frequencies) we found that those NSAs are almost non-existen t in the plot (Fig.4). The phenomenon is w ell supp orted by the fact that NSAs are usually high-frequency sounds and thus pro duces high co efficient v alues in conv olution with low scale (high-frequency) w av elets. This observ ed phenomenon is the bac kbone of this approac h to solving the problem of sp eech endp oin t detection. A set of scales has b een selected based on the range of frequency we need to cov er. The frequency comp onents of the h uman sp eec h signal are mostly co vered within the range b et ween 250Hz and 6000Hz (Shen et al. (2011)). But its observed that NSAs are prominent around 3000Hz and around 300Hz the presence of noise is v ery w eak, so here w e will consider the upper limit as 3000Hz and low er limit as 300Hz. T o accommo date that frequency range using D B 8 mother w a velet tw o sets of scales are selected: • scale hf includes set of high frequency range (lo w scale v alues) • scale lf includes set of low frequency range (high scale v alues) A t low scale, wa v elet co efficient v alues are muc h smaller compared to co efficient 15 Figure 4: Co efficient Amplitudes at differen t scales for a speech utterance with breathing noise. Scale 10 highligh ts 3200Hz frequency components where breathing noise is very prominent. Scale 23 highlights 1391Hz frequency comp onents where noise is most prominent compared to a sp eec h utterance. Scale 50 highligh ts 640Hz frequency comp onents where the w eak presence of noise can b e seen. And finally , Scale 100 highlights 320Hz frequency comp onen ts where the noise section is v ery w eak compared to sp eec h section. v alues at high scale. This is the reason wh y more num b er of scales are selected for scale hf than scale lf . Its assumed here that there exists a gap of few milliseconds b etw een the NSAs and the speech utterances. It is v ery unlik ely that the speaker can pro duce some NSAs exactly b efore and after the actual utterance without an y time gap. F or example, the noise of breathing out cannot come out while speaking because the v oice is already coming out with exhalation, and if at all breathing noise comes out while sp eaking it w ould distort the sp eech utterance. Similarly , mouth p op and click sounds cannot b e pro duced by the sp eak er while uttering a sp eec h b ecause that will interrupt the utterance. No w wa velet transform of the discrete sequence x r n s (1) is p erformed, which is defined as con volution of x with a scaled and translated version of ψ the mother w a velet ( D B 8 ) (T orrence & Comp o (1998)) to generate set of co efficients 16 as described in eq 5. coef s “ x ˙ ψ (8) Co efficien t sets are needed to be combined together to get tw o v ectors that can b e used for further pro cessing. T o achiev e that sum or av erage strategy has b een applied dep ending on the loudness of the actual signal X. When loudness is higher than a sp ecific threshold v alue, the co efficien t v alues are av eraged otherwise they are summed. After the co efficien ts are com bined in to t wo v ectors namely coef hf and coef lf , the en tropy is computed for b oth the vectors. The co efficien t vectors are brok en do wn in to frames and then entrop y is computed using the formula defined in eq 6. These entrop y vectors are sp ecial in a sense that they repre- sen t high-frequency en tropy (say ce h ) and low-frequency entrop y (say ce l ) of the w a velet co efficients. The entrop y v ectors ce h and ce l are further used to calculate t wo sets of thresholds one for high-frequency and the other for low-frequency . Lo w- frequency thresholds are used to iden tify locations with presence of speech ut- terance b ecause low-frequency components are distinctly separate from idle r k s and noise r l s sections. Then high-frequency thresholds are used to stretch those iden tified sp eec h utterance zones with proper voiced and unv oiced trails at the b eginning and end of speech utterance. 3.6. The A lgorithm The prop osed algorithm WCSED is designed to work independently . Sys- tems require extracting speech segmen t from speech signals can incorporate this as a separate mo dule. The steps of the prop osed algorithm are listed in Algo 1 section. Here the pseudo co de is pro vided in the listing and the functions, in brief, are men tioned to maintain the readability of the algorithm. W CSED algorithm consists of one main mo dule and three submo dules. The main mo dule called WCSED which accepts discrete time sp eech signal as in- put and returns the extracted speech segment. The ”W a veCon v” mo dule is 17 Figure 5: Blo c k diagram of the W CSED algorithm resp onsible for computing the CWT on the input signal and returns the co ef- ficien ts. The ”GetEn tropyV ector” mo dule computes entrop y by breaking do wn the input sequence into segmen ts and returns a v ector. And finally , the points to wards the edges of the end-p oin ts are selected by considering the threshold v alues provided. Assumptions for this W CSED algorithm are kept at the minim um to main- tain generality . Thresholding concept w as applied but the assumptions of lead- ing and trailing silence similar to Zhu et al Zhu & Chen (1999) is relaxed b ecause that w ould restrict the scop e of this algorithm to specific datasets. Thresholds are dynamically calculated. 4. Dataset This study is based on Ryerson Audio-Visual Database of Emotional Sp eec h and Song (RA VDESS) Livingstone et al. (2012) dataset. This dataset was pri- marily created in view of research areas related to Emotion Recognition in Sp eec h and Song. Only the sp eec h recordings are used for this current work. 18 Algorithm 1 W CSED algorithm Input: Discrete-time signal S(n), where n is the length of the signal and Sam- pling Rate Output: Extracted Sp eec h Segmen t S extr (k), where k ă“ n 1: function W CSED ( S p n q , F S ) Ź S=discrete time signal and FS=sampling rate 2: F L Ð F rameLeng th 3: F S H Ð F r ameS hif t 4: M W Ð ” D aubechies ” Ź mother w a v elet 5: S C p m q Ð r H ig hF r eq uency S cales, Low F r eq uency S cal es s Ź m n umber of scales 6: C OE F m ˆ n Ð W av eC onv p S p n q , S C p m q , M W q Ź coefficients 7: C E Ð GetE ntr opy V ector p C OE F m ˆ n , F L, F S H q 8: th u , th l Ð compute upper and lo w er thresholds 9: sec al Ð C E ě th l 10: pos s Ð I ncl udeE dg es p C E , sec al r star t s , back , th u q 11: pos e Ð I ncl udeE dg es p C E , sec al r end s , f r ont, th l q 12: S extr p k q “ S r pos s , pos e s 13: return S extr p k q Ź The extracted sp eech 1: function W a veConv ( S, S C, M W ) Ź signal,scales,mother w a v elet 2: C D m ˆ n Ð output matrix 3: for ( m “ 1; m ă“ l eng ht p S C q ; m ` ` ) do Ź iterate through all the scales 4: f Ð get the reference wa v elet 5: C F 1 ˆ n Ð S ˙ f Ź con v olution giv es the coefficients 6: C D m : Ð dif f p C F q Ź tak e appro ximate deriv ative 7: return cd Ź deriv ative of co efficien ts 1: function GetEntr opyVector ( i, f l , f s ) Ź input sequence, frame len, frame shift 2: len Ð l eng th p i q 3: sp Ð 1 4: ep Ð sp ` f l ´ 1 5: while ep ď l en do 6: entr opy v Ð E ntropy p i r sp, ep sq Ź calculate en trop y 7: sp Ð sp ` f s 8: ep Ð sp ` f l ´ 1 9: return entropy v Ź The en trop y v ector 19 Figure 6: The Figure sho ws extracted sp eech along with corresp onding en tropy . The breathing noise NSA is precisely discarded. While w orking on Sp eec h Emotion Recognition its observ ed that the record- ings con tain differen t sound artifacts generated by the sp eakers such as heavy breathing, mouth clicks and p ops, lip-smac king. These sound artifacts are mak- ing endp oint detection task difficult and the need for a robust endpoint detection algorithm was felt. There are total 24 sp eak ers of which 12 male and 12 female. The sp eak ers utter tw o statements ”kids are talking by the do or” and ”dogs are sitting b y the do or”. The utterances are v arying ov er different emotions and in tensities. 5. Results and Observ ations The primary ob jectiv e of W CSED algorithm is to automate the pro cess of extracting the sp eec h segments precisely in the presence of NSAs and it has sho wn promising results. It has successfully extracted the sp eec h segments from almost all the recordings. In very few cases the significant amount of sp eec h could not b e extracted but the algorithm did not fail completely in those rare cases. The sp eech recordings con taining NSAs are efficiently processed by separating those un w an ted artifacts from actual sp eech. Some sp eak ers pause for some few milliseconds b et w een the w ords. Those 20 Figure 7: The Figure shows extracted sp eec h along with corresponding entrop y . Sp eaker’s inten tional voice sound is meaningfully included in the extracted sp eech. pauses should b e included as a part of sp eec h segment since pauses can add qualit y to the sp eech recording while extracting say emotional quotient and the algorithm did it well in those cases too. Fig.6 and Fig.7 show the end result of the algorithm depicting the extracted segmen t along with corresponding en tropy v alues. T able 1: T est Results Sp eak er Av erage % of Av erage % of Gender Startp oin t Deviation Endp oin t Deviation FEMALE 1.027 2.259 MALE 0.576 2.847 Av erage % of deviation 0.777 2.584 The exp eriment results are summarized in T able 1, where the deviations are depicted. More than 20% of the total num b er of sp eec h recordings are selected as sample for cross verifying with the results received by applying the WCSED algorithm. Those samples are manually chec k ed for p ossible start-frames and 21 end-frames of the sp eec h segments in the recordings. Since WCSED algorithm extracts sp eech segment based on frames, the selected samples are also pro cessed based on start and end frames. After manually extracting the frames of the samples it is c heck ed that ho w the start and end frames are deviating from the frames reported by WCSED algorithm of the corresponding sp eec h recordings. Sim ulations are executed 10 times on the selected sample to chec k whether there is any discrepancy in differen t simulations. But its observed that in every sim ulation the algorithm has pro duced exactly same results. The cross verifi- cation of results is measured in few stages. First, b eginning and end frames are calculated for the selected samples man ually , let us refer them as man ual- frames. Those manual-frames are then compared with corresp onding frames re- p orted b y the WCSED algorithm, let us refer them as algorithm-frames. Then absolute deviation b etw een man ual-frames and algorithm-frames are computed. Considering manual-frames as a baseline, the length of the extracted sp eec h is calculated and then the percentage of deviation in frames, compared to the frame length of the extracted sp eech, is calculated. This percentage deviation is depicted in T able 1. Analyzing the deviations its observed that ov erall start-frame deviation is 0.777% (means approximately 99.3% accurate), while end-frame deviation is 2.585% (means approximately 97.5% accurate). Th us, the algorithm extracts the start frames more accurately than the end frames. This accuracy gap is due to the fact that different speakers end their utterance with differen t styles and v arying pause or silence b etw een sp oken words. So, the ov erall accuracy of the W CSED algorithm to detect start-frame is 99.3% (approx) and end-frame is 97.5%(appro x). It is observ ed during testing that the deviations are different for female and male speakers. F actor contributed to this phenomenon is p ossibly the loudness v ariation in female and male sp eak ers, male voices in this recordings are usually louder and more prominent than female v oices. Finally , the time complexity of WCSED algorithm is directly proportional to the length of the input signal. When input signal length increases, the algorithm 22 will tak e more time to extract the speech utterance from the input signal. 6. Conclusion The prop osed W CSED algorithm tried to address four issues of speech end- p oin t detection problem. First, automating the pro cess of EPD. Second, dis- carding the NSAs and extracting start and end p oints prop erly . Thirdly , re- laxing assumptions which could hinder this algorithm to w ork prop erly across differen t speech databases and in real-w orld applications. Finally and most im- p ortan tly extract the end-p oin ts accurately . The results discussed in section 5 are promising and WCSED is able to address the aforementioned issues. This algorithm can be further applied in different speech signal based s ystems where utterances need to b e extracted from sp eec h signals in the presence of differen t NSAs. F or example, this algorithm can b e applied in the preprocessing stage of an ASR or an SER system. W a velet con v olution (CWT) based approach to find relev an t patterns in a discrete time signal can b e applied to solve similar problems in sp eech recog- nition domain and other domains where patterns need to b e identified from signals. CWT can b e used to enhance the feature set of v arious classification problems. Result 5 section mentioned that level of loudness of sp eak er’s utterances could be an important factor to impro v e the end-point selection results. F urther in vestigation and action in that direction could yield more accuracy from this W CSED algorithm. References A tal, B., & Rabinar, L. (1976). A pattern recognition approac h to voiced- un voiced-silence classification with applications to sp eec h recognition. IEEE TRANSAC TIONS ON A COUSTICS, SPEECH, AND SIGNAL PR OCESS- ING , 24 , 201–212. 23 Calderon, A. P . (1964). Intermediate spaces and interpolation:the complex metho d. Stud. Math , (pp. 113–190). Camp o, D., Quin tero, O., & Bastidas, M. (2016). Multiresolution analysis (dis- crete w av elet transform) through daub ec hies family for emotion recognition in speech. In Journal of Physics: Confer enc e Series . volume 705. Daub ec hies, I. (1992). T en L e ctur es on Wavelets . SOCIETY FOR INDUS- TRIAL AND APPLIED MA THEMA TICS. Gonzalez, R., & W o o ds, R. (2008). Digital Image Pr o c essing . P earson. Kullbac k, S. (1959). Digital Signal Pr o c essing . Wiley . Kun, H., & W ang, D. (2012). A classification based approach to sp eec h segre- gation. Journal of A c oustic al So ciety of A meric a , . Lamel, L., & Rabinar, L. (1981). An improv ed endpoint detector for isolated w ord recognition. IEEE TRANSACTIONS ON ACOUSTICS, SPEECH, AND SIGNAL PR OCESSING , 29 , 777–785. Lamere, P ., Kw ok, P ., Gouvea, E., Ra j, B., Singh, R., W alker, W., W armuth, M., & W olf, P . (2003). The cmu sphinx-4 sp eec h recognition system. In Pr o c. of the ICASSP . Livingstone, S. R., Pec k, K., & Russo, F. A. (2012). Ravdess: The ryerson audio-visual database of emotional sp eec h and song. Mallat, S. (1986). A wavelet tour of signal pr o c essing: The sp arse way . Addison- W esley . Qi, Y., & Hunt, B. R. (1993). V oiced-un voiced-silence classifications of speech using hybrid features and a netw ork classifier. IEEE TRANSACTIONS ON SPEECH AND A UDIO PROCESSING , 1 , 250–255. Rabiner, L. R., & Sambur, M. R. (1975). An algorithm for determining the endp oin ts of isolated utterances. Bel l Syst. T e ch. J. , 54 , 297–315. 24 Sa vo ji, M. (1989). A robust algorithm for accurate endpointing of speech signals. Sp e e ch Communic ation , (pp. 45–61). Shen, J., Hung, J., & Lee, L. (2011). Robust entrop y–based endp oint detection for sp eec h recognition in noisy en vironments. In T ele c ommunic ations F orum (TELF OR) . volume 19. T an, B. T., F u, M., Spra y , A., & Dermo dy , P . (1996). The use of w av elet transforms in phoneme recognition. In Sp oken L anguage, 1996. ICSLP 96. Pr o c e e dings., F ourth International Confer enc e on (pp. 2431–2434 v ol.4). vol- ume 4. doi: 10.1109/ICSLP.1996.607300 . T orrence, C., & Compo, G. (1998). A practical guide to w a velet analysis. Bul- letin of the Americ an Mete or olo gic al So ciety , 79 , 61–78. Wilp on, J. G., & Rabiner, L. R. (1987). Application of hidden marko v models to automatic speech endp oint detection. Computer Sp e e ch and L anguage , (pp. 321–341). Zh u, J., & Chen, F. (1999). The analysis and application of a new endp oint detection metho d based on distance of autocorrelated similarit y . In Pr o c. of the EUROSPEECH (pp. 105–108). 25
Original Paper
Loading high-quality paper...
Comments & Academic Discussion
Loading comments...
Leave a Comment