Mixture theory modeling for characterizing solute transport in breast tumor tissues
Solute transport is modeled using mixture theory, applied to the nanoparticle accumulation and concentration decay in the tissue space for different vascular configurations. A comparison of a single capillary configuration (SBC) with two parallel cyl…
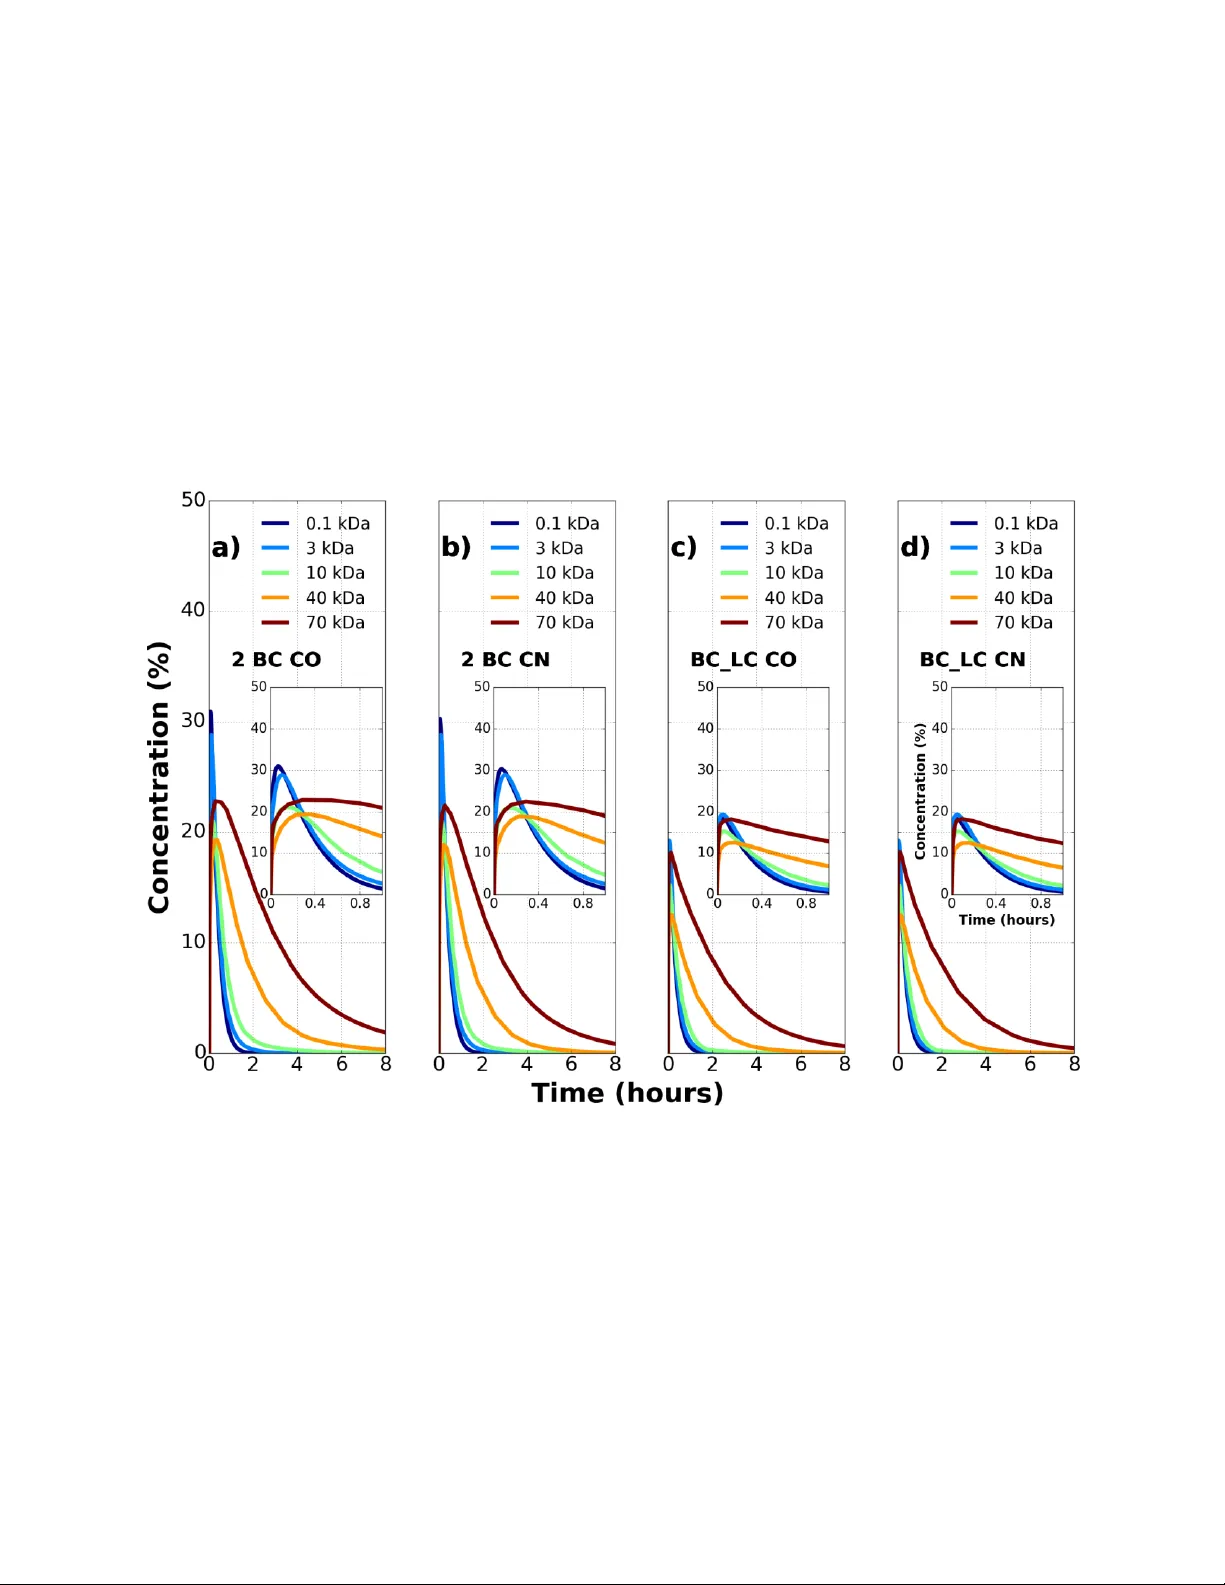
Authors: Sreyashi Chakraborty, Alican Ozkan, Marissa Nichole Ryl
1 M i x t u r e t h e o ry m o d e l i n g f o r c h a r a c t e r i z i n g s o l u t e t r a n s p o r t i n b r e a s t t u m o r t i s s u e s Sreyashi Chakraborty 1 , Alican Ozkan 2 , Marissa Nichole Rylander, 2,3,4 Wendy A. Woodward 5 , and Pavlos Vlachos 1 1 Department of Mechanical Engineering, Purdue University, West Lafayette, IN 47907 2 Department of Mechanical Engineering, The University of Texas at Austin , Au stin, Texas 78712 3 Department of Biomedical Engineering, The University of Texas at Austin, Austin, Texas 78712 4 The Institute for Computational Engineering and Sciences, The University of Texas at Austin, Austin, Texas 78712 5 Department of Radiation Oncology, MD Anderson Cancer Center, Houston, TX 77030 2 Abstract Delivery of nanopartic l es to breast tumors involves a coupled analy sis of the fluid and solute transport mechanisms in the microvasculature, across the ve ssel walls, a nd in the extravascular spaces. Tumor numerical models have been used to quantify solute transport with a single capillary embedded in an infinite tumor expanse, but measurements f rom different mammalian tumors suggest that a tissue containing a single capillary with an infinite intercapillary distance assumption is not physiological. The present stud y aims to investi gate the limits of the intercapillar y distance within which nanoparticle tra nsport resembles solute extravasation in a brea st tumor model as a function of the solute size, the intercapillary separation, and the flow direction in microvessels. Dextran tra nsport properties obtained fr om an in vitro tumor platform containing a single vessel provided validation of the numerical model. Solute transport is modeled using mixture theory, applied to the nanoparticle accumulation and concentration deca y in the tis sue space for different vascular configura tions. A comparison of a single capillary configuration (S BC) with two parallel cylindrical blood vessels (2 B C) and a lymph vessel para llel to a blood vessel (B C_ L C ) embedde d in the tissue cylinder is performed for five solute molecular weights between 0.1 kDa and 70 kDa. The effects of counter fl ow (CN) versus co-current flow (CO) on the solute accumulation were also investigated and the scaling of solute accumulation -decay time and concentration was explored. We found that the presen ce of a second capillar y reduces the extravascular concentration compared to a single capillary and t his reduction is enhanced by the pr esence of a l ymph vessel. Co-current flow direction between two adjacent vessels led to nonhomo geneous nanoparticle distribution for larger particle siz es in the tissue space , while smaller particles (0.1 kDa and 3 kDa) showe d th e propensity to get trapped locall y in the tissue during counter- current flow. Varying the intercapillary distance with respect to vessel diameter shows a deviation of 10-30 % conce ntr ation for 2 BC and 45-60% concentration for BC_LC configuration compared to the reference SBC configuration. Finally, we introduce a n on-dimensional time scale that captures the concertation as a function of the transport and geometric parameters. We find that the peak solute concentration in the tissue space occurs at a non-dimensional time, = 0.027 0.018, irrespective of the solute size, tissue architecture, and microvessel flow direc ti on. This sug gests that if indeed such a universal time scale holds, the knowledge of this time would allow estimation of the time window at which solute c oncentration in tissue peaks. He nce this c an aid in the design of future therapeutic efficacy studies as an example for triggerin g drug release or laser excitation in the case of photothermal therapies. Keywords – Solute transport, cancer tissue, mixture theory modelin g 3 Introduction The total cost of cancer care in the United States is projected to in crease b y 39% from 2010 to 2020 (1). Primary areas of cancer research invol ve improving the e fficacy of chemotherapeutic agents at the tumor site s and minim izing their tox ic side effects in the non -target sites (2-4). Conventional chemotherapeutic agents (5) are non -specifically distributed in the bod y which limits the effectiveness of the drug dose and increases toxicity in norm al cells. Drug carriers with hydrodynamic diameter 3-200 nm accumulate preferentially in tumors owing to the enhanced permeability and retention (EPR) effect (6) exploiting the wider pores in t umor vessels and the impaired lymphatic drain age in diseased tissues. The transport mec hanism of these nanopa rticles in tumors is a function of the hemodynamics, nanoparticle transport parameters (solute permeability, solute dif fusivity, reflection coefficient) as well as the extravascular matrix properties (porosity, hydraulic conductivit y). Before the binding/uptake by the cancer cel l these particles overcome three major tr ansport barriers: transport through microvasculature, translocation across the e ndothelial wall, and diffusion within the extracellular tissue matrix. Using a numerica l model to investiga te the nanoparticle transport mech anics could e nable determination of the exact time interval betwee n nanoparticle introduction and drug release to achieve desired therapeutic efficacy based on patient specific tumor measure m ents. The majority of the existing multiscale models use t he Darcy’s law, Starling’ s law, and Poiseuille’s law to analy z e extravascular, trans-capillar y, and intrava scular transport respec tivel y (7-12) . Poiseuille’s law cannot account for variations in capillary diameter and the inhomog eneous nature of blood. Deviations from Starling’s law are expected when osmotic te rms would inclu de other endogenous solutes in addition to proteins. Darcy’s law does not include the dependence of interstitial flow on local fluid chemical potential. Schuff et al. (13, 14) used mixture theory equations in an axisymmetric tissue geometry containing a concentric blood vessel and showed the dependence of extravascular fluid transport on chemical gradients in addition to hydrostatic pressure which was previousl y suggested ( 15, 16) and observed (17) but not commonly a ccounted for in previous transport models. In th e present w ork, the mix ture theory model is implemented in dual- tissue geometr ies to predict nanoparticle distribution in ca ncerous breast tissues over a wide range of particle sizes (0.5-15 nm) and molecular weights (0.1-70 kDa). We hypothesize that nanoparticle distribution in breast tumors is a function of solute size, intercapillary separation, and flow direction and th ere exist s a characteristic non -dimensional time, , for which solute concentration in the tissue spa ce is max imum. W e test this h ypothesis by investigating the transport mechanisms of five so lute type s (0.1, 3, 10, 40 and 70 kDa) in tumor systems containing a sin gle vessel (SBC) a nd compare with tumors possessing dual-vessel (blood capillaries onl y (2 BC), blood capillary and a l ymph capillary (BC_LC)) ti ssue systems with varying intercapillary separation. The mi xture theor y equations are used for the first time and their predictive capability validated with measurements of dextran tra nsport in an in vitro tumor platform containing multiple blood vessels 4 Materials and Methods The mixture theory equations model the transport (13, 14) of the fluid and solute in three distinct regions of a representative vascularized tumor geometr y : a) in the int ravascular space which consists of the plasma la yer concentric with an inn er core of red blood cells, b) across the capillar y wall which is thin and semi -permeable and c) the extravascular space t hat comprises of the interstitial fluids and solutes flowing throug h a fibrous matrix. A finite element software package COMSOL 4.2 (COMSOL, Burlington, MA) was used to run the simulatio ns. A schematic of the vascularized br east tumor configuration along with the transport pathw ays is shown in Figure 1 . The blood vessel in Figure 1 allows both intravasation and extravasation depicted by blue a nd red arrows r espectively. The lymph v essel allows intravasation (blue a rrow) only and drains th e lymphatic fluid out of the tissue. Figure 1 : Sche matic of a tissue containing blood capillary and lymph vessel. The arrows show the m ain transport mechanisms of a solute in the tissu e. The extravascular sp ace contains in terstitial flu id flowin g through a fibrous matrix. The blood vessel contains an inner core of red blood cells (RBC) surroun ded by an outer plasma layer. Th e lymph vessel contains the interstitial fluid in it. No extravasation occurs in lymph vessels. Mi xtur e Th eor y Mo de l Pa rame ters The mixture theory model requires fifteen input parameters that accou nt for the mechanical properties of the porous matrix, t y pe of the inje cted solute, and vascular geometry. For the current study, these p arameters correspond to a human breast tum or and are p resented in Table 1 . The 5 governing equations and boundar y conditions for the mixture theor y model have been d erived in (13). A sensitivity a nal ysis of the input parameters, calibration and subs equent validation of the model was carried out b y Schuff et al. in (14). All the equations used in the simulations are explained in the Appendix A. Table 1: Input parameters f or mixture theory model. Values are for dif ferent types of cancer tissues adopted from the literature. Re f erences are listed in the last column of the table. Solute Dependent Parameters Solute Molecular Weight (kDa), MW 0.1 3.0 10.0 40.0 70.0 Hydrodynamic Diameter (nm) 0.69 1.6 5.46 13.2 14.4 (18-20) Reflection coefficient, 0.00025 0.00025 0.02500 0.08600 0.14000 (13, 14, 21, 22) Solute Permeability coefficient , P d (x10 -8 m/s) 800 174 70 33 30 (13, 14, 23-25) Diffusion Coefficient (x10 - 11 m 2 /s), D f 89.6 17.0 9.6 7.8 3.6 (26-29) Retardation factor, R F 1.10 1.10 1.07 0.94 0.84 (27-31) Initial solute concentration (mol/m 3 ), Co 6.11 0.20 0.08 0.02 0.01 (26) Flow Parameters Pressure gradient along blood vessel (Pa), dP 2394 (32-35) Hydrostatic pressure in arteriole (Pa), Par 4394 (32-35) Boundary tissue pressure (Pa), Po 2700 (36-39) Osmotic Pressure gradient (Pa) 2500 (13, 14, 18, 32) Hydraulic conductivity (x10 - 15 ) (m 2 /Pa- s) 400 (13, 14, 37, 40) Hydraulic permeability (x10 - 10 ) (m/Pa- s) 10 (13, 14, 37) Tissue porosity, 0.4 (37, 41-43) Geometrical Parameters Length of microvessels (mm), l 1 (44, 45) Diameter of microvessels ( μm ), d 10 (44, 46, 47) Diameter of tissue ( μm ), D 200 (44, 46, 48-50) 6 Ex perim ent al V alid atio n of Mixt ure Th eory Mo del The accurac y of the computational model was confirmed with experimental measurements performed in a ph y siolo gically representative 3D vascularized in vitro tumor microenvironment. Essential model paramete rs such as tissue porosit y, vessel porosity, solute permeabilit y, and solute diffusivity were measured using the in vitro platform and implemented in the model ( Table 2 ). The concentration-time histories were obt ained from the mixture theory equations using the minimum, maximum, and mean valu es of the ti ssue parameters measured from in vitro platform. The simulation results were also compared with experimental measurements of from dextran transport in the same vascularized in vitro platf o rm ( Figure 2 ). Details e x plaining the fabrica tion and measurement processes can be found in the appendix B. Exp erime ntal an d nu mer ical c ompa rison of con cen trati on-tim e his tories Numerical simulations for the model validation studies were sep arately processed with identical tissue properties and boundar y conditions as obtained from the ex periment. The intensit y-time histories were spatiall y a veraged at a radial location of 600 m. These were normalized by th e maximum intensity inside the vessel at that ti me instant. For each of 3kD a and 70kDa solutes, transport was studi ed in N=3 tissue samples with identical fabrication parameters. Th e normalized in tensity profile of dextran particles fr om these ex periments corresponds to the norma lized concentration fr om the numerical simulations ( Figure 2 ). The err o r bars c o rrespond to the experimental variabilit y observed across 3 samples at each time instant. For 3kDa, the smaller solute, the experimental data till 1 hr matches well with the simulation curve from maximum values of input parameters. Th e deviation of experiment al results from mean simulated values decreases with increasing time from 1hr to 2 hrs. The experimental data for the 70 kDa solute almost coincide with the mean simulation curve and is closely enveloped b y the maximum and minimum simulation curves. To our knowledge, this is the first in vitro model that measured different porosity values in the extravasc ul ar and intravascular spaces. Table 2 : Parameters from the fabricated tissue platform used in the equivalent sim ulation Parameters from fab ricated tissue platform Mean Min Max Vessel diameter ( m) 715 - - Tissue diameter ( m) 3000 - - Tissue Porosity 0.53 0.49 0.59 Vascular Porosity 0.4 0.37 0.43 Solute Diffusivity ( /s) 3 kDa: 25e-11 70 kDa: 4.3e-11 3 kDa: 20e-11 70 kDa: 3.7e- 11 3 kDa: 30e-11 70 kDa: 4.9e- 11 Solute Permeability (m/s) 3 kDa: 32e-8 70 kDa: 9e-8 3 kDa: 24e-8 70 kDa: 7e-8 3 kDa: 43e-8 70 kDa: 11e-8 Hydraulic Permeability ( ) 1e-12 - - 7 Figure 2 : Comparison of experimental and numer ical n ormalized concentration-time histories for 3kDa and 70 kDa solutes in a single capillary cancer tissue. a) The numerical curve under predicts the mean exper i mental concentration in earlier times and overpredicts in later times. b) The percentage deviation of the simulation concentration from the mean experimental concentration. For 70kDa the deviation is least at 1 hour while for 3kDa it is least at 2 hours. Vas cula r Tis sue Con fig urati ons and Tes t M atrix In the current stud y three geometrica l configurations of the vessels in the tissue are considered: the sing le blood capillary (SBC) c on figuration, the double blood c apillary (2 BC) configuration, the blood capillary and the l ymph vessel (BC_LC) configuration. These are shown in Figure 3 along with the transport pathwa ys. The tasks were split int o 3 tests listed in Table 3 . The flow direction is same (CO) in parallel mic rovessels for tests 1 a nd 3. The intercapillary distan ce (L) in the dual-microchannel configurations is 100 m in t ests 1 and 2 (27, 46, 50). The c hoice of flow parameters, tissue matrix properties and solute dependent par ameters in each test are depicted in Table 1 . 8 Table 3 : Test matrix developed for conducting the study Configuration Flow Direction Type Intercapillary separation ( ) Solute Molecular weight (kDa) Test 1 : Effect of solute size SBC N/A N/A 0.1, 3.0, 10.0, 40.0, 70.0 2 BC CO 100 0.1, 3.0, 10.0, 40.0, 70.0 BC_LC CO 100 0.1, 3.0, 10.0, 40.0, 70.0 Test 2 : Effect of flow direction in micr ov essels 2 BC CO 100 0.1, 3.0, 10.0, 40.0, 70.0 2 BC CN 100 0.1, 3.0, 10.0, 40.0, 70.0 BC_LC CO 100 0.1, 3.0, 10.0, 40.0, 70.0 BC_LC CN 100 0.1, 3.0, 10.0, 40.0, 70.0 Test 3 : Effect of intercapillary separation SBC N/A N/A 3.0, 10.0 2 BC CO 10,50,100,250,1250 3.0, 10.0 BC_LC CO 10,50,100,250,1250 3.0, 10.0 Figure 3 : Three sche matic tissue configurations w ith transport pathways that have been numerically m odelled. A) single capillary e mbedded in tissue cylinder B) parallel f low bloo d capillaries in tissue cylinder C) ly mph vessel parallel to blood vessel enclosed in tissue cylinder. d is the capillary diameter, L is th e inter capillary separation and D is tissue diameter. 9 Table 4: Intercapillary distance from invivo tissues with capillary diame er, d=10 Tissue Type Intercapillary Separation (L, ) L/d References Rat mammary tumors 50 5 (44) Rabbit neoplastic tissue 101 10.1 (48) Mammary carcinoma 80-135 8-13.5 (49),(51),(50),(46) Normal breast tissue 215 21.5 (51) Human large intestine 107 10.7 (52) Human colorectal tumor periphery 54 5.4 (53) Human colorectal tumor center 177 17.7 (53) Test 1: Effect of solute size on transport Five solutes (0.1 kDa, 3 kDa, 10 kDa, 40 kDa, 70 kDa) are injected at the inlet of the blood capillaries in each configuration to delineate the effect of solute size on transport. The geometry, hydraulic parameters and transport properties of the solute molecules in a breast tumor are in Table 1. The transport properties of 0.1 kDa solute are estimated from the calibration model developed in (14). Test 2: Effect of flow direction in capillaries on transport The second test investigates the influence of co-current flow and counter-current flow in both 2BC and BC_LC tissue configurations and c ompa res the solute transport mechanisms with the SBC configuration. Test 3: Effect of intercapillary separation on transport In the third test, the capillary separation ( L) is varied with respect to blood capillar y diameter (d), (L/d=1, 5, 10, 25, 125), to test the solute a ccumulation in the ti ssue space as compared to t he SBC configuration. Due to longer computational time, this test is run for two solutes, 3kDa (representative of a the rapeutic drug) and 10 kDa ( representative of the size of dru g carr y in g nanoparticle). The intercapillary separation, L , is defined as the shortest distance measure d between all non -adjacent capillary pairs in a loop (44) . The tissue diameter (D) is twice the separation v alue (D=2 L) to maintain the same volum e of tissue around each mic rovessel with respect to the S BC c on figuration. The a vera ge extravascular concentration is calculated at a ra dia l distance 0.2L from the blood vessel wall in SBC configuration (C SBC ) as well as in the 2 BC configuration (C 2BC ). The percentage concentration deviation shown in Figure 6 a is compared across different values of intercapillary separation. The intercapillar y distances for different tissue 10 types in humans and small animals are recorded in Table 4 . The blood capillary diameter, d, is 10 in accordance with the values reporte d in lit erature across humans, mice an d rats (44, 46, 47) . The L /d for tissue type s shown in Table 4 lies between 5 and 21.5. So the analysis was performed for L/d=1, 5, 10, 25 and 125 for two solut e molecular weights of 3.0 kDa and 10 kDa. For all the tests, the average extravascular concentration in the tissue volume surrounding the blood capillary is measured for each configuration. Th ey are normalized b y the maximum intravascular concentration in the blo od capillary volum e and the con centration-time history for each test is analyzed in the Results section. No n-Di men sio nali zatio n of the Con vec tion- Dif fusio n-De cay pro cess The final objective of this paper is to assimilate results of tests 1,2 and 3 to provide a unique non- dimensional time a t which tissue solute concentra t ion is maximum. The solute conce ntration-time histories in specific radial locations of the tissue space a re influen ced b y the dra ina ge of the solutes in addition to the advection diffusion and deca y processes as modelled by Eq 1 . S is the surface area density of the micro vessels whose walls act as a sink in the ti ssue volume. The product of S and solute permeability ( ) is the decay constant k. We define as the time when the inlet concentration drops to 36.7% of the maximum inlet conce ntration. The first form of Eq 1 is non- dimensionalized to find the time scales of the other transport mechanisms involved. Defining the following scaled variables * ; * ; * ; * s f sf c t x u C t x U Co L U o , where Uo is the average velocity of fluid in tissue. Substituting these in Eq 1 ; we get the non-dimensional form as shown in Eq 2 . . .( ) . .( ) s s s s s f tissu e F s s s s s s f tissu e Fd c R u c D c kc t c R u c D c P Sc t Eq 1 2 * * . * .( * ) * * s tissue s f s s s F C Uo D R U C C kC t L L Eq 2 The effect of on the solute accumulation in a tissue space is modified b y the numbe r of microvessels (n) pres ent around it and th e intercapillary s eparation (L/d) between them. The solute dependent timescales, obtained from Eq 2 are the modified input time scale ( ), the diffusion timescale ( ) and the de cay ti mescale ( ). These values for ea ch solute in a SBC config uration are shown in Table 5 . Since different timescales are dominant at different phases and radial locations of transport for differing solute t ypes, a sum of all the solute dependent time s cales is used to non-dimensionalize the time of solute accumulation and de ca y in tissue as shown in Eq 3. 11 2 * 1 tissu e t T LL n d D k Eq 3 The extravascular concentration is rescaled to account for the variable so lute molecular weight (Mw), solute densit y ( ), tiss ue porosity and vary i ng int ercapillary separation ( L/d) as defined by Eq 4 . Table 5 :Solute dependent timescales that influence concentration in tissue across tim e Solute (kDa) Input timescale ( ) (s) Diffusion tim escale ( 2 tissue L D ) (s) Decay timescale (1/k) (s) 0.1 284.5 25.4 125 3 440.1 133.4 574.7 10 604.8 241.7 1428.6 40 1302 328.2 3030.3 70 2319 778.9 3333.3 Results Tes t 1: Effec t of sol ute s ize in th ree conf igu ration s fo r fi xed i nte rcap illary se para tion The effe ct of solute siz e i n the double blood capill ary (2 B C) a nd th e blood capillary - l ymph v essel (BC_LC) confi gurations compar ed to the single ca pillary (S BC) is shown in Figure 4 . The tissue volume surrounding each capillary is equal. The concentration-time history essentially shows an initial accumulation period until the solu te reaches its maximum concentration in the ti ssue space, then it is followed b y a concentration deca y . I t is observed in the accumulation phase of the SBC configuration ( Figure 4 a inset) the 0.1 kDa , 3 kDa and 10 kDa solutes attain peak concentration *. L C Mw d Eq 4 12 with 41.3%, 40.3% and 30.7% of their max imum intra vascular concentrations at 0.04, 0.07, and 0.12 hour respectivel y whereas h eavier solutes like 40 kDa and 70 kDa attain 26.9% and 30.5% of their maximum intravascular concentrations at 0.22 and 0.35 hour respectively. Figure 4:Extravascular concentration-time history of five solutes in a) the SBC configuration b) The 2 BC configuration and c) the BC _LC configuration. Solute conce ntration in the tissue space decreases w ith time an d varies with solute size. The inset in each sub plot is a magnified view to show the concentration variation at e arlier ti mes for all three vessel configurations. Extravascular solute concentration reduces in a double blood capillary (2BC) conf iguration and dec reases further in a lymph and blood capillary (BC_LC) configuration compared to single capillary (SBC) configuration. The time taken for 0.1 kDa, 3 kDa and 10 kDa solu tes to reduce to 10% of their maximum intravascular concentrations are 0.43, 0.47 and 0.62 hour respectively whereas the same for the 40kDa and 70kDa solut es are 1.57 and 3.25 hours respectivel y. The peak tissue concentration for 0.1 kDa, 3 kDa, 10 kDa, 40 kDa and 70 kDa solutes decreases by 25%, 28%, 31%, 28% and 25% respectively in the 2 BC config u ration ( Figure 4 b inset) and by 55%, 52%, 50%, 53% and 40% respectively in the B C_ LC configuration ( Figure 4 c inset) with respect to t he SBC configuration. In comparison to the SBC tissue peak concentration, the peak occurs at later times ( F igure 4 b) in 2 B C configurations (3 kDa : 0.11 hour vs 0.07 hour; 10 kDa: 0.16 hour vs 0.12 hour; 40 kDa: 0.35 hour vs 0.22 hour) and at earlier ti mes ( Figure 4 c) in BC_LC configurations (3 kDa: 0.05 hour vs 0.07 hour; 10 kDa: 0.07 hour vs 0.12 hour; 40 kDa: 0.16 hour vs 0.22 hour). For the smallest solute 0.1 kDa, the concentration attains peak value later compared to its SB C counterpart (0.04 hour) in both the 2 BC ( 0.07 hour) and BC_LC (0.05 hours) ti ssue sp aces . On the cont rary the 13 largest 70 kDa solute attains peak concentration earlier in both 2 BC (0.29 hour) a nd BC_LC (0.1 3 hour) extravascular spaces compared to its SBC counterpart (0.35 hour). The 70 kDa solute, however, ex hibits a faster onset of concentration de cay both in th e 2 BC and B C_ LC configuration (SBC: 0.35 hour; 2 BC: 0.29 hour; BC_LC: 0.13 h our) while a d elayed conc entration deca y is seen for the 0.1 kDa solute (SBC: 0.04 hour; 2 BC: 0.07 hour; BC_LC: 0.05 hour). Tes t 2: Effec t of flow d irect ion i n m icro vess els The microvessel flows c o nsidered in test1 are in the same axial dire ction and are called co-current (CO) flows. The y are compared with oppositely directed ax ial flows in the mi crovessels which are called counter current (CN) flows. Figure 5: Extravascula r concentration-time hi story of five solu tes for a) Co -current (CO) flow in microvessels in 2 BC configuration b) Counterflow (CN) in microvessels in 2 BC configuration c) Co-current (CO) f low in micr ovessels in BC_LC configuration and d) Counterflow (CN) in microvessels in BC_LC conf iguration Counterflow (CN) reduces the solute concentration in tissu e space more than co-current f low (CO) in parallel capillary configuration. The effect is m o re pronounced for the 2BC configuration at earlier times. Figure 5 compares the CN flow with the CO flow for 2 BC configuration and BC_L C configuration respectively. In both configurations there is no difference between the two flow types du ring the solute accumulation phase in the ti ssue. As the tissue con centration de cays, th e 14 extravascular solute concentration is less in CN flow at later times comp ared to CO flow. The percentage reduction in concentration is more pronounced for lar ger (10 kDa: 0.5%; 40 kDa: 1.7% ; 70 kDa: 2.5 % ) solutes in 2 BC config u ration ( Figu re 5 a, Figure 5 b). A simil ar observation is made in Figure 5 a, Figure 5 b for heavier (10 kD a: 0.12%; 40 kDa: 0.4%; 70 kDa: 0.5%) solutes but the difference is less in BC_LC configuration ( Figure 5 c, Figure 5 d) compared to the 2 BC configuration. Tes t 3: Effec t of int erc apill ary s epa ratio n on tra nspo rt o f 3 kDa a nd 10 k Da solu tes The intercapillary separation (L) was varied with respect to the vessel diameter (d) in the next set of tests for the 2 B C and BC_LC configurations. We calculated the average extravascular concentration at a radial distance 0.2L from the blood vessel wall in SBC configuration (C SBC ) as well as in the 2 BC configuration (C 2BC ) where L is the intercapillary separation ( Figure 6 a). The percentage deviation between these two terms is plotted in Figure 6 b across different values of non-dimensional intercapillary s eparation (L/d=1, 5, 10, 25, 125) for 3 kDa and 10 k Da solute. The dotted li nes represent L/d values of 5 ( ye llow) and 21.5 (purple) which are the lower a nd upper limits of normalized intercapillary separation in breast tumors. L/d values above 21.5 are typically found in normal (non-diseased) tissues. Figure 6 : a) Schem a tic showing the setup and the calculation of % concentration deviation. b) In tercapillary separation (L/d) between 5 and 25 shows significant deviation of solute concentration in 2 BC and BC_LC c onfigurations compare d to SBC configuration for 3 kDa and 10 kDa solute sizes. 15 Doub le B lood Capill ary (2 BC) embe dded in tiss ue c ylind er The 2 BC configuration shows mi nimum deviation (3 kDa: 1.5%; 10 kDa: 2.5%) from the SBC configuration for L/d=1 ( Figure 6 b). This is beca use the spacing between two blood capillary walls is so small that they effectively function as a single capillar y with twice the original capillar y diameter. So the solute accumulation almost the resembles that in a SBC configuration. The solute concentration deviation is substantial (9-33 %) for L/d=5-25 which is the range of interest as depicted in Table 4 . The isolated capillary assum ption will not hold true for ex travascular solute accumulation in this regime. The deviation (3 kDa: 4.7%; 10 kDa: 8.5%) reduces for L/d=125 because the large spacing between capillary walls minimizes the cumulative effect of the two blood vessels on the peak tissue concentration. Blood Cap illary and Lymp h Cap illar y (BC_ LC) e mbed ded in tiss ue cylin der The B C_ LC configuration ( Figure 6 b) shows minimum deviation (3 kDa: 7.4%; 10 kDa : 7.3%) from the SBC configuration for L /d=125 due to the same reason as the 2 BC configuration. But with decrea sing L/d the sink action of the lymph vessel be come increasingly dominant resulting in 44%-55% deviation of the maximum solute concentration in tissue volume from that in the corresponding SBC configuration in the L/d regime of 1 to 25. Non- dime nsion al Ti me vs Pea k Non- dimen sion al Co ncen tration An alysis The results discussed in the previous cases h ave shown that the variation of s olute size, microvessel arrangement, number of microve ssels and intercapillar y separation all contribute differently to th e solute accumulation time vs solute deca y t ime in the tissue space. Hence the non -dimensional extravascular solute co ncentration and non-dimensional time defined in Eq 4 and Eq 3 respectively were calculated for all test cases to account for variations of these four param eters. The non-dimensional p rofiles for fix ed L/d=1, 5, 10, 25, 125 wer e plo tted in Figure 7 a. All concentration pea ks lie within T*=0.1 shown b y the dotted bl ack line. So, in Figure 7 b the scaled concentration time-histories from T*=0 to T*=0.1 were a nal yzed. The peaks were e x tracted and plotted in Figure 7 c. The red curves that correspond to the largest intercapillar y distanc e ( L/d=125) have values which are o ne order of magnitude le ss than the average . This is because for a large L, the second vessel does not contribute to the solut e ac cumulation in the mea surement location which is at a dist ance 0.2L from the first blood vessel. The concentration gradients across each capillar y wall dy n amically ch ange the extravascular flux across the wall a nd for a large L the solute ma y get trapped within a certa in distance of the capillar y. The non-dimensional equations do not account for these a nd henc e the deviation of for L/d=125. It was c oncluded that the average non-dimensional time at which the peak concentration occurs in all configurations for all solutes is =0.0 0.018 ( Figure 7 c). 16 Figure 7 : a) Non-dimensional concentration time history (T* vs C*) for all solu te size s in all tissue c onf igurations w ith varying intercapillary separation b) A magnified view of the non- dimensional concentration time h istory to identify tim e occurrences of peak conce n trations (C*) c) The peak concentration (C*) values are plotted separately to f ind an average non - dimensional time of occurrence as 0.027 ( ) 0.018 ( ). Discussion We present a numerical model for breast tumor that can predict passive transport of nanoparticles across a mul tilayer barrier when the tissue architecture and nanoparticle properties are specified. The solute size (molecular weight and hydrody n amic diameter) influences its extravascular concentration dy namically across time. Smallest s olutes are c le ared faster from the tissue but the y are also susceptible to getting trapp ed in the recirculation zone set up b y countercurrent blood flow in adjacent vessels (54, 55 ). High clearance rates measured for solutes <10 kDa during in vivo measurements in tumors validate this observation. The ther apeutic outcome of brea st cancer drugs (Doxorubicin: 0.54 kDa; Cisplatin: 0.3 kDa) having similar mol ecular weight as the smallest solute investigated here can now be predicted for patient-specific tumor biopsies. Heavier nanoparticles (50 -200 kDa) are preferred vehicle s for the tumor location specific targeting and drug deliver y(55, 56). Acc ordin g to the results, he avier solutes with hydrodynamic diameter (5 -14 nm) take longer to attain maximum accumulation at a spec ifi c tissue location and are also removed slowl y ((57, 58) ). Presence of adjacent bl ood vessels with counter-current flow accelerate the clearance process owing to drainage from both ends of the tissue. Presence of a lymph vessel 17 reduces the magnitude of their peak concentration considerably owin g to high permeability cross the l y mph capillary wall. In various in vitro / in vivo studies the lymph wall is shown to allow unidirectional flow onl y (59-62) that facilitates better drainage. Easy removal of a ll sizes of drugs through the lymphatic system contributes to role of lymphatics in worse response(63). Blood vessels hav e been mostly modelled as non-porous structures permeable to solut es embedded in the flow (64, 65). To o ur knowledge, this is the first numerical model that account for endoth elial porosity directly measured from dextran transport in an in vitro bre ast tumor model. Additionally , this work shows inclusion of multiple vessels in a tumor numerical model is necessary to accurately measure trans port phenomena. The SBC assumption works onl y for tissues wh ere capillaries are so close (L/d=1) that they act as a single vessel, e. g when nearb y l ymph vessels collapse (59, 60 , 62, 63) during metastasis of some cancers or if they are s o fa r apart (L/d=125) that the solute flux from one does not reach the other. The dextran transport investigated using a fabricated 3D microfluidic plat form measured tissue porosity, e ndothelial por osity, na nopa rticle permeability and nanoparticle diffusivity. Sim ulations driven b y these parameters showed a close correspondence of numerical and experimental concentration-time histories. These parameters, when reported in literature, span over several orders of magnitude. The wide range can be attributed to the complex in vivo measurements whos e intrusive nature would perturb the ti ssue microenvironment ( 17, 66). Thus, the ability to measure these parameters in v itro can be used to desi gn futur e non-invasive transport investigation studies. Condensing all the effects of tissue architecture, solute and fluid transport properties, there ex ists a unique time at which nanoparticle concentration in the tissue is maximum. Previous analytical solutions of a convective-dispersive solute tra nsport equa tion with ti me -dependent inlet boundary condition (67, 68) have shown the d ependence of time constant on the input timesc ale, convection timescale, deca y timescal e and the di ffusion timesca les but did not account for vary in g intercapillary separation. L at er Chapman et al. and other rese archers (8, 12, 69) modeled transport in tumors characterized by intercapillary separation but did not account for the dynamic change of hydraulic permeabilit y as a function of concent ration gradients which in turn modulates the extravascular solute flux. The pre sented work, for the first time, analyzes the solute conce ntration in the tissue in the li ght of mixture theory equations for var ying solute t ypes, two p arallel microvessels, differing flow directions in parallel vessels and tissue architecture and proposes a non-dimensional time at which solute conce nt ration is max imum in the tissue. Since this approach non-dimensionalizes the intercapillary separation (L) with the vessel diameter (d), can be pr edicted for tissues ranging over se veral scales and also for different disease stages (cancer vs normal). This prediction would aid in efficient e ndotheli al tar geting, tri ggering drug r elease and laser ex citation for photothermal therapies (70-72). The estimation can hugely impa ct the clinical landscape as it woul d c ustomize treatment based on tumor specificit y. Future studies with varying nanoparticle design, changing dosage, presence of mag netic targeting, receptor binding can all be im plemented first to the mix ture theory mod el whose predictions would increase the efficacy of the targeted drug delivery in patient specific tumor s. 18 The major limitation associated with the study is simplification of the complex vascular network. The tortuosit y and diameter variation of the microvessels were ne glected. The extracellular matr ix was considered stationary and not allowed to defor m. A zero flux boundary condition was prescribed at each mi crovessel outl et which deviates from the ph ysiological condition where a constant solute flux is drained to other organs like the liver from the microvessel outlets. Conclusion The stud y described in this paper focuses on quanti fication of solute transport across parallel blood vessels and initial lymph vessels in the light of mix ture theory. Tr ansport of nanoparticles to the targeted tumor volume is defined by the transport throu gh microchannels, diffusion across endothelium and transport within the porous matrix , all of which were accounted for in the presented work. The re su lts show that the solute siz e strongly influences its own rate o f removal and ra te of accumulation in the tissue. The flow physics in the extravascular space facilitate tissue drainage of nanoparticles depending on the solute size, the intercapillary separation and the microvessel arrangement in the tissue. A unique non-dimensional time was reported for the first time. This is the time at which peak concentration of a nanoparticle occurs at an y tissue loc ation, irrespective of the solute size, the intercapillary separation and the microvessel flow direction. The knowle dge of the nanopar ticle introduction time, tissue mechanical properties a nd solute dependent pro perties will allow, in future, to design in vitro tissue models testing varying nanoparticle designs and concomitantl y, predict for patient specific tumors, the appropriate time o f dru g r elease that can subst antially improve drug efficacy. Acknowledgement We would l ike to acknowledge funding provided by the National I nsti tutes of He alth Grant 5R21EB019646. We would like to thank Professor Eric Nauman for introd ucing us to the mixture theory model for solute and fluid transport in tissues. Conflict of Interest There is no conflict of interest to report. 19 References 1. Mariotto AB, Yabroff K R, Shao Y, Feuer EJ, Br own ML. Projections of the cost of cancer car e in th e United States: 2 0 10-2020. J ournal of the National Canc er Institute. 2011;103( 2):117 - 28. 2. Nie S, Xing Y, Kim GJ, Simons JW. Nanotechn ology ap plications in cancer. Annual review of biomedical engine ering. 2007;9:257- 88. 3. Haley B, Frenkel E. Nano particles for drug d elivery in cancer treat ment. Urologic onco logy. 2008;26(1):57- 64. 4. Arruebo M, Fernández-Pacheco R, Ibarra MR, Santamaría J. Magnetic nanoparticles for drug delivery. Nano toda y. 2007;2(3):22- 32. 5. Wang AZ, Langer R, Faro khzad OC. Nanoparticle delivery of can cer d rugs. An nual review of medicine. 201 2 ;63:185- 98. 6. Matsumura Y, Maeda H. A new concept for macromolecular therapeutics in cancer chemotherapy: mechanis m of tumoritropic accumulation of proteins and the antitumor agent sman cs. Cancer research. 1986;46(12 Pt 1):6387- 92. 7. Zervantonakis IK, Chung S, Sudo R, Zhang M, Charest JL, Kamm RD. Concentration gradients in microfluidic 3D matrix cell culture sy stems. Int ernational Journal of Micro-Nano Scale Transport. 2010;1(1):2 7 -36. 8. Shipley RJ, Chapman SJ. Multiscale modelling of fluid and drug transport in v as cular tumours. Bulletin of mathe matical biology. 2010;72(6) :1464 -91. 9. Baxter LT, Jain RK. Transport of flu id and macromole cules in tumors. I. Role of interstitial pressure and convection. Mi crovascular research. 198 9 ;37(1):7 7 -104. 10. Pozrikidis C, Farrow DA. A mo del of fluid flow in so lid tumors. Annals of biomedi cal engineering. 2003;31(2):18 1 -94. 11. Sefidgar M, So ltani M, Ra ahemifar K, Sadeghi M, B azmara H, Bazargan M, et al. Nu merical modeling of drug delivery in a dynamic solid tumor microvasculature. Microvascular research. 2015;99:4 3 - 56. 12. Penta R, Ambrosi D, Quarteroni A. Multiscale homogenization for fluid and drug transport in vascularized malignant tissues. Mathematical Models and Metho ds in Applied Sciences. 2015;25(01): 7 9- 108. 13. Schuff MM, Gore JP, Nauman EA. A mixture theory model of fluid and solute transport in the microvasculature of normal and malignant tissues. I. Theory. Journal of mathematical bio logy. 2013;66(6):11 79 -207. 14. Schuff MM, Gore JP, Nauman EA. A mixture theory model of fluid and solute transport in the microvasculature of normal and m alignant tissues. II: Factor sensitivity analysis, calibration, and validation. Journal of mathematical biology. 2 013;67(6-7):1307-37. 15. Taylor DG, Bert JL, Bowen BD. A mathematical model of interstitial transport. II. Microvascular exchange in me sentery. Microvascular r esearch. 1990;39(3):2 7 9-306. 16. Taylor DG, Bert JL, Bowe n BD . A mathematical model o f interstitial transp ort. I. Theory. Microvascular res earch. 1990;39(3):253-78. 17. Victorino GP, N ewton CR , Cu rran B. Effect of h ypertonic saline on m icrovascular permeabi lity in the activated end othelium. The Journal of surg ical research. 2003;112(1): 7 9- 83. 18. Goins AB, Sanabria H, Waxham MN. Macr omolecular cro wding and size effects on probe microviscosity. Bi ophysical journal. 2008; 9 5(11):5362- 73. 19. Armstrong JK, Wenb y RB, Meiselman HJ, Fi sher TC. The hydrodynamic radii of macromolecules and their effect on r ed blood cell aggregati o n. Biophy sical jo urnal. 20 04;87(6):4259- 70. 20 20. Ekani-Nkodo A, Fygens o n DK. Size exclusion and d iffusion of fluoresceinated probes within collagen fibrils. Physi cal review E, Statistical, n onlinear, and soft matter p hysics. 2003;67(2 Pt 1):021 909. 21. Ballard K, Perl W. Osmotic reflection coefficients of canine subcutaneous adipose tissue endothelium. Microvascular research. 1978; 16 (2):224- 36. 22. Michel CC. Filtration coefficients and o smotic reflexion coefficients of the wa lls of single fro g mesenteric capillar ies. The Journal of physiol o gy. 198 0;309:341 - 55. 23. Yuan F, Salehi HA, Boucher Y, Vasthar e US, Tuma RF, Jain RK. Vascular permeability and microcirculation of gliomas and m ammary carcinomas transplanted in rat and mou se cranial windows. Cancer research. 1994;54(17):4564- 8. 24. Baxter LT, Jain RK. Vascular permeability and interstitial diffusion in superfused tissues: a two- dimensional model. Microvascular research. 1 988;36(1):108-15. 25. Baxter LT, Jain RK, Svensjo E. Vascular permeability and in terstitial diffusion o f macromolecules in the hamster chee k pouch: effects of vasoactiv e drugs. Microvascular re search. 1987;34(3) :336 - 48. 26. Dreher MR, Liu W, Micheli ch CR, Dewhirst M W, Yuan F, Chilkoti A. Tumor vascular perme ability, accumulation, and p enetration of macromol ecular drug carriers. Journ al of the National Cancer In stitute. 2006;98(5):33 5 -44. 27. Nugent L J, Jain RK. Extravascular diffusion in normal and neoplastic tissues. Cancer research. 1984;44(1):23 8 -44. 28. Maroudas A. Distribution and diffusion of solutes in articular cartilage. Biophysical journal. 1970;10(5):36 5 -79. 29. Fox JR, Wayland H. Interstitial diffusion of macromole cules in the rat mesentery. Microvascular research. 1979;1 8(2):255-76. 30. Leddy HA, Guilak F. Site-specific molecular diffusion in articular cartilage measured using fluorescence rec overy after photobleaching. An nals of biomedical engine ering. 2003;31(7):753-60. 31. Nakamura Y, Wayland H. Macromolecular transport in the cat mesentery. Microvascular research. 1975;9(1):1- 21. 32. Heldin CH, Rubin K, Pietras K, Ostman A. High interstitial fluid pressure - an obstacle in cancer therapy. Nature re views Cancer. 2004;4(10) :806 - 13. 33. Lipowsky HH, Zweifach BW. Methods for the si multaneous measurement of pressure differentials and flow in single unbranched vessels of the microcirculation for rh eological studies. Microvascul ar research. 1977;1 4(3):345-61. 34. Zweifach BW, Lipowsky HH. Quantitative studie s of microcirculator y structure and function. III. Microvascular hemodynamics of cat mesentery and rabbit o mentum. Circulation research. 1977;41(3):38 0 -90. 35. Asaishi K, Endrich B, Gotz A, Messmer K. Quantitative analysis o f microvascular structure and function in the a melanotic melanoma A-Mel-3. Cancer research. 1981;41(5) : 1898-904. 36. Stohrer M, Boucher Y, Stangassing er M , Jain RK. Oncotic pressure in so lid tumors is elevated. Cancer research. 2000;60(15):4251- 5. 37. Jain RK. Transport of molecules in the tumor interstitium: a review. Cancer rese arch. 1987;47(12):3 039 -51. 38. Boucher Y, Kirkwood JM, Opacic D, Desantis M, Jain RK. Intersti tial hypertension in superficia l metastatic melan omas in humans. Cancer res earch. 1991;51(24 ):6691 - 4. 39. Nathanson SD, Nelson L. In terstitial fluid pressur e in breast cancer, benign breast conditions, and breast parenchy ma. Annals of surgical oncol ogy. 1994;1(4):333- 8. 40. Serpooshan V, Julien M, Ng uyen O, Wang H, Li A, Muja N, et al. Redu ced hydrau lic permeabilit y of three-dimensional collagen scaffolds attenuates gel contraction and promotes the growth and differentiation o f mesenchymal stem cells. Acta biomateriali a. 2010;6(10):3978- 87. 21 41. O'Connor SW, Bale WF. Accessibility of circulating immunoglobulin G to the extravascular compartment of solid rat tumors. Cancer research. 1 984;44(9):3719- 23. 42. Gullino PM, Grantha m FH, Smith SH. The Interstitial Wate r Space of Tumors. Cancer research. 1965;25:727-31. 43. Appelgren L, Peterson HI, Rosengren B. Vascu lar an d extra vascular spaces in tw o transplan table tumors of the rat. Bibli otheca anatomica. 1973; 12:504- 10. 44. Less JR, Skalak TC, Sevick EM, Jain RK. Microvascula r architecture in a mammary carcinoma: branching patterns and vessel dimensions. Cancer r esearch. 1991;51(1):2 65 - 73. 45. Smaje L, Zweifach BW, Intaglietta M. M icropressures and capillary filtration coefficients in single vessels of the cre m aster m uscle of the rat. Microvasc ular research. 1970;2(1): 96 -110. 46. Edel MJ, Robbins PD, P apadimitriou JM, D'Antuon o MF, H arvey JM, Mi tchel CA, et al. Assessment of vascularity in breast carcinoma by computer-assisted video analysis (CAVA) and its association with axillary lymph n o de status. Breast cancer research and treatment. 1998;47(1):1 7 - 27. 47. Hilmas D E, Gillette EL. Morphometric analyses of th e microvasculature of tu mors during growth and after x-irradiation. Can cer. 1974;33(1):10 3 -10. 48. Gerlowski LE, J ain RK. M icrovascular permeability of normal and neoplas tic tissue s. Microvascula r research. 1986;3 1(3):288-305. 49. Horak ER, Leek R, Klenk N, LeJeune S, Smith K, Stuart N, et al. Angiogenesi s, assessed by platelet/endothelial cell adhesion molecule antibodies, as indicator of node metastase s and survival in breast cancer. Lancet. 1992;340(8828): 1120 - 4. 50. Yahara T, Koga T, Yoshida S, Nakagawa S, Deguchi H, Shirouzu K. Relationship between microvessel densi ty and thermographic hot ar eas in breast cancer. Surger y today. 2003;33(4):24 3 - 8. 51. Wells WA, Daghlian CP, Tosteson TD, Gro ve MR, Poplack SP, Knowlton-Soho S, e t al. Analysis of the m icrovasculature and tissue type ratios in normal vs. benig n and malignant breast tissue. Analytical and quantitative cytology and histology / the International Academy o f Cy tology [and] American Societ y of Cytology. 200 4;26(3):166-74. 52. Fait E, Malkusch W, Gnoth S, D imitropoulou C, Gaumann A, Kirkpatrick C, et al. Microvascular patterns of the human large intestine: morphometric studies of v ascular para meters in corrosion casts . Scanning Microsc. 1 998;12(4):641-51. 53. Konerding MA, Fait E, Gaumann A. 3D microvascular architecture of pre-cancer ous lesions and invasive carcin omas of the colon. British journ al of cancer. 2001;84(10): 1354 -62. 54. Lu Y, Michel CC, Wang W. Inert g as clearance from tissue by co -currently and counter-currently arranged micro v essels. Journ al of applied physiology. 2012;1 13 (3):487- 97. 55. Malam Y, Loizidou M, Seifalian AM. Liposomes and nanoparticles: nanosized vehicles for drug delivery in cancer. Tr ends in pharmacological sciences. 2009;30( 11 ):592- 9. 56. Yang H-C, Ho n M -H. The effect of the molecular we ight of chitosan nanoparticles and its application on drug delivery. Microchemical J o urnal. 2 009;92(1):87-91. 57. A. Ozkan NG, P.J. Hoopes, M .N. Rylander. In Vitro Vascularized Liver and Tumor Tissue Microenviron ments o n a Chip for Dynamic Determin ation of Nanoparticl e Transport and Toxicity. Biotechnology and Bi oengineering. 2018. 58. R. Michna MG, A. Ozkan, M.R.Dewitt, M.N. Ry lander. Vascularized microfluidic platforms to mimic the tumor micro environment. Biotechnol ogy and Bioengineerin g. 2018. 59. Baxter LT, Jain RK. Transport of fluid and macromol ecules in tumors. II. Role of heterogeneous perfusion and lymphati cs. Microvascular research. 1990;40(2):246-63. 60. Ji RC. Lymphatic endothelial cells, tumor lymphangiogenesis and metastasis: New insights into intratumoral and peri tumoral lymphatics. Canc er metastasis reviews. 2006;25(4):677- 94. 22 61. Pisano M , Triacca V, Barbee KA, Swartz MA. An in vitro model o f the tumor-lymphatic microenviron ment with simultaneous transendothelial and luminal flows reveals mech anisms of flow enhanced invasion. In tegrative biology : quantitati ve biosciences fr om nano to macro. 2015 ; 7(5):525- 33. 62. Swartz MA, Lund AW. Lymp hatic and interstitial flow in the tumour microenvironment: linking mechanobiology with immunity. Nature reviews Cancer. 2012;12(3):2 10 - 9. 63. Shayan R, Achen MG, Stacker SA. Lymphatic vessels in cancer metastasis: bridging the gaps. Carcinogenesis. 2 0 06;27(9):1 729 -38. 64. Alimohamadi H, Imani M, S hojaeizadeh M. N umerical Simulation Of P o rosity Effect On Blood Flow Pattern And Ather o scleroti c Plaques Temperature. 2014. 65. Cheema TA, Kim GM, Lee CY, Hong JG, Kwa k MK, Park CW. Characteristics of blood vessel wall deformation wi th porous wall conditions in an a ortic arch. Applied Rheol ogy. 2014;24(24590) :1 - 8. 66. Mc Geown JG. Passing on the legacy: teaching capillary filtration and developing presentation skills using classic papers. Ad vances in physiol o gy educati on. 2006;30(3):108-12. 67. Chen J-S, Liu C-W. Generali zed analytical solution for advection-dispersion equation in finite spatial domain with arbitrary time-dependent inlet boundary condition. Hydrology and Earth System Sciences. 2011;1 5(8):2471. 68. Van Genuchten MT, Alves W. Analytical so lutions of the one -dimensi o nal convective-disp ersive solute transport equati on. United States Departm ent of Agriculture, Economic Research Service, 19 82 . 69. Chapman SJ, Shipley RJ, Jawad R. Multiscale modeling of fluid transport in tumors. Bulletin of mathematical biol ogy. 2008;70(8):233 4 -57. 70. Cheng MJ, Prabakaran P, Kumar R, Sridhar S, Eb ong EE. Synthesis of Functi o nalized 10-nm Polymer-coated Gold Particles for Endothelium Targeting and Drug Delivery. Journal of visualized experiments : J o VE. 2018(1 31). 71. Lu J, Yang S, N g KM, Su C -H, Yeh C-S, Wu Y-N, et al. Solid-state synthesis o f monocrystallin e ir on oxide nanoparticle based ferrofluid suitable for magnetic resonance imaging contrast application. Nanotechnolog y . 2006;17( 23):5812. 72. Wu W, Wu Z, Yu T, Jiang C, Kim WS. Recent progress o n magnetic iron oxide nanopartic les: synthesis, surface functi onal strategies and biomedica l applications. Science and technology o f advanced materials. 2015; 16(2):023501. 73. Antoine E, Buchanan C, Fezzaa K, Lee WK, Rylander MN, Vlachos P. Flow measurements in a blood - perfused collagen vessel using x-ray micro-particle image velocimetry. PloS one. 2013;8(11):e8 1198. 74. Buchanan CF, Voigt EE, Sz o t CS, Freeman JW, Vl achos PP, Ryland er MN. Three-dimensional microfluidic collagen hydrogels for investigating flow-mediated tumor-endothelial signaling and vascular organization. Tissue engineering Part C, Methods. 2014;20(1):6 4 -75. 75. Buchanan CF, Verbridge SS, Vlachos PP, Rylander MN. Flow shear stress regulates endothelial barrier function and expression of angiogenic factors in a 3D m icrofluidic tumor v ascular model. Cell adhesion & migration. 2014;8(5):517-24. 76. Antoine EE, Vlachos PP, Rylander M N. Tunable collagen I hydrogels f or eng ineered physiological tissue micro-envir o nments. P loS one. 201 5;10(3):e0122500. 77. Antoine EE. Mechanics and transport char acterization of bioengineered tissue microenvironmen t platforms: Virgin ia Tech; 2014. 78. Cross VL, Zheng Y, Won Choi N, Verbridge SS, Suter master BA, Bonassar LJ, et al. Dense type I collagen matrices that support cellular remodeling and microfabrication for stud ies of tumor angiogenesis and vasculogenesis in vitro. Biomaterials. 20 10;31(33):8596-607. 79. Moreno-Arotzena O, Meier JG, Del A mo C, Garcia-Aznar JM. Chara cterization of Fibrin and Collagen Gels for Engin eering Wound Healing Models. Materials. 20 1 5;8(4):1 636 - 51. 23 Appendix A: Mixture theor y model equations Flui d tran spor t Equ ations The arte ri al pressure, P ar, is specifie d at the inlet while the prescribed hydrostatic pressure difference, balances the viscous stresses to govern the fluid flow inside the capillaries according to Eq. 1 . 2 0 f Pu Eq. 1 The fluid flux, , across the capillary wall (of radius Ro) as shown in Eq. 2 accounts for a ) the hydrostatic pressure difference across the capillary wall due to the hy draulic conductivity, , b) a constant osmotic pressur e gradient, , due to protein mol ecules; and c) a variable osmotic pressure that depends on the conce ntr ation difference of the injected solute (of molecular weight and density ) in the intravascular (i) and the extravascular (e) space of a fibrous matrix with porosit y . Eq. 2 The fluid transport in the extravascular space is influenced by a) the hydrostatic pressure difference in the tissue space, b) the hydraulic permeability of the tissue, and c) the solute concentration gradients, in the tissue space as depicted in Eq. 3 . The retardation factor, , is the ra tio of the solute velocit y and the fluid v elocity in the tissue spac e. A constant pressure Po is applied to the tissue boundary. ( ) ( 1 ) 0 s f ss w F s T U A M P P R c k Eq. 3 Solu te tran spor t Equ ation s The initial solut e concentration, , is used to pr escribe the concentration at the inflow according to Eq. 4 . The concentra t ion time history for the f i ve solutes prescribed at the blood vessel inlet is shown in Figure 8 . Th e concentration has been nor malized b y the peak intr avascular concentration of each solute. o 12 60 60 o 0.38 5 7 t , ( 15 ) 15 0.5 ( ), ( 1 5 ) 1 7 .23 ( ) , 2 0.06 2 exp ( 3.66 ) 0.0 035 ex p( 5.7 8 ) inle t tA tA s s s w w w C ts c C e e t s A M A e M e M Eq. 4 24 The advection-diffusion equa tion governs the solut e transport inside the microvessels whe r e is the solute diffusion coefficient is shown below: . .( ) 0 sf c u c D c t E q. 5 Figure 8 : Concentration vs Time profile of five solutes at the blood vessel inlet. The solute particles carried by the fluid flux and those which permeate into the tissue space due to the conce ntr ation difference across the ca pillar y wall constitute the solute flux ( ) ac ross it. Eq. 6 is a modified version of S tarling’s law where is the solute perme abilit y coefficient and is the reflection coefficient. ( | | ) ( 1 ) s s s s s s r Ro r R o e d i e J P c c c q Eq. 6 In the porous matrix of the extravascular space th e solute undergoes both advection and diffusion as shown in the governing transport Eq. 7 . . .( ) 0 s s s s f tissue F c R u c D c t Eq. 7 The mixture theory equations a re a ppropriate for this study since it shows the depe nden ce of tissue mechanical properties like hydraulic condu ctivity on chemical gradients that is not captured b y traditional transport models (13). 25 Diff erenc e of l ymph vesse l inp ut par amet ers fr om t hat of blood vess el Solute concentration is zero at the lymph capillary inlet. The osmotic pressure g radient due to protein molecules is absent in the l ymph vessel, . The solute permeabilit y coefficient, , across the lymph capillary wall is twice its value in blood c apillary wall shown in Table 1 to account for the free permeabilit y of l ymph vessels to macromolecules. The fluid flux and the solute flux equations are modified to allow intravasation only . Appendix B: Fabricati on of micr ofluidic platf orm Type I collagen w as used as the extracellular matrix of the tumor with a sin gle integrated endothelialized blood vessel. Excised tendons from rat tails were dissolved in a pH 2.0 HCl solution for 12h at 23 ˚ C. The solution was centrifuged at 30000g for 45 minutes and sterilized using 10% (v/v) chloroform for 24h at 4 ˚ C. The mold for the in vitro tumor microfluidic platform with the embedded single vessel was fabricated as described in previous work (73 , 74). PDMS housing w as fa b ricated using common soft -lithography methods. Pol ydimethylsiloxane (PDMS) and curing agent was mi xed with 10:1 ratio and b aked at 75˚C for 1 hour. Hardened PDMS housing and the glass cover slip was plasma treated for 18W for 30 seconds. Plasma treated surfaces were assembled to create a permanent bonding. The housing was treated with 1% (v/ v) polyethyleneimine in dH 2 O for 10 min followed by 0.1% (v/v) glutaraldehyde in dH 2 O for 20 min and washed with dH 2 O twice. Collagen solution of 7 mg/ml was prepared by n eutralizing stock solution with 1X DMEM, 10X DMEM, 1N NaOH, and mixing 1x 10 6 /ml MDA-MB-231 breast cancer cells uniformly in collagen which was then placed in the housing. A 22G (711µm) needle was insert ed into the mold and after pol y m erization and the needle removal a cy lindrical vascular channel was created within the collagen. 2x10 6 TIME cells were injected into the vascular channel and exposed to flow preconditioning protocols for 3 days to form a confluent, aligned endothelialized vessel. As a result, in vitro platform shown in Figure 9 was fabricated. Figure 9: 3D v ascularized in vitro microfluidic platform for experimental validation. a) CAD drawing of the platfo rm. b) Confocal image of blood ve ssel with endothelial cells (red) surrounded by breast carcinoma cells (green). 26 Meas urin g me chanic al pr opert ies fr om fab ric ated tis sue p latfor m Por osity Va sculature porosity was measured usi ng confocal microscopy and ima ging mKa t e labeled TIME cells. Scan ning electron microscop y (Zeiss, Super40) was us ed to ima ge 3 fibrous matrix samples under 15kx , 20kx, and 25kx magnifications at three vertical planes. Tissue porosit y was measured by applying a Frangi filter on obtained images. Solu te Per meab ility Obtained intensit y profiles of 3 kDa and 70 kDa Dextran particles were used to calculate solute permeability coefficient as sh own previousl y(75) . 3kDa and 70k Da dextran particles w ere suspended in serum free endothelial basal medium at 10 µg/ml concentration and perfused in the vascular channe l at 260 µ L/min, which corresponds to 1 d yne / cm 2 phy siological shear stress for tumor va sculatures at every 3 min utes for 2 hours. Th e transport of these solut es wa s imaged using a confocal microsc ope ( Leica SP8, 10X mag nification). Normalized intensit y profiles from this images as a function of time were used to compare with normalized concentration profiles from the equivalent numerical simulations. Solu te Diffus ivity Fluore scence re cover y a fter photobleaching (FRAP) technique was used as described previousl y b y Voigt et al. to measure t he diffusion coefficient f or a ran ge of dex tran molecular weights (4 kDa-150 kDa) for varying pH values, colla gen concentrations and temperatures(76, 77). We selected diffusivit y values of 3 kDa and 70 kD a for pH 7.6, collagen concentration 7mg/ml at 37 0 C from the database of the mentioned study . Hyd raulic tis sue per meab ility Hydraulic permeability for collagen at a concentration of 7 mg/ml as is used in fabrication of the platf orm were collected from the existing literature on vascularized in vitro experiments (40, 78, 79).
Original Paper
Loading high-quality paper...
Comments & Academic Discussion
Loading comments...
Leave a Comment