LED Arrays of Laser Printers as Sources of Valuable Emissions for Electromagnetic Penetration Process
Protection of information against electromagnetic eavesdropping is an important issue. Information may be derivable from the shape of an unintended electromagnetic signal. The resulting electromagnetic emanations can be correlated with processing of …
Authors: Ireneusz Kubiak, Joe Loughry
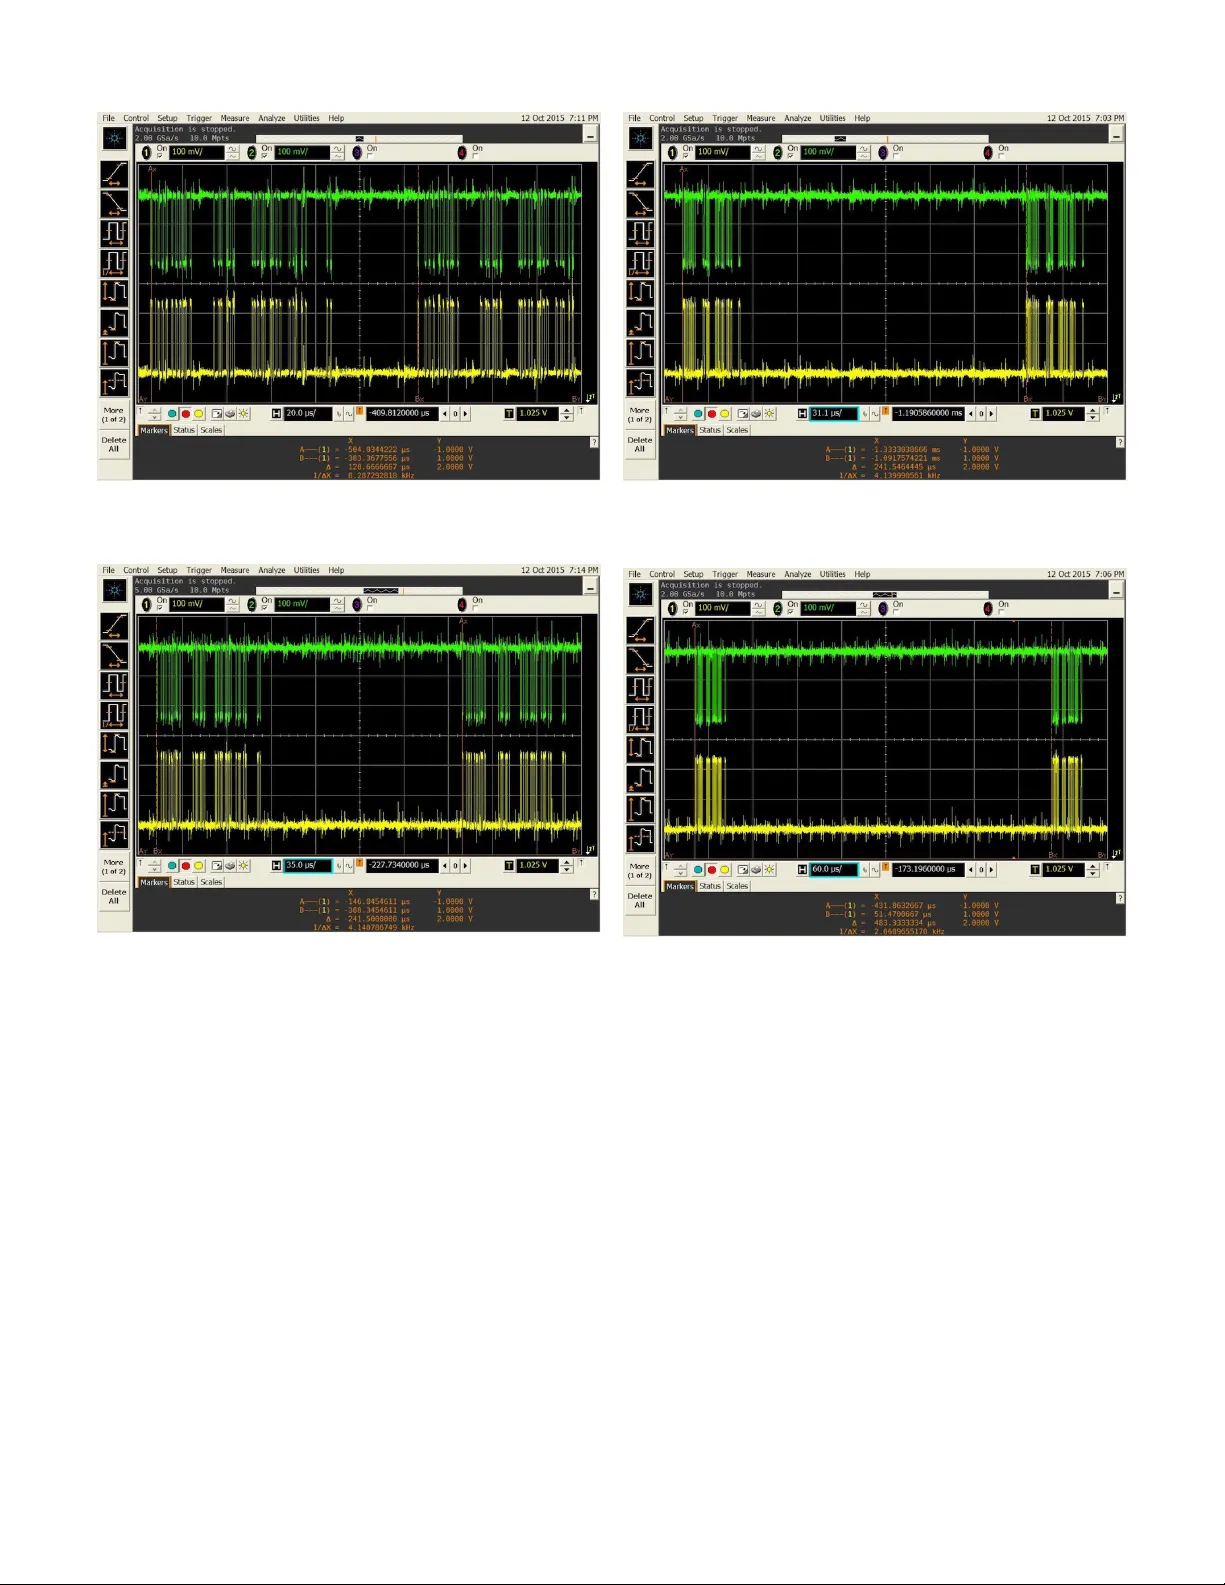
1 LED Arrays of Laser Printers as Sources of V aluable Emissions for Electromagnetic Penetration Process 10th August 2018 Ireneusz Kubiak ∗ and Joe Loughry † Member , IEEE Abstract —Protection of information against electromagnetic eav esdropping is an important issue. Information may be de- rivable from the shape of an unintended electromagnetic signal. The resulting electr omagnetic emanations can be correlated with processing of classified inf ormation. The problem extends to computer printers. This article presents a technical analysis of LED arrays used in monochrome computer printers and their contribution to unintentional electromagnetic emanations. W e analysed two printers from different manufactur ers, designated A and B . The forms of useful signals and their dependence on parameters of printing data are presented. Analyses were based on realistic type sizes and distribution of glyphs. Pictures were reconstructed from received radio frequency (RF) emanations. W e observed differences in legibility of information receiv able at a distance that we attribute to different ways used by printer designers to control the LED arrays, particularly the difference between relati vely high voltage single-ended wa veforms and lower -voltage differential signals. T o decode the compromising emanations required knowledge of—or guessing—printer oper- ating parameters including resolution, printing speed, and paper size. The optimal RF bandwidth for detecting individual pixels has been determined. Measurements were carried out across differences in construction and control of the LED arrays in tested printers, and the levels of RF emissions compared for selected operating modes (fast, high quality , or toner saving mode) of the printing device. Keyw ords: LED array , laser printer, unintentional emis- sion, compromising emanations, electromagnetic eavesdrop- ping, electromagnetic infiltration, recognition and reconstruc- tion, non-in vasi ve data acquisition. I . I N T RO D U C T I O N Printers are one of the basic elements of a computer system. They translate the electronic form of processed data into graphical form during the printing process. As with ev ery electronic de vice, printers are sources of electromagnetic em- anations. Besides control signals, which carry no information ( e.g . , directing the operation of stepper motors or heaters), there are other signals (useful signals) that are correlated with the information being processed. Such emissions are called “sensitiv e” or “valuable” or “compromising” emanations from ∗ Military Communication Institute, W arszawska 22A Str ., 05-130 Zegrze, Poland. Email: i.kubiak@wil.waw .pl † Univ ersity of Den ver , Ritchie School of Engineering and Computer Science, 2155 East W esle y A venue, Den ver , Colorado 80208, USA. Email: joe.loughry@cs.du.edu the point of view of electromagnetic protection of processed information. 1 Processed data may be information displayed on a computer screen or printed (Figure 1). Figure 1. Laser printer as a source of valuable emissions. Like other devices included in a computer system [3], [4], the printer can be subject to electromagnetic infiltration, or eav esdropping [5], [6]. Therefore, efforts to reduce the level of susceptibility to electromagnetic eavesdropping are initiated for such devices. These are unintentionally radiated signals; by ‘infiltration’ we mean exploitation of naturally occurring intelligence-bearing modulation, not the introduction of delib- erately induced vulnerabilities. It is more like E N G U L F than G U N M A N [1], [7]. Organisational and technical solutions 2 are the most often-used methods for limiting infiltration sensitivity of devices [8]. T echnical solutions are limited to changes in the design of devices that typically increase the cost of such devices and sometimes limit their functionality . Therefore, it is desirable to find solutions that av oid these drawbacks and at the same time allo w “safe” processing of classified information [9], [10]. One technical method that is commonly used in the field of electromagnetic compatibility—both to reduce the amount of 1 In fact, concern over compromising emanations from [electromechanical] printing devices extends at least as far back as 1956 [1, [pp. 83–4, 109–111] or 1917 [2, Chapter 13]. 2 An example of an organisational solution might be establishment of a “control zone” around susceptible devices, relying on distance to attenuate signals below levels that can be received outside the control zone. 2 T able I P A R A M E T E R S O F U S E F U L S I G NA L S O F P R I N T E R A I N R E L A T I O N T O P R I N T I N G PA R A M E T E R S . Parameters of Useful Signal Operating Mode Frequency ( kHz ) Amplitude ( V ) 300 dpi, Eco ∼ 4 . 7 3.5 300 dpi, Best ∼ 4 . 7 3.5 600 dpi, Eco ∼ 4 . 7 3.5 600 dpi, Best ∼ 4 . 7 3.5 1200 dpi, Eco ∼ 9 . 4 3.5 1200 dpi, Best ∼ 9 . 4 3.5 electromagnetic interference emitted from the device and the susceptibility of the device to electromagnetic disturbance— is the use of dif ferential-mode signals. In this paper , analysis of useful signals and control signals [11] in the operation of LED arrays used in printers sho ws that such a design was used by printer B in the operation of its photoconductor ex- posure system. Is this sufficient, howe ver , to foil non-in vasi ve information gathering? Research and results are presented in this article. The clear answer is that the solution adopted in the design of the B printer (Figure 9b) significantly reduces the susceptibil- ity of the device to infiltration, in comparison to the A printer (Figure 9a). Moreov er , the level of electromagnetic emission of printer A is higher than that of typical single or dual diode laser printers [12]. I I . T H E S T R U C T U R E O F T H E E M I S S I O N S O U R C E A N D T H E C H A R A C T E R I S T I C S O F U S E F U L S I G NA L S The analyses were carried out on two printers using LED array technology . Different ways of controlling the LED array—chosen by the printer’ s designer—affect the number of useful signals (Figure 2) and the structure of those signals. In the case of printer A we can distinguish four useful signals and six control signals. The next ten wires are ground wires. Printer B has eight useful signals (four differential pairs). The other signals are control wires and ground wires (32 in all). By probing signal wires while exercising the printer, we were able to learn the structure of the control signals, how the LED array is controlled, and the way in which dif ferent print quality options are achieved depending on the operating mode and the “toner sa ve” option. Each of the tested printers uses different methods of controlling the LED array , which can affect the level of electromagnetic emanations. Examples of wa veforms of useful and control signals for printer A are shown in the oscilloscope traces of Figures 3 – 5. The structures of useful signals, based on the example of the signal on pin 2, does not change for the 300 dpi and 600 dpi operating modes of the printer . In the case of the 1200 dpi mode, the frequency of signal repetition increases by two. The amplitude is constant at approximately 3 . 5 V (T able I). The structure of the signal (wav eform shape and duty cycle) doesn’t change. This proves that the lev el of risk of electro- magnetic emanations correlated with the processed (printed) information is not affected by printing quality (resolution and toner sa ve option), in contrast to the situation found with single and dual diode laser printers [6]. (a) Printer A (b) Printer B Figure 9. T wo printers, A and B , were tested for sensitive emissions. For these printers, changes of operating mode print quality options do have an effect on the structure of useful signals and thus the character of the source of sensitiv e RF emissions [13], [14]. Information about the operating mode and print quality for printer A is encoded in the structure of the control signals (Figures 6–10). The amplitude of these signals is approximately 4– 5 V . The pulse repetition frequency also changes depending on operating mode and the toner sav e option. But at the same time, these signals carry no information about the information being printed [15], [16]. Moreov er , the amplitude of the control signals is higher than that of the useful signals. That could mean that control signals could be considered as a serendipitous source of masking emissions which disturb the reception of sensitiv e emanations. This phenomenon is advantageous from an electromagnetic protection point of view [17]–[19]. A completely different method of control of the LED array was implemented in printer B despite using the same xerographic technology of photosensiti ve drum. Here, some information about modes of operation and toner save option is visible in the useful signal. The amplitude of this signal is approximately 250 mV . The amplitude is less than a tenth of similar signals in printer A . Moreov er , the signalling method is differential. Figures 11 – 14 show example wav eforms of useful signals. For these signals, the pulse repetition frequency changes when printing mode of operation and printout quality are changed (T able II). The structure of these signals (duty cycle) does not change. By analysis of the parameters of useful signals we can deriv e an important property crucial to reconstructing images from intercepted RF signals that contain printed data. In the case of printer B , a change of printing quality (from Eco to Best and vice versa ), for a fixed printing mode, causes predictable changes of the pulse repetition rate of the useful signal. For printer A , changes to these parameters (printing mode and printing quality) are not reflected in the behaviour of the useful signal. 3 (a) (b) Figure 2. Ribbon cable supplying useful signals to the LED array: (a) Printer A , (b) Printer B . (a) (b) Figure 3. W av eforms of useful signals on pins 2 (lo wer trace) and 5 (upper trace) of printer A for: a) the 300 dpi mode and the Best option, b) the 300 dpi mode and the Eco option. T able II P A R A M E T E R S O F U S E F U L S I G NA L S F R O M P R I N T E R B I N R E L AT I O N T O P R I N T I N G PA R A M E T E R S . Operating PRF of differ - First Dif ferential Second Differential Mode (dpi, ential Signals Pair [1, 3, 5, 7] Pair [2, 4, 6, 8] quality) ( kHz ) ( mV ) ( mV ) 600, Eco 2.07 − 250 +250 600, Best 4.14 − 250 +250 1200, Eco 4.14 − 250 +250 1200, Best 8.28 − 250 +250 I I I . R E C O N S T R U C T E D I M AG E S F RO M S E N S I T I V E E M I S S I O N S Images of printed data were recreated from recorded (RF) useful signals transmitted in the wires which supply signals to the LED array . The test signal bandwidth was determined according to the equation: B = W · L · ( dpi ) 2 t where: B is the signal bandwidth for printing one pixel, W is the width of the printing area in inches, L is the length of the printing area in inches, dpi is the printing resolution in dots per inch, and t is the time to print one page. W e have to know the printing parameters to reconstruct the original information. These parameters are: the length of printer video line (in pixels), and the number of video lines on a sheet of paper . As we can see, full reconstructed images can hav e very large dimensions; for example, for: • a resolution of 1200 × 1200 dpi, • printing speed of 30 pages per minute, 4 (a) (b) Figure 4. W av eforms of useful signals on pins 2 (lo wer trace) and 3 (upper trace) of printer A for: a) the 600 dpi mode and the Best option, b) the 600 dpi mode and the Eco option. (a) (b) Figure 5. W aveforms of useful signals on pins 2 (lower trace) and 3 (upper trace) of printer A for: a) the 1200 dpi mode and the Best option, b) the 1200 dpi mode and the Eco option. • paper size of A4 (about 8.27 by 11.69 inches, that is 9924 × 14 028 pixels), and • three samples per pixel collected, we obtain a data size about 450 MB . Therefore, further ana- lyses are based on fragments of images [20], [21]. Fragments of these images are presented in Figures 15 and 16. The reconstructed glyphs contained in the image are constructed from horizontal lines at interv als equal to the width of the line [8] apart from repetition frequency of the useful signal and option Best or Eco and for the default printing resolution of printer B . In two-diode laser printers, a phenomenon occurs that causes the reconstructed images from sensitive emissions to contain only single points, corresponding to the beginning and endpoint of each horizontal line comprising the printed glyphs (essentially run-length encoding the reconstructed images) [22]. Howe ver , these useful signals were not differential signals. In the case of printer B , despite the predictable structure of character glyphs, the differential signalling used tends to help protect printed data against electromagnetic infiltration [23]. I V . L E V E L S O F E L E C T RO M AG N E T I C E M I S S I O N S Printer B uses differential transmission of useful signals. Its primary aim is probably to lower the lev els of electro- magnetic emission and increase resistance to external disturb- ances. Since the useful differential signal is responsible for the transfer of information from the printer’ s raster image processor (RIP) to the LED array , its characteristics correspond to characteristics of the processed information. Therefore, the solution adopted by the printer’ s designer (in the form of a differential signal) also reduces the levels of electromagnetic 5 Figure 6. W av eforms of control signals on pins 6 (lower trace) and 9 (upper trace) of printer A for the 300 dpi mode and the Best option. Figure 7. W av eforms of control signals on pins 6 (lower trace) and 9 (upper trace) of printer A for the 300 dpi mode and the Eco option. emission correlated with printed data [24]. Such a solution was not used in printer A , despite the fact that the amplitude of useful signals are over ten times higher than in the case of printer B . This necessarily translates into a level of elec- tromagnetic emission. The number of wires carrying useful signals is half that of printer B . An anechoic chamber (Figure 17) was used to test the valid- ity of the assumptions. During the tests, sensitiv e emissions were measured with a bandwidth of 1 MHz in the frequency range from 2 MHz to 1 GHz . This frequency range was selec- ted as a result of many years of experience in testing of laser printers and display screens. The aforementioned bandwidth value is the most effecti ve for sensitive emissions from laser printers. During the tests, a TEMPEST DSI 1550A receiving system ( 20 Hz – 22 GHz ), which can be seen in Figure 18, was used. The tested printers were connected to the TEMPEST computer , which is certified for electromagnetic safety . The reason for using the TEMPEST computer for this purpose is because a typical computer has higher lev els of Figure 8. W av eforms of control signals on pins 6 (lower trace) and 9 (upper trace) of printer A in 1200 dpi mode with the Best option. Figure 10. W av eforms of control signals on pins 6 (lower trace) and 9 (upper trace) of printer A for the 1200 dpi mode and the Eco option. electromagnetic emissions. These emissions can “cover” the target emissions. When that happens, the electromagnetic infiltration process becomes impossible. Results of the TEM- PEST measurements are shown in Figure 19. V . S E N S I T I V E E M I S S I O N S A. Printer A The useful signals are sent by four wires. The parameters of the signals are constant regardless of the printing mode and toner save option. The only change relates to the frequency of repetition of the useful signals for the 1200 dpi mode, which is twice as high as for the two lower modes (300 dpi and 600 dpi). The reconstructed images, re gardless of the operating mode of the printer , are visually similar, precluding identification of the operating mode of the printer (Figures 20– 21). At the same time, the operating mode does not change the radiated characteristic of the emission source or the le vel of susceptibility to infiltration. In this printer , information about printout quality is sent by additional control wires. In this 6 Figure 11. W av eforms of useful signals (one of the differential pairs) of printer B for the 1200 dpi mode and the Best option. Figure 12. W av eforms of useful signals (one of the differential pairs) of printer B for the 1200 dpi mode and the Eco option. case, different printing modes generate control signals having different timing structures. As we can see, the xerographic technology of a photo- sensitiv e drum illuminated by LED arrays, which is used in computer printers, has significant characteristics from the point of view of electromagnetic protection of the processed data. The reconstructed data do not directly contain characteristics that would facilitate their identification, as is the case with con ventional laser printers for the same printing modes [25]. Even the use of digital image processing—such as extension of pixel amplitude histogram, pixel amplitude thresholding, logical filtering, or edge detection filtering—doesn’ t yield satisfactory results [8], [26], [27]. B. Printer B Printer B uses a similar xerographic exposure process comprising a photosensiti ve drum as printer A . Ho wev er , in the structure of the original image, we can distinguish horizontal gaps spaced at the same interval as one line—this is the Eco Figure 13. W av eforms of useful signals (one of the differential pairs) of printer B for the 600 dpi mode and the Best option. Figure 14. W av eforms of useful signals (one of the differential pairs) of printer B for the 600 dpi mode and the Eco option. option in action—which has a positiv e ef fect on the lev el of loss of distincti ve features of the original signal after passing through the side channel attack (SCA). This printer uses differential signalling, which feeds into the SCA a much lo wer amplitude original signal that is also missing some signal features that would facilitate electromagnetic eavesdropping. In order to pro ve the conclusions above, sensitiv e emission signals were recorded, and then images reconstructed from them. Undoubtedly the image contains some glyphs [28]. Howe ver , due to the elimination of a number of distinctiv e features caused by differential transmission and reduction of repetition frequency of the signal (Eco option), these elements prev ent reading any information related to the printed data (Figure 22). V I . C O N C L U S I O N This article presents the results of tests of useful and control signals to the LED array for the A and B printers. The 7 (a) (b) Figure 15. Examples of images reconstructed from useful signals (printer A ) for (a) 300 dpi with toner save, (b) 600 dpi without toner sav e, and (c) 1200 dpi with toner sav e. tests were carried out from an electromagnetic-protection-of- information point of view . The dependency of the structures of signals on the printing mode and toner sav e option was shown. In general, use of LED array technology in printers increases the level of electromagnetic protection of information (as compared to laser printers). The lev el of protection from RF electromagnetic ea vesdropping is greater than for printers employing a dual diode laser system [29] and it does not require changes of construction in the printers. Printers using the dual diode laser system use serial signal transmission. That solution is advantageous to the electromag- netic eav esdropper (Figure 23). T able III C O M PAR I S O N O F T H E Q U A L I T Y O F R E C O N S T RU C T E D DAT A — D E P E N D I N G O N R E S O L U T I O N ( D P I ) A N D T H E U S E O F “ B E S T ” O R “ E C O ” O P T I O N S — F O R L A S E R P R I N T E R S T H AT U S E A D UA L D I O D E L A S E R S Y S T E M O R A N L E D A R R A Y F R O M A N E L E C T R O M A G N E T I C P R OT E C T I O N P O I N T O F V I E W . Le gend: K1 O N LY T H E E D G E S OF G LY P H S A P P E A R I N T H E RE C O N S T RU C T E D I M A G E , B U T T H E I N F O R M A T I O N I S L E G I B L E ; K2 V I S I B L E FI L L E D G LY P H S A P P E A R I N T H E R E C O N S T R U C T E D I M - AG E , B U T T H E I N F O R M A T I O N I S N O T L E G I B L E ; W1 V I S I B L E FI L L E D G L Y P H S A P P E A R I N T H E R E C O N S T RU C T E D I M - AG E , A N D T H E I N F O R M A T I O N I S L E G I B L E ; W2 G LYP H S I N T H E R E C O N S T RU C T E D I M AG E A R E N OT V I S I B L E , A N D T H E I N F O R M A T I O N I S N OT L E G I B L E . 600 dpi 1200 dpi T ype of Printer ‘Best’ ‘Eco’ ‘Best’ ‘Eco’ Dual diode printer * W1 K1 W1 K1 Dual diode printer † W1 W1 K1 W1 Dual diode printer ‡ W1 W1 W1 W1 LED array printer A K2 K2 K2 K2 LED array printer B W2 W2 W2 W2 * Producer 1 † Producer 2 ‡ Producer 3 The LED array system requires parallel signal transmission. This causes successful reception and decoding of sensitiv e emissions to be v ery dif ficult. The reconstructed images from valuable emissions obtained from LED-array-based printers can be seen to contain glyphs, but they aren’t le gible. Printer B goes further by using differential signalling. This method, once adopted, significantly reduces the le vel of useful electromagnetic emission (from the perspective of an eav esdropper) and thus reduces the effecti veness of receiving emission sources. The reconstructed images cannot be read by humans. Therefore the resistance lev el of printer B to electromagnetic eav esdropping is much higher than printer A —and that of typical laser printers (with dual diode laser system). On the basis of recorded signals and reconstructed images we may draw the conclusion that the method works. Howe ver , the low quality of the recreated data stands in the way of easy and simple interpretation. The collected information related to printout quality and its impact on the forms of recreated data are presented in T able III. The results obtained by analysis of the A and B printers were compared with results of analogous analyses of printers using a dual diode laser system. In summary , the best approach to increase resistance to electromagnetic infiltration is the LED array system. R E F E R E N C E S [1] P . Wright, Spycatcher: The Candid Autobiography of a Senior Intelli- gence Officer . New Y ork: V iking Press, 1987. [2] D. Kahn, The Codebr eakers . Ne w Y ork: Scribner, 1996. [3] M. G. Kuhn, “Optical time-domain eavesdropping risks of CR T dis- plays, ” in Proceedings of the 2002 IEEE Symposium on Security and Privacy . Berkeley , California: IEEE Computer Society , 12–15 May 2002, pp. 3–18. [4] I. Kubiak, “V ideo signal lev el (colour intensity) and effectiv eness of electromagnetic infiltration, ” Bulletin of the P olish Academy of Sciences , vol. 64, no. 1, pp. 207–218, 2016. [5] S. Ketenci, T . Kayikc , io ˇ glu, and A. Gangal, “Recognition of sign language numbers via electromyography signals, ” in Signal Pr ocessing and Communications Applications Conference (SIU) , Malatya, Turk ey , 16–19 May 2015, pp. 2593–2596. 8 (a) (b) (c) (d) Figure 16. Examples of images recreated from useful signals (printer B ) for (a) 600 dpi without toner save, (b) 600 dpi with toner save, 1200 dpi without toner sav e, and (d) 1200 dpi with toner save. [6] I. Kubiak and A. Przybysz, “Laser printers and effecti veness of attack type TEMPEST, ” Military Univ ersity of T echnology , W arsaw , Poland, T ech. Rep., 2016. [7] S. Maneki, “Learning from the enemy: the GUNMAN project, ” United States Cryptologic History Series VI , vol. 13, 8th January 2007. [8] I. Kubiak and A. Przybysz, “Electromagnetic protection of information and communication technology systems and networks, ” T elecommunic- ation r eview and T elecommunication News , vol. 12, pp. 371–374, 2006. [9] W . W asfy and H. Zheng, “Dual image processing algorithms and parameter optimization, ” in Seventh International Confer ence on Natural Computation (ICNC) , vol. 2, Shanghai, China, 2011, pp. 946–950. [10] A. Goel and N. Chandra, “ A technique for image encryption with 9 Figure 17. Anechoic chamber where the tests were carried out. Figure 18. TEMPEST T est System model DSI 1550A. combination of pixel rearrangement scheme based on sorting group-wise of RGB values and explosi ve inter-pixel displacement, ” International Journal of Image, Graphics and Signal Processing , vol. 4, no. 2, pp. 16–22, 2012. [11] I. Kubiak, “LED printers and safe fonts as an effecti ve protection against the formation of unwanted emission, ” T urkish Journal of Electrical Engineering and Computer Sciences , vol. 25, no. 5, pp. 4268–4279, 2017. [12] ——, “Digital (DVI) and analog (VGA) graphic standard in electro- magnetic protection of text information, ” T elecommunication r eview and T elecommunication News , vol. 6, pp. 413–416, 2014. [13] K. Grzesiak and A. Przybysz, “Software raster generator, ” T elecommu- nication Review and T elecommunication News , vol. 11, pp. 1596–1600, 2011. [14] I. Kubiak and A. Przybysz, “The impact of commercial equipment design to electromagnetic protection of data process, ” Przeglad Elektro- techniczny , vol. 11, pp. 41–44, 2015. [15] I. Kubiak, “The unwanted emission signals in the context of the reconstruct possibility of data graphics, ” International Journal of Image, Graphics and Signal Processing , vol. 6, no. 11, pp. 1–9, October 2014. [16] M. G. Kuhn, “Electromagnetic eavesdropping risks of flat-panel dis- plays, ” in 4th W orkshop on Privacy Enhancing T echnologies, LNCS 3424 . T oronto, Canada: Springer-V erlag, 26–28 May 2004, pp. 88– 105. [17] C. Ulas , , U. As , ık, and C. Karadeniz, “ Analysis and reconstruction of laser printer information leakages in the media of electromagnetic radiation, power , and signal lines, ” Computers & Security , vol. 58, pp. 250–267, May 2016. [18] M. Guerrieri, G. Parla, and C. Celauro, “Digital image analysis technique for measuring railway track defects and ballast gradation, ” Measurement , vol. 113, pp. 137–147, January 2018. [19] J. Loughry and D. A. Umphress, “Information leakage from optical emanations, ” ACM T ransactions on Information and System Security , vol. 5, no. 3, pp. 262–289, 2002. [20] K. Grzesiak and A. Przybysz, “Emission security of laser printers, ” in Military Communications and Information Systems Conference . Wro- claw , Poland: Concepts and Implementations for Innov ativ e Military Communications and Information T echnologies, Publisher House of Military University of T echnology , 27–28 September 2010, pp. 353– 363. [21] I. Kubiak, “Null pointer computer font—electromagnetic safe or not?” T elecommunication revie w and T elecommunication news , vol. 1, pp. 11– 18, January 2015. [22] ——, “Computer font resistant to electromagnetic infiltration process, ” Prze glad Elektr otechniczny , vol. 90, no. 6, pp. 207–215, 2014. [23] S. Ketenci and A. Gangal, “ Automatic reduction of periodic noise in images using adaptive Gaussian star filter, ” T urkish Journal of Electrical Engineering & Computer Sciences , vol. 25, no. 3, pp. 2336–2348, 2016. [24] T .-L. Song, Y .-R. Jeong, and J.-G. Y ook, “Modeling of leaked digital video signal and information recovery rate as a function of SNR, ” IEEE T ransactions on Electroma gnetic Compatibility , vol. 57, no. 2, pp. 164– 172, April 2015. [25] I. Kubiak and S. Musial, “Hardware raster generator as a tool that supports electromagnetic infiltration, ” T elecommunication Review and T elecommunication News , vol. 11, pp. 1601–1607, 2011. 10 Figure 19. Radiated disturbances measured from the A and B printers, both operating in 600 dpi mode (with Eco option); bandwidth = 1 MHz . (a) (b) (c) (d) Figure 20. Fragments of reconstructed images from sensitive emissions of printer A : (a) 300 dpi mode without toner save, (b) 300 dpi mode with toner save, (c) 600 dpi mode without toner sav e, and (d) 600 dpi mode with toner sav e. Measured frequency of sensitive emission: f 0 = 525 MHz , BW = 5 MHz . Image is in verted. [26] I. Kubiak and A. Przybysz, “Printing technology and electromagnetic protection of information, ” Przeglad Elektr otechniczny , vol. 1, pp. 177– 181, 2016. [27] I. Kubiak, “Methods of analysis and digital processing of images in electromagnetic infiltration process, ” Military Univ ersity of T echnology , W arsaw , Poland, T ech. Rep., 2013. [28] B. Jalilian and A. Chalechale, “Persian sign language recognition using radial distance and fourier transform, ” International Journal of Image, Graphics and Signal Processing , vol. 6, no. 1, pp. 40–46, 2014. [29] I. Kubiak, “The influence of the structure of useful signal on the efficacy of sensitive emission of laser printers, ” Measurement , vol. 119, pp. 63– 76, April 2018. Build 408 11 (a) (b) Figure 21. Fragments of reconstructed images from sensitiv e emissions of printer A : (a) 1200 dpi mode without toner sav e, (b) 1200 dpi mode with toner sav e, measured frequency of sensitive emission: f 0 = 525 MHz , BW = 5 MHz . Image is inv erted. Figure 22. Printer B with LED array , 600 × 600 dpi with toner sav e (image is in verted). Measured frequency of sensitive emission f 0 = 384 MHz , BW = 2 MHz . Figure 23. Example of reconstructed image from sensitiv e emission for a two- diode laser printer, 660 dpi mode with the “Eco” option turned on. Measured frequency of sensitiv e emission: f 0 = 444 MHz , BW = 5 MHz . Image is in verted.
Original Paper
Loading high-quality paper...
Comments & Academic Discussion
Loading comments...
Leave a Comment