A hybrid automated detection of epileptic seizures in EEG based on wavelet and machine learning techniques
Epilepsy is a neurological condition such that it affects the brain and the nervous system. It is characterized by recurrent seizures, which are physical reactions to sudden, usually brief, excessive electrical discharges in a group of brain cells. H…
Authors: Asmaa Hamad, Aboul Ella Hassanien, Aly A. Fahmy
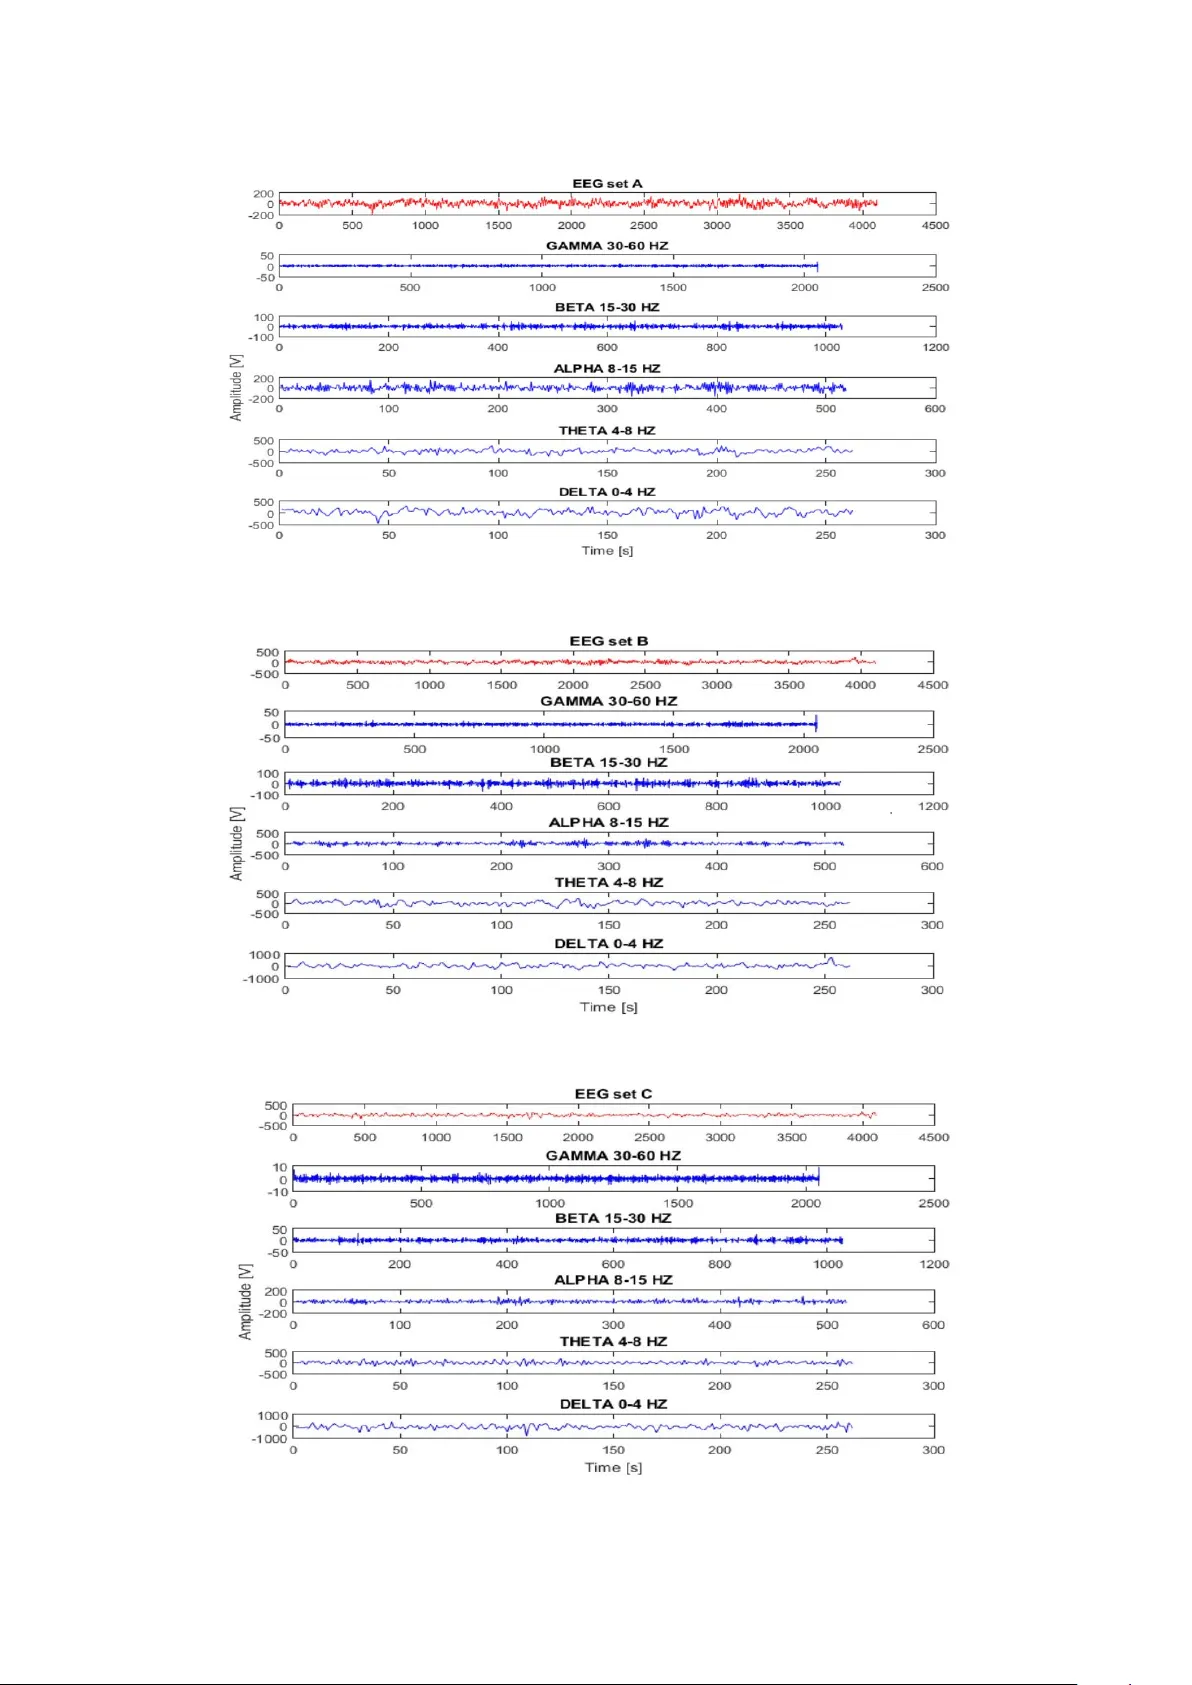
A h ybrid automated detection of epileptic seizures in EEG based on w a v elet and mac hine learning tec hniques Asmaa Hamad a,c , Ab oul Ella Hassanien b,c , Aly A. F ahm y b , Essam H. Houssein a a F aculty of Computers and Information, Minia University, Egypt b F aculty of Computers and Information, Cair o University, Egypt c Scientific R ese ar ch Gr oup in Egypt (SR GE) http://www.e gyptscienc e.net Abstract Epilepsy is a neurological condition suc h that it affects the brain and the nerv ous system. It is c haracterized b y recurrent seizures, whic h are ph ysical reactions to sudden, usually brief, excessiv e electrical discharges in a group of brain cells. Hence, seizure iden tification has great importance in clinical therapy of epileptic patien ts. Electro encephalogram (EEG) is one of the main biomarker that can measure voltage fluctuations of the brain and EEG data analysis helps to inv estigate the patient with epilepsy syndrome as epilepsy leav es their signature in EEG signals. In this pap er, the Discrete W a velet T ransform (D WT) is applied to EEG signals to pre-pro cessing, decomp ose it till the 4th level of decomp osition tree.V arious features like En trop y , Min, Max, Mean, Median, Standard deviation, V ariance, Sk ewness, Energy and Relativ e W av e Energy (R WE) were computed in terms of detailed co efficients and the approximation co efficients of the last decomp osition level.Then, the extracted features are ev aluated by three modern mac hine-learning classifiers suc h as Radial Basis F unction based Supp ort V ector Machine (SVMRBF), k-Nearest Neigh b or (KNN) and Naiv e Ba yes (NB). The exp erimental results demonstrate that the highest classification accuracy (100%) for normal sub ject data versus epileptic data is obtained b y SVMRBF. the corresp onding accuracy betw een normal sub ject data and epileptic data using KNN and NB is obtained as 99.50% and 99% for the ey es op en and eyes closed conditions, respectively . The similar accuracies, while comparing the interictal and ictal data, are obtained as 99%, 97.50% and 98.50% using the SVMRBF, KNN and NB classifiers, resp ectiv ely . These accuracies are quite higher than earlier results published. Keywor ds: Electro encephalogram (EEG), Epilepsy, Discrete w av elet transform (D WT), Relative W av e Energy (R WE), Radial Basis F unction based Supp ort V ector Mac hine (SVMRBF), Supp ort vector machines(SVM), k-Nearest Neigh b or (KNN), Naive Bay es(NB). 1. In tro duction Epilepsy is the second most widespread neurological condition after Alzheimer’s disease and stroke visible in primary practice worldwide with an appro ximate prev a- lence of 5.8 p er 1000 p opulation in the adv anced world and b et ween 10.3 per 1000 to 15.4 per 1000 in dev elop- ing countries [1]. P eople with epilepsy are tw o or three times more likely to die prematurely when compared to a normal p erson. Therefore, diagnosing and predicting epileptic seizures precisely appear to b e particularly im- p ortan t, which is able to fetc h more effective preven tion and treatment for the patients. Clinically to predict and diagnose epileptic seizures, the brain activities are to b e observ ed through EEG signals which con tain the markers of epilepsy . Electro encephalography (EEG) is the record- ing of the electrical activity of the brain, regularly taken through several electro des at the scalp. EEG contains lots of worth y information relating to the numerous ph ysiolog- ical states of the brain and th us is a very useful tool for understanding the brain disease, suc h as epilepsy [2]. EEG signals of epileptic patients exhibit t wo states of abnor- mal activities namely interictal or seizure free (in-b etw een epileptic seizures) and ictal (in the course of an epilep- tic seizure) [3]. The interictal EEG signals are transitory w av eforms and exhibit spik es, sharp or spiky wa v es. The ictal EEG signals are persistent w av eforms with spik es and sharp wa ve complexes. Epilepsy can b e revealed b y con- v entional metho ds b y well-trained and exp erienced neu- roph ysiologists b y visual inspection of long durations of EEG signals, this is time-consuming, tedious and indi- vidual. Hence, in order to ov ercome these limitations, a computer-aided detection (CAD) of epileptic EEG signals can b e utilized. The EEG signals are ordinarily decomp osed into fiv e sub-bands: delta (0-4 Hz), theta (4-8 Hz), alpha (8-12 Hz), b eta (13-30 Hz), and gamma (30-60 Hz) [4, 5]. Al- pha w av es are rh ythmic and its amplitude is lo w. Each region of the brain has the distinguishing marks of alpha rh ythm but mostly it is recorded from the o ccipital and parietal zone. It oscillates from an adult in the aw ak e and relaxed situation with eyes closed. Beta wa ves are irregu- lar and its amplitude is very lo w. It is primarily recorded from temp oral and fron tal lob e. It oscillates from dur- Pr eprint submitte d to Elsevier July 30, 2018 ing the deep sleep, men tal activity and is related with remem b ering. Theta wa v es are rh ythmic and its ampli- tude is lo w-medium. It oscillates from the c hildren in a sleep state, dro wsy adult, and sentimen tal distress o ccip- ital lob e. Delta wa v es are slow and its amplitude is high. It v aries from adult and normal sleep rh ythm. Gamma w av es are the rapid brainw av e frequency with the smallest amplitude [6]. Sev eral algorithms ha ve b een dev elop ed in the litera- ture to improv e the detection and classification of epilep- tic EEG Signals. In [7], the authors prop osed automated epileptic seizure detection based on SVM to classify se g- men ts of normal and epileptic, permutation en tropy (PE) is used as a feature. This work achiev ed a total av eraged accuracy of 85.16%. Also in [8], the authors emplo y ed the w av elet transform and the relative energy as input fea- tures to an Artificial Neural Net work to classify normal and epileptic EEG Signal. A maximum accuracy of 95.2% is ac hieved. In [2], the authors applied genetic program- ming (GP) for automatic feature extraction to improv e b oth of the K-nearest neighbor (KNN) p erformance and the feature dimension reduction to classify healthy sub- jects with ey es op en versus ictal EEG segment and also to classify interictal EEG records with ictal records ver- sus EEG recorded from health y sub jects with eye open, a maximum accuracy of 99.2% w as obtained. In addi- tion, in [9], the authors dev elop ed a sc heme for detecting epileptic seizures from EEG data recorded from epileptic patien ts and normal sub jects. This sc heme is based on D WT analysis and approximate entrop y (ApEn) of EEG signals. SVM and (feed-forw ard backpropagation neural net work) FBNN are used for classification purp ose. This w ork achiev ed a total a veraged accuracy of 95.92%. Moreo ver, in [10], the authors presented a clustering- based least square supp ort v ector machine approach for the classification of EEG signals. Their prop osed approac h comprises the following tw o stages. In the first stage, clustering tec hnique (CT) has b een used to extract rep- resen tative features of EEG data. In the second stage, least square supp ort v ector machine (LS-SVM) is applied to the extracted features to classify EEG signals, a total a veraged accuracy of 94.18% was obtained. Also, in [11], the authors proposed a hierarchical epileptic seizure de- tection approach that classifies healthy sub jects with eyes op en versus ictal segments. In this approach, the original EEG signals p erformed by wa v elet pac ket co efficients and using basis-based wa v elet pack et en tropy metho d to ex- tract feature. In the training stage, hybrid the K-Nearest Neigh b our (KNN) with the cross-v alidation (CV) methods are utilized and achiev ed 99.449% of accuracy . In addi- tion, in [12], the authors presen ted an approac h to clas- sify EEG signals into healthy/in terictal versus ictal EEGs using fuzzy appro ximate en tropy (fApEn). In their ap- proac h, supp ort vector machine (SVM) with RBF is uti- lized for classification purp ose. Their w ork ac hieved a total a veraged accuracy of 98.457%. Also, in [13], the authors com bined a mixture of entrop y measure like Approximate En tropy (ApEn), Sample Entrop y (SampEn) and Phase En tropy and F uzzy Logic Classifier. A total accuracy of 98.1% was achiev ed. F urthermore, in [14], authors pro- p osed entrop y measure Q-based K-NN en tropy b y compute K-NN entrop y at differen t frequency scales of the EEG signa for the classification of seizure, seizure-free and nor- mal EEG signals. A total a verage accuracy of 99.2% was ac hieved. In [15], the authors prop osed an epileptic seizure detec- tion technique from brain EEG signals. The EEG time se- ries are transformed into a w eighted visibilit y graph (WV G). The modularity and a v erage w eigh ted degree are extracted based on WVG. Moreo ver, SVM and KNN are utilized to classify EEG signals into healthy/in terictal versus ictal EEGs with a total av eraged accuracy of 94.94%. Also in [16], the authors presented an automatic epileptic seizure detection metho d, which uses approximately entrop y fea- tures derived from multiw a v elet transform. Artificial neu- ral net work (ANN) is com bined with en tropy to classify health y sub jects with eyes op en versus ictal EEGs and also to classify in terictal EEG records and healthy sub- jects versus ic tal EEGs; a maxim um accuracy of 99.85% w as obtained. In the same manner, in [17], the authors attempted to classify healthy sub jects with eyes op en v er- sus ictal EEG segment and also classify in terictal EEG records versus the ictal records. Their w ork was based on higher order sp ectra and p ow er sp ectral density com- bined with Gaussian classifier. It resulted in 93.11% of p erformance accuracy . Finally , in [18], the authors classi- fied healthy sub jects versus ictal segments using sp ectral en tropy (Sp ecEn). No accuracy was declared, only a T- studen t statistical test has b een conducted. In this paper, eac h EEG signal is decomp osed in to five constituen t EEG sub-bands by DWT. DWT is used for time-frequency analysis giving a quantitativ e ev aluation of numerous frequency bands of clinical brain wa v e. The EEG ep o chs were analyzed in to v arious frequency bands b y using fourth-order Daub ec hies (db4) w av elet function up to 4th-level of the decomp osition. The statistical pa- rameter lik e entrop y , min, max, mean, median, standard deviation, v ariance, Skewness, energy and Relativ e W a ve Energy (R WE) were computed for feature extraction and classification exp eriments are p erformed on differen t EEG dataset by using three most popular mac hine learning clas- sifiers named as, SVMRBF, KNN and NB. The exp erimen- tal results are quite promising with 100% accuracy in the classification of EEG signals of epileptic seizure activity set (E) and healthy person (A and B). Moreov er, the re- sults for other classification test cases also suggest that our prop osed technique is b est appropriate to differentiate b et ween different kinds of EEG signals. The remainder this paper is organized as follows: Sec- tion 2 will introduce the materials and metho ds. In Sec- tion 3 The prop osed classification mo del for EEG includ- ing pre-pro cessing of EEG, metho d for extracting features from EEG signals and classification are describ ed. In Sec- tion 4 exp erimen tal results and discussions are in tro duced. 2 Finally , in Section 5 the conclusion and future work are presen ted. 2. Materials and Metho ds This section introduces the material and metho ds used in this pap er. 2.1. Description of EEG Dataset The data utilized in this pap er w as tak en from publicly a v ailable data at the Departmen t of Epileptology , Univ er- sit y of Bonn ([19]). This dataset includes fiv e sets (denoted as A, B, C, D and E), each including 100 single-c hannel EEG segments of 23.6 sec duration, with a sampling rate of 173.6 Hz. Where, each data segmen t con tains N=4097 data p oints accum ulated at in terv als of 1/173.61th of 1s.These segmen ts w ere c hosen and cut out from con tinuous m ul- tic hannel EEG recordings after a visual inv estigation for artifacts, e.g., due to muscle activity or eye mo vemen ts. The data sets A and B comprised from segments tak en from surface EEG recordings that w ere carried out on fiv e healthy v olunteers using a unified electro de placement sc heme. The v olunteers were relaxed in an aw ak e state with ey es open (A) and eyes closed (B), resp ectively . The data sets C, D, and E are recorded from the epileptic sub- jects through in tracranial electro des for interictal and ic- tal epileptic activities. All of the sub jects had ac hieved complete seizure control after resection of one of the hip- p o campal formations, whic h was therefore accurately di- agnosed to b e the epileptogenic zone. Segments in set D were recorded from the epileptogenic zone and those in set C from the hipp o campal formation of the adverse hemisphere of the brain. While sets C and D comprised only activity estimated during seizure-free interv als, set E only included epileptic seizure activit y . A summary of the datasets is sho wn in T able 1. 2.2. Discr ete Wavelet T r ansforms (DWT) W a velet transforms are widely used in man y fields of engineering to solve many real-life problems. A wa velet is a short wa v e that has intensified energy o ver time to pro- vide a to ol for analyzing transient signals, non-stationary or v ariable phenomena ov er time. If a signal do es not c hange m uch ov er time, we w ould call it a stationary sig- nal. The F ourier transform can be easily applied to sta- tionary signals and can get a goo d result. How ever, many signals suc h as EEG are non-stationary and transien t sig- nals; in suc h situation F ourier transform cannot be applied directly . But time-frequency metho ds can b e used such as D WT [12]. D WT can exp ose signal details in time and frequency domain with precision. This mak es it become a robust tool in biomedical engineering, especially in detecting epileptic seizures. In this thesis, DWT is used to analyze EEG sig- nals in different frequency bands. The D WT decomp oses a sp ecific signal in detail and appro ximation co efficients at the first level. Then the co efficients of approximation are further subdivided in to the next lev el of approximation and detail co efficien ts [20]. In DWT, a wa v elet called the mother wa velet ψ ( t ) is the main controller of signal transformation, and a prop er selection of such wa v elet ψ ( t ) strongly affects results. ψ ( t ) can b e represen ted by Equation 1: ψ ( t ) = 1 √ a ψ ( t − b a ) (1) Where ψ , a and b are indicated as the wa v elet function, scaling and shifting parameters, resp ectiv ely . The wa v elet transforms w as classified into tw o t yp es: Con tinuous w a velet transform (CWT) and Discrete wa v elet transform (D WT). The CWT is defined as follows [21]. C W T ( a, b ) = Z ∞ −∞ x ( t ) 1 p | a | ψ ( t − b a ) dt (2) Where x ( t ) is a signal to be pro cessed. If the scales and shifts parameters are transformed into p ow ers of tw o, called dyadic scales and p ositions then the w av elet analysis will b e extremely more efficien t. Such analysis is obtained from the D WT which is illustrated as the following: D W T ( j, k ) = Z ∞ −∞ x ( t ) 1 p | 2 j | ψ ( t − 2 j k 2 j ) dt (3) Where, a and b are replaced b y 2 j and 2 j k , respectively . F requency of main signal can b e identified using WT co efficien ts, whic h makes it easy to get c haracteristics of signal X ( t ) in b oth time and frequency domains. There are a couple of functions that DWT emplo ys for analysis: the scaling and wa velet functions. Those functions reflect lo w-pass and high-pass filters. Tw o do wn samplers and t wo filters are in volv ed in each step of DWT. High pass filter is devoted to extract details ( D i ) ab out signals (high resolution) b y using the do wn-sampled outputs, while the lo w pass filter finds out approximations ( A i ) ab out signal. 2.3. Supp ort V e ctor Machine (SVM) SVM is a p o werful classifier in the field of biomedical science for the detection of abnormalities from biomedical signals. SVM is an efficien t classifier to classify tw o dif- feren t sets of observ ations into their relev an t class. It is capable to handle high dimensional and non-linear data excellen tly . On the basis of the structure of training data sets, it helps to predict the imp ortant characteristics of unkno wn testing data. As in this pap er, to ev aluate the p erformance of the proposed technique we are having four test cases with tw o differen t sets of class so we preferred this classifier for b etter accuracy results. SVM mec hanism is based up on finding the b est hyperplane that separates the data of tw o different classes of category . The structural design of the SVM dep ends on the following: first, the regularization parameter is used to manage the amount of 3 T able 1 A summary of the clinical data. Settings Set A Set B Set C Set D Set E Sub jects 5 health y 5 health y 5 epileptic patien ts 5 epileptic patien ts 5 epileptic patien ts Electro de t yp e surface surface In tracranial In tracranial In tracranial Electro de placemen t In ternational 10-20 system In ternational 10-20 system Hipp o campal formation Epileptogenic zone Epileptogenic zone P atient’s state Aw ake, eyes op en Aw ake, eyes closed Seizure-free (In terictal) Seizure-free (In terictal) Seizure activit y (Ictal) Num b er of ep o chs 100 100 100 100 100 Ep o c h duration (s) 23.6 23.6 23.6 23.6 23.6 allo wed o verlap b et ween classes. Second, k ernel functions of nonlinear SVMs are used for mapping of training data from an input space to a higher dimensional feature space. All k ernel functions like linear, p olynomial, radial ba- sis function and sigmoid having some free parameters are called hyper parameters. Suitable k ernel function and pa- rameters are required to train SVM classifier and usually obtained by the cross-v alidation technique. In this pa- p er, we hav e used the following kernel functions of SVM Classifier to analyze the performance of differen t test cases problems. Radial basis kernel function with width σ [22]: K ( x, y ) = exp( −|| x − y || 2 / 2 σ 2 ) (4) Where, K(x, y) is termed as the kernel function, which is built up on the dot pro duct of t wo inv ariant x and y . 2.4. K-Ne ar est Neighb or (KNN) K-Nearest Neigh b or (KNN) classifier is simple and ro- bust to even noisy and large training data set. It is also adaptiv e in nature b ecause of using lo cal information for prediction of unknown data. It p erforms the classification task on the basis of frequen t class of its nearest neighbors in the feature space [23]. It works to find a testing sam- ple ' s class by the ma jority class of the k nearest training samples. 2.5. Na ¨ ıve Bayes (NB) Na ¨ ıv e Ba y es is a simple and efficient statistical method, whic h is based on Bay es theorem [24]. NB is a simple tec hnique for constructing classifiers mo dels that assign class lab els to problem instances, represented as vectors of feature v alues, where the class lab els are drawn from some finite set. It assume that the v alue of a particular feature is indep endent of the v alue of an y other feature, given the class v ariable. 2.6. K-fold Cr oss-validation Cross-v alidation is the statistical practice of partition- ing a sample of data into subsets suc h that the analysis is initially p erformed on a single subset, while the other sub- set(s) are retained for subsequent use in confirming and v alidating the initial analysis. The initial subset of data is called the training set; the other subset(s) are called v alidation or testing sets [9]. In K-fold cross-v alidation, the original sample is partitioned into K sub-samples. K- 1 sub-samples are used as training data, and single sub- sample is retained as the v alidation data for testing the mo del. The cross-v alidation pro cess is then rep eated K times, with each of the K sub-samples used exactly once as the v alidation data. The K results from the folds, then, can b e a veraged to pro duce a single estimation. In this study , we ha ve used default 10-fold scheme to achiev e b est p erformance accuracies. 2.7. Performanc e Evaluation Me asur ements In this pap er the set A, B, C and D are considered as p ositiv e class and set E is considered as the negativ e class resp ectiv ely . T o ev aluate the classification performance for differen t test cases in this pap er, w e hav e used the using fiv e measures, namely classification accuracy , sensitivity , sp ecificit y , precession and F Measure, and. The definitions of these measures are as follo ws: Accur acy ( Acc ) = T P + T N T P + F N + T N + F P ∗ 100 (5) S ensitiv ity = T P T P + F N ∗ 100 (6) S pecif icity = T N T N + F P ∗ 100 (7) P r ecision = T P T P + F P ∗ 100 (8) F − M easur e = 2 ∗ P r ecision ∗ S ensitiv ity P r ecision + S ensitiv ity (9) Where, T rue Positiv e (TP) stands for correctly identified non-seizure activity , T rue Negative (TN) is the correctly 4 iden tified seizure activit y , F alse Positiv e (FP) is the false iden tification of non-seizure activity , and F alse Negativ e (FN) is the falsely recognized seizure activit y . 3. The Prop osed Classification Mo del The prop osed classification approac h consists of three phases; namely , 1) pre-pro cessing used to remo ve the noises from the EEG signals, 2) feature extraction used to ex- tract the EEG signal features from decomposed signal, and 3) classification phases in this phase, the Extracted features are given as inputs to the classifier. The classifi- cation phase is mainly used to analyses the EEG signals and it classifies the EEG signal in to normal or abnormal. In the present work, EEG data sets (A, B, C, D and E) are prepro cessed b y DWT to decomp ose into five sub- band signals using four level decomp osition. Next, useful features like En tropy , Min, Max, Mean, Median, Standard deviation, V ariance, Skewness, Energy and Relative W av e Energy (R WE) are derived from eac h sub-band of wa v elet co efficien ts. Finally , Extracted features are applied as in- put to SVMRBF, KNN and NB classifier for epilepsy clas- sification. The block diagram of the prop osed approac h is sho wn in Figure 1. 3.1. EEG Pr e-pr o c essing F or the EEG pre-pro cessing phase, DWT decomp osi- tion has b een used as a pre-process ing level for EEG seg- men ts to extract five physiological EEG bands: delta (0-4 Hz), theta (4-8 Hz), alpha (8-12 Hz), b eta (13-30 Hz), and gamma (30-60 Hz). In the first stage of the DWT, the sig- nal is concurrently passed through an LP and HP filters. The outputs from low and high pass filters are indicated to as approximation (A1) and detailed (D1) coefficients of the first level. The output signals holding half the fre- quency bandwidth of the original signal can b e downsam- pled b y t w o due to the Nyquist rule. The same pro cedure can b e duplicated for the first level appro ximation and the detailed coefficients fetch the second level co efficients. Through each step of this decomp osition pro cess, the fre- quency resolution is m ultiplied through filtering and the time resolution is split through do wn-sampling. Since the sampling frequency of the used EEG dataset is 173.61 Hz as shown in section 2.1, according to the Nyquist sampling theorem, the maxim um useful frequency is half of the sampling frequency or 86.81 Hz. As such, from a physiological standp oin t, frequencies greater than 60 Hz can b e classified as noise and discarded. Conse- quen tly , to correlate the wa v elet decomposition with the frequency ranges of the physiological sub-bands, the wa velet filter used in this application requires the frequency con- ten t to b e limited to the 060 Hz band. Th us we ha ve eliminated the frequencies ab o ve 60 Hz using a lo w-pass Butterw orth filter. The band-limited EEG is then sub- jected to four-level DWT with fourth-order Daub echies (db4) w av elet function. After the first level of decomp o- sition, the EEG signal (0-60 Hz), is decomp osed into its higher resolution components, D1 (30-60 Hz) and lo w er resolution comp onen ts, A1(0-30 Hz). In the second level of decomp osition, the A1 component is further decom- p osed in to higher resolution components, D2 (15-30 Hz) and low er resolution comp onents, A2 (0-15 Hz). F ollo w- ing this pro cess, after four levels of decomp osition, the comp onen ts extracted are A4 (0-4 Hz), D4 (4-8 Hz), D3 (8-15 Hz), D2 (15-30 Hz), and D1 (30-60 Hz) as sho wn in Figure 2. Reconstructions of these fiv e comp onen ts using D WT approximately corresp ond to the five physiological EEG sub-bands delta, theta, alpha, beta, and gamma. Mi- nor differences in the b oundaries betw een the comp onents compared to those b et ween the EEG sub-bands are of little consequence due to the ph ysiologically appro ximate nature of the sub-bands. The entire quantitativ e analysis of the EEG signals was co ded using MA TLAB (R2015a) and the W a velet function. 3.2. F e atur e Extr action Extracting the features consider the b est depict of the b eha vior of EEG signals and are imp ortant for automated seizure detection p erformance. F eature extraction aims to capture the meaningful and distinctive characteristics hidden in EEG signals, which immediately dominates the final classification accuracy . In this pap er, we hav e ex- tracted the following features of wa v elet co efficients from eac h sub-band that were c hosen to classify EEG signals [25, 26]. 1) Maxim um of the wa v elet co efficients in each sub-band. 2) Minim um of the wa v elet co efficients in each sub-band. 3) Mean of the wa v elet co efficients in each sub-band is obtained b y the following Equation: µ i = 1 N N X j =1 D ij i = 1 , 2 , ...l (10) 4) The standard deviation of the w a velet co efficients in eac h sub-band. The square ro ot of the v ariance µ describ es the mean v alue of the signal by the follo wing equation. σ = v u u t 1 N − 1 N X i =1 ( D i − µ ) 2 (11) 5) The v ariance of the wa v elet co efficients in eac h sub-band is the square of the standard deviation. V = σ 2 (12) 6) The median of the wa velet co efficients in eac h sub-band. The median of a statistical distribution D(x) is the v alue x such for a symmetric distribution; it is, therefore, equal to the mean. Giv en the statistical median of the random sample is defined b y: median = D ( N +1 2 ) , i f N is odd 1 2 ( D ( N 2 ) + D ( N 2 + 1)) , i f N is ev en (13) 5 Figure 1: Block diagram of the proposed classification model. Figure 2: F our lev el w av elet decomposition of EEG. 7) Sk ewness of the w av elet co efficients in each sub-band. A measure of the asymmetry of the data distribution. µ and σ describ e the mean and standard deviation of the signal individually b y the following equation: S k ew ness = 1 N N X i =1 ( D i − µ σ ) 4 − 3 (14) 8)Energy in the sub-band The energy p oints out that the strength of the signal as it gives the area under the curv e of pow er at an y in terv al of time. The energy of EEG signal of finite length is giv en by: E ner g y ( E i ) = N X j =1 | D ij | 2 i = 1 , 2 , 3 ...l (15) 9) Relative W av e Energy (R WE) in the sub-band R WE c haracterize the relative energy in each frequency sub-band and is utilize to detect the corresp ondence b etw een seg- men ts of EEG signal. Energy of w av elet co efficients giv es information ab out the strength of signals and is obtained b y the equation: E j = X k | D ik | 2 j = 1 , 2 , 3 ...N (16) Where, j is the decomp osition level and k is the corre- sp onding wa v elet co efficient. Moreov er, total energy of decomp osed lev els of a signal segment is calculated by: E T otal = X j E j j = 1 , 2 , 3 ...N (17) Relativ e wa v e Energy (R WE) is obtained by the equation: ρ j = E j /E T otal j = 1 , 2 , 3 ...N (18) 6 10) Entrop y in the sub-band. En tropy is a n umerical mea- sure of uncertaint y (doubt) of outcome where signal con- tained thousands of bits of information. The mathematical represen tation is: E ntr opy ( E N ) = N X j =1 D 2 ij log( D 2 ij ) i = 1 , 2 , 3 ...l (19) Based on the abov e mentioned, ten features w ere extracted for all categories of signals to create the original feature database at eac h decomposition level starting from D1–D4 and one final approximation, A4. These are extracted to help in distinguishing b etw een normal and epileptic signal. 3.3. Classific ation The classification tec hnique helps to discriminate the unkno wn testing set of observ ations into their appropriate classes on the basis of the training set of known obser- v ations. A classification tec hnique used a mathematical function named as a classifier to predict the right class of unkno wn observ ation of testing data set. In this pap er, we ha ve used three w ell-known sup ervised machine learning classification metho d named as SVMRBF classifier, KNN classifier and NB classifier for the ev aluation of the p erfor- mance of the prop osed technique by utilizing the resulting features extracted from feature extraction tec hnique. 4. Exp erimen tal Results and Discussion 4.1. Exp erimental R esults Extracting original features of Epileptic EEG, are done in tw o steps. In the first step, D WT is applied to de- comp ose the EEG signal into several sub-signals within differen t frequency bands. Selection the num ber of de- comp osition levels and suitable wa velet function are also imp ortan t for EEG signal analysis with D WT. In the cur- ren t paper, the n um b er of decomp osition lev els is chosen 4, whic h is recommended by others w ork [2]. And the w a velet function selected is Daub echies of order 4, which was also pro ven to b e the b est suitable w av elet function for epilep- tic EEG signal analysis [2]. The frequency bands resp ond- ing to 4-level DWT decomp osition with a sampling fre- quency of 173.6 Hz on the EEG signal are sho wn in T able TBL:bands. These Daub echies wa v elet coefficients were computed and analyzed using MA TLAB (R2015a). The fiv e different sub-signals (one approximation A4 and four details D1–D4 that corresp ond to delta (0-4 Hz), gamma (30-60 Hz), beta (13-30 Hz), alpha (8-12 Hz), and theta (4- 8 Hz) resp ectively , of the sample EEG ep o c h taken from data sets A,B,C,D and E are plotted in Figures 3 to 7 resp ectiv ely . The second step, after raw EEG signal, is decomp osed in to five sub-signals, which individually corresp ond to dif- feren t frequency bands describ ed in T able 2. T en clas- sic F eatures explained in Section 3.2 are calculated, using MA TLAB (R2015a), from the approximation and detail co efficien ts of all sub-bands of the en tire 500 EEG ep o c hs of fiv e data sets A–E to form the original feature database. Theses extracted features from each sub-band for the last ep o c h of data sets A, D and E for instance are presented in [27]. T able 2 F requency bands of EEG signal with 4-Level D WT decomposition. lev el Sub-band signal F requency band (Hz) 1 D1(gamma) 30–60 2 D2 (b eta) 15-30 3 D3 (alpha) 8-15 4 D4 (theta) 4-8 4 A4 (delta) 0-4 4.2. Discussion The features of D1–D4 and A4 that are extracted in Section 4 were clas sified using SVMRBF, KNN and NB. These features are used as an input of classifiers to classify the EEGs as health y , interictal and ictal. The prop osed approac h is tested on the four different test cases. The SVMRBF, KNN and NB are implemented by using MA T- LAB (R2015a). The input feature vector is randomly divided into train- ing data set and testing data set based 10-fold cross-v alidation. The training data set is used to train theses classifiers, whereas the testing data set is used to verify the accu- racy and effectiv eness of the trained classifiers for the giv en EEG classification problem. Each row of the input data matrix is one observ ation and its column is one feature. In this work, the feature v ector of data set A has 100 ro ws and 50 columns. Similarly , the feature vector of sets B, C, D and E individually hav e 100 observ ations and 50 features. The data set for the presen t binary classifier task consists of 200 observ ations of 50 features for case 1 to case 4 as sho wn in Figure 3. The training data set consists of 90% of input data and the remaining 10% of input data are used for testing of the classifiers. This pro cess is rep eated 10 times to obtain the a v erage v alues of statistical param- eters which are summarized in T able 4 to 6 of SVMRBF, KNN and NB classifiers resp ectiv ely . 4.3. Comp arison A nalysis There are man y other methods proposed b y different researc hers for the epileptic seizure detection. T able 7 presen ts a comparison of the results b et ween the metho d dev elop ed in this work and other metho ds prop osed in the literature in terms of accuracy . Only metho ds ev aluated on the same dataset for the same cases are included so that a comparison b et ween the results is feasible. 5. Conclusion and F uture W ork The detection of epileptic seizure b eing p erformed by visual scanning of EEG signal is very time-consuming, 7 Figure 3: Approximate and detail coefficients for healthy sub ject (set A). Figure 4: Approximate and detail coefficients for healthy sub ject (set B). Figure 5: Approximate and detail coefficients for epileptic sub ject (set C). 8 Figure 6: Approximate and detail coefficients for epileptic sub ject (set D). Figure 7: Approximate and detail coefficients for epileptic sub ject (set E). T able 3 The classification description of differen t test cases along with their EEG data sets. T est case Cases for seizure Classification description Case 1 Set A vs Set E Health y Persons with eye open vs Epileptic patien ts during seizure activity Case 2 Set B vs Set E Health y Persons with eye close vs Epileptic patien ts during seizure activity Case 3 Set C vs Set E Hippo campal seizure free vs Epileptic patien ts during seizure activity Case 4 Set D vs Set E Epileptic seizure free vs Epileptic patien ts during seizure activity 9 T able 4 The performance for differen t sets of EEG data using SVMRBF. Cases for seizure SVMRBF Accuracy(%) Sensitivit y(%) Sp ecificit y(%) Precision (%) F-Measure(%) Set A vs Set E 100 100 100 100 100 Set B vs Set E 100 100 100 100 100 Set C vs Set E 99 100 98 98.039 99.01 Set D vs Set E 97 98 96 96.078 97.03 T able 5 The performance for differen t sets of EEG data using KNN. Cases for seizure KNN Accuracy(%) Sensitivit y(%) Sp ecificit y(%) Precision (%) F-Measure(%) Set A vs Set E 99.5 99 100 100 99.497 Set B vs Set E 99 98 100 100 98.99 Set C vs Set E 97.5 95 100 100 97.436 Set D vs Set E 96.5 94 99 98.947 96.41 T able 6 The performance for differen t sets of EEG data using NB. Cases for seizure NB Accuracy(%) Sensitivit y(%) Sp ecificit y(%) Precision (%) F-Measure(%) Set A vs Set E 99.5 100 99 99.01 99.502 Set B vs Set E 99 99 99 99 99 Set C vs Set E 98.5 99 98 98.02 98.507 Set D vs Set E 96.5 95 98 97.938 96.447 costly pro cedure and may b e inaccurate, sp ecifically for a long time EEG recording. In this pap er the DWT is used for analysis of EEG to detect epilepsy . EEG signals are de- comp osed into different sub-bands through DWT to obtain the detail w a velet co efficients (D1–D4) and approximate w av elet co efficien ts (A4). The sub-band co ding gives dif- feren t frequency bands which are Gamma (D1: 30-60 Hz), Beta (D2: 15-30 Hz), Alpha (D3: 8-15 Hz), Theta (D4: 4-8 Hz), and Delta (A4: 0-4 Hz). Then, ten features w ere extracted using DWT from eac h sub-band to classify EEG signal. F urthermore, three different classifiers (SVMRBF, KNN and NB) w ere employ ed and their p erformance was ev aluated for distinguishing b etw een normal and epilep- tic. The b est classification accuracies are obtained using SVMRBF for cases 1 and 2 is 100%. Finally , the prop osed metho d is v erified by comparing the performance of classi- fication problems as addressed b y other researc hers. It can b e concluded that using DWT based prop osed features; more satisfactory results are achiev ed to discriminate the EEG signals in comparison to other metho ds. The pro- p osed metho d can b e employ ed as a quantitativ e measure for monitoring the EEG and it may prov e to b e a useful to ol in analyzing the EEG signal asso ciated with epilepsy . As future w ork, the proposed approach can be applied to a more wide range of pattern recognition problems whic h are imp ortan t to h umans, suc h as the Alzheims and Parkin- sons diseases detection and diagnosis. References References [1] C. B. Josephson, S. Sandy , N. Jette, T. T. Sa jobi, D. Mar- shall, S. Wiebe, A systematic review of clinical decision rules for epilepsy , Epilepsy & Behavior 57 (2016) 69–76. [2] L. Guo, D. Rivero, J. Dorado, C. R. Muntean u, A. Pazos, Au- tomatic feature extraction using genetic programming: An ap- plication to epileptic eeg classification, Exp ert Systems with Applications 38 (8) (2011) 10425–10436. [3] U. R. Ac hary a, H. F ujita, V. K. Sudarshan, S. Bhat, J. E. Koh, Application of entropies for automated diagnosis of epilepsy us- ing eeg signals: a review, Kno wledge-Based Systems 88 (2015) 85–96. [4] H. Adeli, S. Ghosh-Dastidar, N. Dadmehr, A wa velet-c haos methodology for analysis of eegs and eeg subbands to detect seizure and epilepsy , IEEE T ransactions on Biomedical Engi- neering 54 (2) (2007) 205–211. [5] D. Ga jic, Z. Djurovic, J. Gligorijevic, S. Di Gennaro, I. Savic- Ga jic, Detection of epileptiform activity in eeg signals based on time-frequency and non-linear analysis, F rontiers in computa- tional neuroscience 9 (2015) 38. [6] M. Kalaiv ani, V. Kalaiv ani, V. A. Devi, Analysis of eeg signal for the detection of brain abnormalities, at International Journal of Computer Applications ® year. [7] N. Nicolaou, J. Georgiou, Detection of epileptic electroen- cephalogram based on p ermutation entrop y and supp ort vec- tor machines, Exp ert Systems with Applications 39 (1) (2012) 202–209. [8] L. Guo, D. Rivero, J. A. Seoane, A. Pazos, Classification of eeg signals using relative wav elet energy and artificial neural netw orks, in: Pro ceedings of the first ACM/SIGEV O Summit on Genetic and Evolutionary Computation, A CM, 2009, pp. 177–184. 10 [9] Y. Kumar, M. Dewal, R. Anand, Epil eptic seizures detection in eeg using dwt-based apen and artificial neural netw ork, Signal, Image and Video Pro cessing 8 (7) (2014) 1323–1334. [10] Y. Li, P . P . W en, et al., Clustering technique-based least square support vector machine for eeg signal classification, Computer methods and programs in biomedicine 104 (3) (2011) 358–372. [11] D. W ang, D. Miao, C. Xie, Best basis-based wa velet pack et entrop y feature extraction and hierarchical eeg classification for epileptic detection, Expert Systems with Applications 38 (11) (2011) 14314–14320. [12] Y. Kumar, M. Dewal, R. Anand, Epileptic seizure detection using dwt based fuzzy approximate entrop y and support vector machine, Neuro computing 133 (2014) 271–279. [13] U. R. Achary a, F. Molinari, S. V. Sree, S. Chattopadh ya y , K.-H. Ng, J. S. Suri, Automated diagnosis of epileptic eeg using en- tropies, Biomedical Signal Pro cessing and Con trol 7 (4) (2012) 401–408. [14] A. Bhattacharyy a, R. B. Pachori, A. Upadhy ay , U. R. Achary a, T unable-q w av elet transform based m ultiscale entrop y measure for automated classification of epileptic eeg signals, Applied Sci- ences 7 (4) (2017) 385. [15] S. Supriy a, S. Siuly , H. W ang, J. Cao, Y. Zhang, W eigh ted visibility graph with complex netw ork features in the detection of epilepsy , IEEE Access 4 (2016) 6554–6566. [16] L. Guo, D. Rivero, A. Pazos, Epileptic seizure detection using multiw a velet transform based appro ximate en tropy and artifi- cial neural net works, Journal of neuroscience metho ds 193 (1) (2010) 156–163. [17] K. C. Ch ua, V. Chandran, R. Achary a, C. M. Lim, Automatic identification of epilepsy by hos and p ow er sp ectrum parame- ters using eeg signals: A comparative study , in: 30th Annual International Conference of the IEEE Engineering in Medicine and Biology So ciety , IEEE, 2008, pp. 3824–3827. [18] A. Mirzaei, A. Ayatollahi, H. V av adi, Statistical analysis of epileptic activities based on histogram and wa velet-spectral en- tropy , Journal of Biomedical Science and Engineering 4 (03) (2011) 207. [19] D. of Epileptology Universit y of Bonn, Eeg time series data. URL http://www.meb.uni- bonn.de/epileptologie/science/ physik/eegdata.htmlAccessedOct2016 [20] O. F aust, U. R. Ac harya, H. Adeli, A. Adeli, W av elet-based eeg pro cessing for computer-aided seizure detection and epilepsy diagnosis, Seizure 26 (2015) 56–64. [21] M. Li, W. Chen, T. Zhang, Classification of epilepsy eeg signals using dwt-based en velope analysis and neural net work ensemble, Biomedical Signal Pro cessing and Con trol 31 (2017) 357–365. [22] A. M. Andrew, An in tro duction to supp ort vector machines and other kernel-based learning metho ds by nello christianini and john shaw e-taylor, cambridge universit y press, cambridge, 2000, xiii+ 189 pp., isbn 0-521-78019-5 (hbk, £ 27.50). (2000). [23] T. Co v er, P . Hart, Nearest neigh b or pattern classification, IEEE transactions on information theory 13 (1) (1967) 21–27. [24] H. W ang, Y. Zhang, et al., Detection of motor imagery eeg signals employing na ¨ ıve bay es based learning pro cess, Measure- ment 86 (2016) 148–158. [25] R. P anda, P . Khobragade, P . Jambh ule, S. Jengthe, P . P al, T. Gandhi, Classification of eeg signal using wa v elet transform and support vector mac hine for epileptic seizure diction, in: Systems in Medicine and Biology (ICSMB), 2010 In ternational Conference on, IEEE, 2010, pp. 405–408. [26] V. Benzy , E. Jasmin, A combined wa velet and neural netw ork based model for classifying depth of anaesthesia, Procedia Com- puter Science 46 (2015) 1610–1617. [27] A. Hamad, E. H. Houssein, A. E. Hassanien, A. A. F ahm y , F ea- ture extraction of epilepsy eeg using discrete wav elet transform, in: Computer Engineering Conference (ICENCO), 2016 12th International, IEEE, 2016, pp. 190–195. T able 7 A comparison of classification accuracy obtained by our metho d and others method for binary EEG classification problem. Cases Ref Metho ds Acc(%) A vs E [2] Genetic programming-based KNN classifier 99.2 [11] W a velet pack et en tropy with KNN 99.449 [10] clustering tec hnique-based least square supp ort v ector machine (CT-LS-SVM) 99.90 [16] Multiw av elet transform based appro ximate entrop y feature with artificial neural net works. 99.85 [7] P ermutation Entrop y with SVM 93.55 Prop osed SVMRBF, KNN and NB 100 99.5 99.5 B vs E [9] D WT based approximate en tropy (ApEn) with Artificial neural net work 92.5 [10] clustering tec hnique-based least square supp ort v ector machine (CT-LS-SVM) 96.30 [15] W eigh ted Visibility Graph with SVM 97.25 [7] P ermutation Entrop y with SVM 82.88 Prop osed SVMRBF, KNN and NB 100 99 99 C vs E [10] clustering tec hnique-based least square supp ort v ector machine (CT-LS-SVM) 96.20 [15] W eigh ted Visibility Graph with SVM 98.25 [7] P ermutation Entrop y with SVM 88.83 Prop osed SVMRBF, KNN and NB 99 97.5 98.5 D vs E [9] D WT based approximate en tropy (ApEn) with Artificial neural net work 95 [12] D WT based fuzzy approximate en tropy and SVM 95.85 [10] clustering tec hnique-based least square supp ort v ector machine (CT-LS-SVM) 93.60 [15] W eigh ted Visibility Graph with SVM 93.25 [7] P ermutation Entrop y with SVM 83.13 Prop osed SVMRBF, KNN and NB 97 96.5 96.5 11
Original Paper
Loading high-quality paper...
Comments & Academic Discussion
Loading comments...
Leave a Comment