Recognising Cardiac Abnormalities in Wearable Device Photoplethysmography (PPG) with Deep Learning
Cardiac abnormalities affecting heart rate and rhythm are commonly observed in both healthy and acutely unwell people. Although many of these are benign, they can sometimes indicate a serious health risk. ECG monitors are typically used to detect the…
Authors: Stewart Whiting, Samuel Morel, Jason Costello
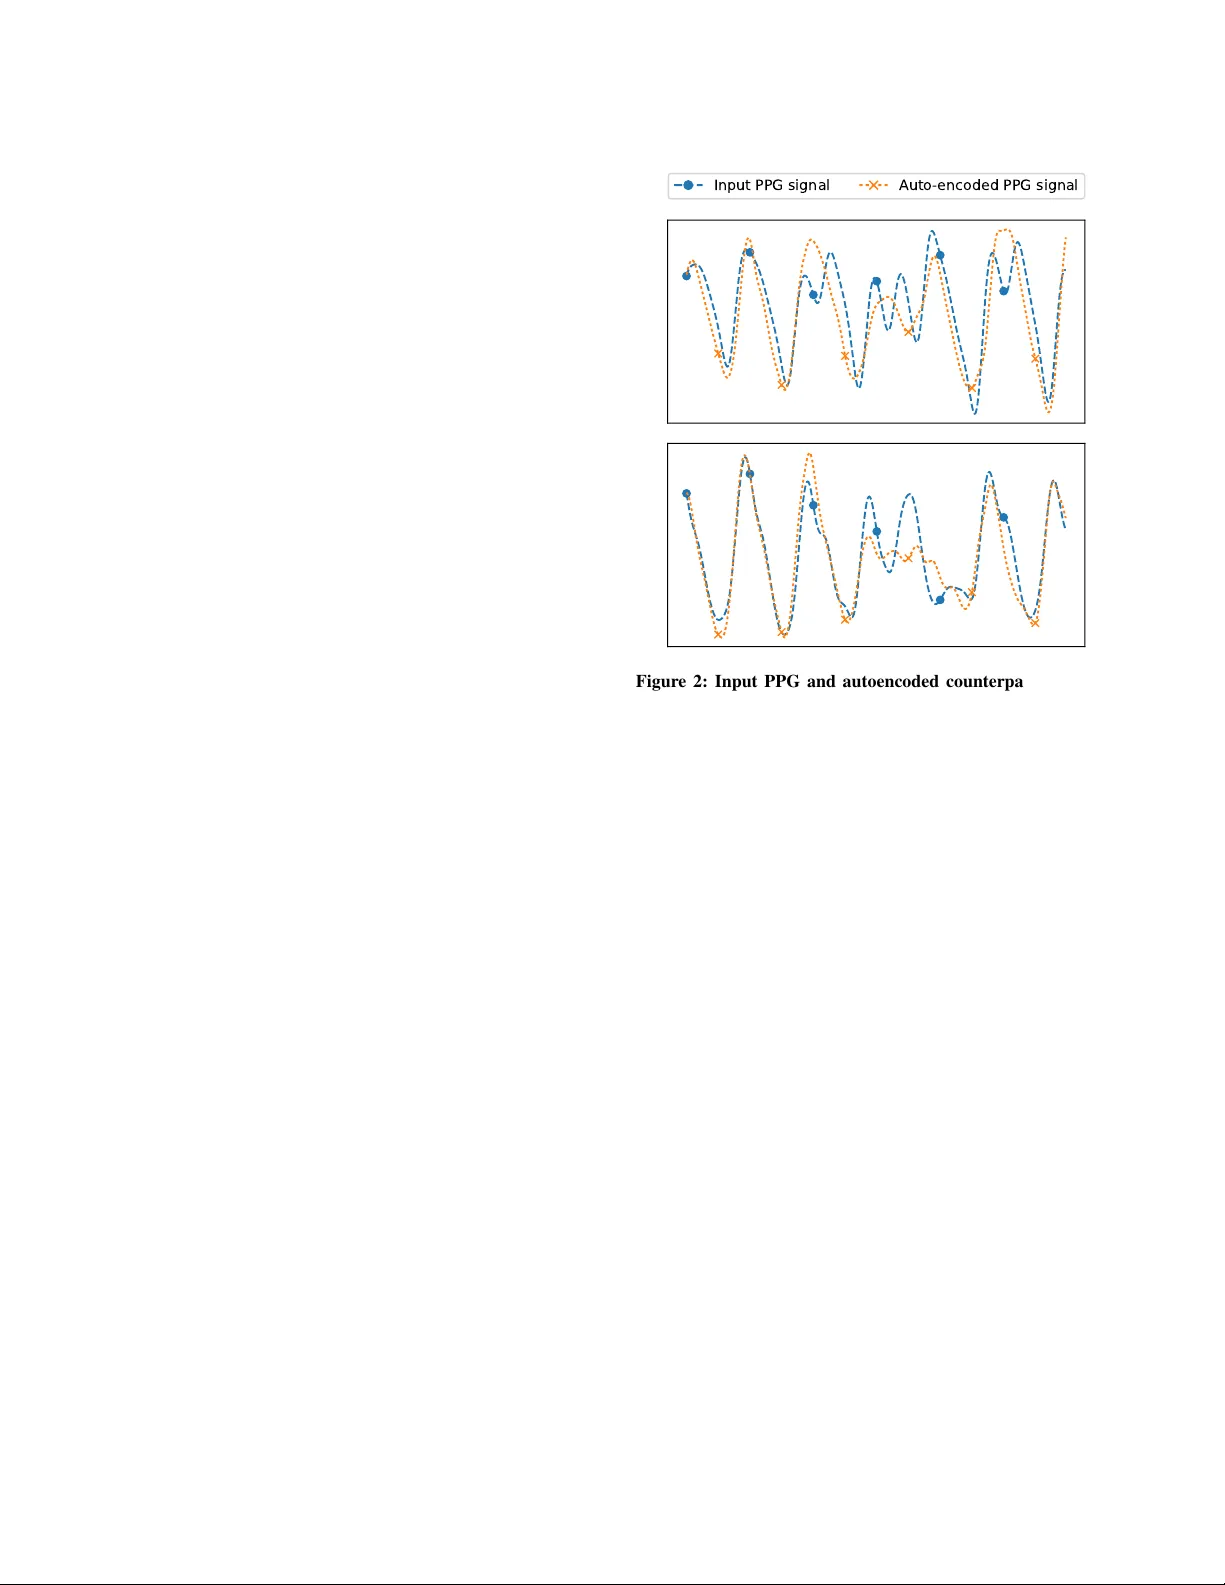
Recognising Car diac Abnormalities in W earab le De vice Photopleth ysmograph y (PPG) with Deep Learning Ste wart Whiting, Samuel Moreland, Jason Costello, Glen Colopy , Christopher McCann snap40, 24 Forth Street, Edinb urgh, Scotland, UK. [stew art, sam, jason, glen, christopher]@snap40.com ABSTRA CT Cardiac abnormalities af fecting heart rate and rhythm are commonly observed in both healthy and acutely unwell people. Although many of these are benign, they can sometimes indicate a serious health risk. ECG monitors are typically used to detect these ev ents in elec- trical heart activity , howev er they are impractical for continuous long-term use. In contrast, current-generation wearables with optical photoplethysmography (PPG) ha ve gained popularity with their lo w- cost, lack of wires and tin y size. Many cardiac abnormalities such as ectopic beats and AF can manifest as both obvious and subtle anomalies in a PPG waveform as the y disrupt blood flow . W e pro- pose an automatic method for recognising these anomalies in PPG signal alone, without the need for ECG. W e train an LSTM deep neural network on 400,000 clean PPG samples to learn typical PPG morphology and rhythm, and flag PPG signal diver ging from this as cardiac abnormalities. W e compare the cardiac abnormalities our approach recognises with the ectopic beats recorded by a bedside ECG monitor for 29 patients ov er 47.6 hours of gold standard ob- servations. Our proposed cardiac abnormality recognition approach recognises 60%+ of ECG-detected PVCs in PPG signal, with a false positiv e rate of 23% – demonstrating the compelling power and value of this nov el approach. Finally we e xamine how cardiac abnor- malities manifest in PPG signal for in- and out-of-hospital patient populations using a wearable device during standard care. 1 INTR ODUCTION Many cardiac abnormalities af fecting heart rate and rhythm are ob- served in both healthy and acutely unwell populations. These often present through arrhythmias, where the heart beat is either persis- tently or occasionally irregular , too fast or too slow . While there are many dif ferent types of arrhythmias, among the most common are tachycardia (i.e., >120 beats/min), bradycardia (i.e., <45beats/min), atrial fibrillation (AF) and flutter (i.e., disordered and fluctuating heart beats) and ectopic beats such as premature ventricular and atrial contractions (i.e., PVCs/P ACs). Many arrhythmias are asymptomatic or benign, and can occur in otherwise healthy indi viduals seemingly randomly . Howe ver , at increasing frequency for patients in high risk groups, the y may be a precursor to, or part of an acute condition. AF has been shown to predispose a patient to stroke or heart failure. PVCs have been shown to manifest with cardiomyopath y and myocardial infarction. An electrocardiogram (i.e., ECG , or EKG ) measuring electrical activity in the heart over time is the main diagnostic approach for in vestigating cardiac abnormalities. An ECG examination requires a patient to ha ve 2, 6 or 12 leads connected to electrodes correctly attached to skin across their chest and limbs. Bedside and portable telemetry Holter ECG monitors are the clinical gold standard for (a) (b) (c) (d) Figure 1: 6-second PPG signal samples. (a) is a regular rhyth- mic PPG signal, while (b), (c) and (d) contain cardiac anomalies. accurate cardiac diagnosis. Howe ver , they are impractical or uncom- fortable for long-term continuous use in ambulatory patients, so ECG in vestigations typically only take place over relati vely short pe- riods of time for patients who have presented other symptoms which warrant the in vestigation. As a result, many rarer , asymptomatic or early-onset cardiac conditions can be missed. In contrast, con veniently small, unobtrusi ve and inexpensiv e wear- able devices such as smart w atches and fitness trackers which include a photoplethysmography (PPG) sensor to monitor the user’ s pulse hav e become extremely popular . PPG is an optical sensing technique which transmits specific light wa velengths into well-perfused skin tissue, and measures the amount of light reflected back - thereby measuring the changing volume of blood in the tissue ov er time following each pulse wav e ejected from the heart. A typical real wearable device pulsatile PPG w av eform is shown in Figure 1(a). Under normal conditions, the heart atria and ventricles contract sequentially to pump blood into the arterial system. Under abnormal conditions there can be a mistiming of contractions (e.g., a PVC), which can cause faster rhythm and reduced cardiac output. Similarly , reduced or no atrial contraction with erratic ventricular contraction (e.g., AF) can lead to random heart rate and cardiac output. As PPG only measures the output of the heart into the circula- tory system, it cannot fully characterise the underlying heart activity which preceded it as with the fidelity of an ECG. Howe ver, since many cardiac abnormalities affect the heart’ s pulse wav e output, they can disrupt in v arious ways – albeit sometimes subtly – blood flo w and thus ‘glitch’ subsequent PPG waveform rhythm and morphol- ogy . Real examples of brief cardiac anomalies disrupting the PPG Workshop on Machine Lear ning for Medicine & Healthcare, KDD 2018, London, UK Stew ar t Whiting, Samuel Moreland, J ason Costello, Glen Colop y , Christopher McCann wa veform morphology are shown in Figures 1(b), (c) and (d). Ac- cordingly , we posit that deeper analysis of PPG wav eforms beyond just pulse rate can provide clues of cardiac function from a wearable device PPG sensor worn comfortably all the time. This has the po- tential to dramatically increase the clinical value of data from the current generation of PPG-based wearable de vices. Firstly , cardiac abnormality clues identified in wearable PPG can be used to flag the patient for a thorough ECG in vestigation. Secondly , monitoring these types of ev ents in broader populations may lead to new in- sights around their long-term and large-scale occurrence and impact in general populations. Finally , these clues may provide a salient signal of cardiac function which can augment health deterioration early warning algorithms – allowing them to make earlier and more accurate predictions for many serious health conditions. 2 RELA TED WORK Finding "surprising/interesting/unexpected/nov el" sub-sequences in time series is generally referred to as anomaly detection [ 6 ]. A wide body of literature originating in machine learning and statistics has dev eloped generalisable and domain-specific anomaly detection and classification techniques, typically based on learning common patterns and expected statistical distrib utions [2]. Anomaly detection and classification approaches have long been applied to ECG and electroencephalography (EEG) signals. For e x- ample, [ 8 ] used deep learning to identify cardiac events in ECG. ECG data has very distincti ve morphology (i.e., PQRST wa veform complex), and many algorithms ha ve been built into ECG monitors to automatically classify certain cardiac conditions such as ST ele- vation with high precision. In contrast, PPG contains less time and frequency domain information, and is more susceptible to calibration and motion artefact noise, so requires a dif ferent approach. Specifi- cally for recognising PPG wav eforms impacted by artefacts, Signal Quality Indices (SQI) identify good and bad PPG signals [ 3 , 7 ]. SQI are heuristic-based models, based on the timing of pulse wav es and known physiological distrib utions. They classify larger fragments of signal as a binary good or bad, and are not designed to highlight specific anomalous regions of PPG signal. 3 PPG ANOMAL Y DETECTION Artefacts in PPG can originate from many sources, including (i) physiological abnormalities (e.g., cardiov ascular issues), (ii) motion corruption, and (iii) poor PPG calibration (i.e., how much light to transmit into the skin - which is affected by skin colour , circulation, adipose tissue and sensor contact pressure). As we are interested in recognising physiological artefacts - our approach must first rule out that the source of any anomaly recognised is not from motion or calibration issues. Consequently , the snap40 upper-arm wearable device emplo ys various continuous proprietary calibration routines which quickly recalibrate the PPG signal if it is compromised, e.g., the patient mov es the de vice for comfort to a location on their arm with different tissue properties. Moreover , the snap40 de vice discards PPG signal data when wearer motion will irretriev ably corrupt the PPG signal. Since cardiac abnormality analysis is v ery sensitiv e to small perturbations in the wav eform caused by motion, we set the motion filtering lev el to ’v ery still’, in laying or sitting postures. Input PPG signal Auto-encoded PPG signal Figure 2: Input PPG and autoencoded counterpart examples. Note the autoencoder failing to repr oduce anomalous regions. Our proposed cardiac abnormality detection approach comprises two stages. Firstly , we train an autoencoder to learn what typical normal PPG morphology and rhythm looks like. T o this end, we employ a deep recurrent neural network LSTM autoencoder which is capable of learning the time- and freqency-domain patterns found in clean PPG signal. Secondly , we use this autoencoder to encode and then reconstruct the input PPG signal based on its reduced di- mensionality representation. By measuring the differences between autoencoded and original PPG signals, we identify regions of the PPG signal that the constrained autoencoder representation fails to sufficiently reproduce – i.e., the specific anomalies. This unsuper- vised approach allows us to recognise anomalies without needing to explicitly label an anomaly training set at scale. 3.1 Deep-learnt A utoencoder Implementation Abstractly , an autoencoder learns, without supervision, an optimal reduced dimensionality representation of its training e xamples giv en permitted representational complexity (i.e., the number of neurons and hidden layers). In this application, an autoencoder provides an unsupervised method of learning the common and defining morpho- logical and rhythm patterns of PPG signals. Accordingly , anything that is atypical in the input PPG signal is not encoded/decoded in the subsequent autoencoder output. T wo examples of PPG signal including cardiac abnormalities, and their autoencoded counterparts, are presented in Figure 2. Note how the autoencoder adequately reproduces components which have time and frequency typically seen in regular PPG signal, howe ver falters around unusual patterns – it is this faltering that allo ws to us to automatically recognise and flag specific abnormal PPG regions. Recognising Cardiac Abnormalities in Wearab le Device Photoplethysmog raph y (PPG) with Deep Lear ning Workshop on Machine Lear ning for Medicine & Healthcare, KDD 2018, London, UK 0.75 0.50 0.25 0.00 0.25 0.50 0.75 1.00 (a) 0.4 0.2 0.0 0.2 0.4 0.6 0.8 1.0 (b) (c) (d) Figure 3: (a) and (b) show windowed Pearson’ s r autoencoder reconstruction error from the PPG examples presented in Fig- ure 2. Flagged PPG anomalies are shown in (c) and (d). So the autoencoder does not learn to represent and reproduce the anomaly patterns we wish to e xpose, it is essential it is trained using only clean PPG signal samples without abnormalities. Accord- ingly , we constructed a dataset of approximately 400,000 8-second clean and regular PPG signal samples from 300+ real patients, boot- strapped by semi-supervised FFT -based frequency analysis on a random sample of around 2,000 PPG fragments. W e do not e xplic- itly label any specific anomalies. As human physiology often follo ws many hea vy-tailed distributions, and a deep-learnt model requires a lot of training examples to be effecti ve, a training set of this scale is necessary to reliably include clinically expected pulse rates of 35-180 beats/min, and v arious common physiologies such as high and low , but not abnormal, heart rate variabilities. Digital signal processing (DSP) filtering was used to clean, down- sample and normalise PPG signal for the autoencoder . Since PPG is a time series, the autoencoder is a sequence-to-sequence model, implemented as a long-short term memory (LSTM) recurrent neural network in T ensorflow [ 1 ]. Preliminarily , we used a 2-layer (with 80/40 neurons) LSTM. Ho wever , optimal neural network architec- ture and training is entirely dependent on the device sensor character - istics, DSP pipeline used, run-time constraints, training computation av ailability , training data scale and desired sensitivity goals. 3.2 Flagging Anomalous PPG Regions Anomalous PPG signal regions are identified when the original PPG signal and its autoencoded counterpart diver ge, as measured by a difference metric. Importantly for healthcare, this approach supports explainability as it explicitly flags specific irregular PPG signal regions for further automated analysis or manual human re view . W e found absolute error as a dif ference metric is overly sensiti ve to occasional autoencoder underfitting for low frequency modulation in the PPG signal due to respiratory and parasympathetic induced variation [ 4 ]. Future work to increase training data, using longer PPG length and neural network tuning will likely alleviate this. Instead, computing Pearson’ s r correlation co-efficient o ver sliding windows of the input PPG signal and its autoencoded counterpart was suf ficient to reliably recognise anomalous regions. Sensitivity of the anomaly detection is governed by both the size of these windows and the r selected as an anomaly threshold. W e selected half-second windows, with anomaly le vel r < 0 . 6 for experiments in Section 4. In Figures 3(a) and (b), we present the aligned autoencoder error , as measured by Pearson’ s r . The respectiv e Figures 3(c) and (d), show the identified anomalies, defined as periods where r falls be- low 0.6. Figure 3(c) sho ws multiple similar anomalies manifesting rapidly , with two dominant faster/slower frequencies manifesting in the PPG signal. Meanwhile, Figure 3(d) shows a single anomaly which is prominent compared to its surrounding PPG context. 4 EXPERIMENT , RESUL TS & DISCUSSION T o preliminarily e valuate and analyse the potential of our proposed approach, we inv estigate clinical and wearable sensor data from hundreds of clinical study patients with a range of pathologies and acuities being cared for in dif ferent settings in the UK and USA (e.g., in hospital wards, during sur gery and at home). Follo wing recruitment, patients wore the snap40 device on the upper-arm for one hour to ten days while undergoing standard care. The snap40 device passi vely captured lo w-motion green PPG sensor data, and wirelessly transmitted high fidelity waveforms for post-hoc analysis. The clinical studies and their respecti ve patient populations were as follows: HDU : (medical/surgical high-dependency unit), comprises 120 patients who are high acuity and continuously mon- itored, wearing the device during the day . AMU : (acute medical unit) consists 250 patients higher acuity patients who hav e been recently admitted to hospital, wearing the de vice for up to 10 days, 24 hours a day . SURGER Y : consists 30 peri- and post-operative general surgery patients, wearing the device for up to 2 days, 24 hours a day . ED : consists of 250 emergenc y department patients of varying acuity , wearing the device between 30-240 minutes, dur- ing the day . HOME : consists of 8 heart bypass patients for 2 days post-discharge to home care, wearing the de vice 24 hours a day . In Section 4.1, we first examine the accuracy and sensitivity of the proposed approach for recognising known cardiac abnormalities in PPG signal, compared to abnormalities (i.e., PVCs) recognised by a con ventional bedside ECG monitor . Of course PVCs are only one type of cardiac abnormality , so this initial methodology pro vides an initial insight into performance using ECG-based gold standard (GS) PVC detection as a first proxy for real abnormal cardiac e vents. Since few patients recei ve continuous ECG monitoring, ev en in the hospital, this ev aluation is based on the subset of HDU patients who had leads correctly attached for continuous ECG monitoring for whom we hav e data av ailable. For these patients, we hav e a once-a- minute count of the zero or more PVCs detected in their ECG ov er that minute. W e align av ailable wearable PPG sensor data over each of those minutes, and compute set-based comparative ev aluation measures (i.e., classification accuracy) based on the presence or absence of anomalies detected in the aligned PPG, and respectiv e GS PVCs. W e filter GS PVCs to those where there is at least 30- seconds of high quality aligned wearable PPG signal av ailable. Follo wing this, in Section 4.2 to understand how cardiac ab- normalities manifest at lar ge in PPG signal collected from di verse patient populations, we analyse the o verall and per -patient frequency of the cardiac abnormalities detected with our proposed approach. Workshop on Machine Lear ning for Medicine & Healthcare, KDD 2018, London, UK Stewar t Whiting, Samuel Moreland, Jason Costello, Glen Colopy , Christopher McCann 4.1 Comparative ECG Gold Standard Evaluation Our test dataset contains 29 patients with a total of 2,852 zero or more PVCs/min GS observations (i.e., 47.6 hours ECG monitoring, av eraging 98 minutes of observ ations per patient), where each GS observation has ≥ 30 seconds of aligned good quality PPG signal. 2,465 (86.4%) of the GS PVCs/min are 0 PVCs/min observations, 387 (13.6%) are >= 1 PVCs/min observations while 195 (6.8%) are >= 2 PVCs/min observations. At the extreme, one patient has a GS observation with 7 PVCs/min; sho wing PVCs are heavily ske wed. In T able 1, we present the set-based detection accuracy confusion matrix for recognising GS PVCs (when there is >= 1 PVC/min) in PPG signal using our proposed approach. Our proposed approach successfully recognises around 60% of PVCs in the PPG signal alone, and incorrectly recognises 23% of PPG signals without a PVC as having a cardiac abnormality . This may be a genuine approach error , or it could be another type of cardiac abnormality . Additionally , because of our high-motion PPG filtering, we do not have complete PPG signal coverage ov er the gold standard periods, so may miss some PVCs with this methodology limitation. Furthermore, the gold standard itself will also have PVC classification error . [ 5 ] found of 22,509 arrhythmia alarms analysed, 27.4% where false alarms which grew to 91.4% for acute life-threatening alarms, with no ev ents missed – indicating a preference for f alse positi ves rather than false neg ativ es, thus affecting our e valuation metrics. Allowing 1 or more PVCs/min in the GS means cardiac abnormal- ities are rare for the majority of GS observations. Accordingly , we compute the confusion matrix when there are 2 or more PVCs/min present in the GS. This increases true positiv es to 132 (68%) - show- ing that when cardiac abnormalities are more prevalent, our PPG- based approach is increasingly more effecti ve in recognising them. Overall these initial results are v ery encouraging as they demon- strate that e ven with a limited e valuation methodology , a basic model can achiev e reasonable sensiti vity while maintaining specificity . Fu- ture w ork will inv estigate more rob ust methods to identify anomalies in autoencoder output, and if possible, classify the specific cardiac ev ents which caused them. 4.2 Patient Population Analysis W e use our proposed approach to identify cardiac abnormalities in over ten thousand hours of PPG data randomly sampled from sev eral large-scale clinical studies using the snap40 wearable device. Analysis results are presented in T able 2. Patient demographics and biases can explain man y of the cardiac abnormality differences between populations. Expectedly , the often older and higher acuity patients in HDU and AMU had the most PPG samples with cardiac anomalies (i.e., 5.1% and 5.8%, respectively). In contrast, recently dischar ged patients at HOME had fe wer PPG samples with cardiac abnormalities ov erall (i.e., 3.52%) - and with lesser variability indicating more stable cardiac health compared to in-patients. Likewise, ED has a wide range of patient acuities (indeed many will go to AMU), so while it has on average a lower PPG-based cardiac abnormality occurrence (i.e., 3.1%), some patients hav e far more as sho wn by the large variability (i.e., ± 7 . 9% ). Interestingly , SURGER Y patients had the fewest PPG samples with cardiac ab- normalities, perhaps due to selection of fitter patients eligible for surgery , close monitoring or perhaps therapeutic ef fects. Anomaly in PPG ✓ Anomaly in PPG ✗ PVC in ECG ✓ 231 (59.7% true positive ) 156 (40.0% false ne gative ) PVC in ECG ✗ 574 (23.2% false positive ) 1,891 (76.7% true ne gative ) T able 1: Set-based detection accuracy confusion matrix f or recognising ECG-based GS PVCs (when there is >= 1 PVC/min) in aligned PPG signal using our proposed approach. % of PPG samples with anomalies, per patient Population: A vg (Stdev) Max HDU 5.10% ( ± 5 . 0%) 17.4% SURGER Y 1.54% ( ± 2 . 2%) 6.9% ED 3.17% ( ± 7 . 9%) 59.1% AMU 5.75% ( ± 11 . 9%) 61.5% HOME 3.52 ( ± 1 . 9%) % 5.8% T able 2: Frequency of cardiac abnormalities recognised in PPG samples, aggregated per patient, in each patient population. 5 CONCLUSION Cardiac abnormalities such as ectopic beats and AF manifest in a wearable device PPG wav eform as they disrupt blood flow . Some of these abnormalities are benign, while others can be a serious health risk factor . Accordingly , identifying cardiac abnormalities in PPG signals provided by a con veniently practical wearable de vice, as opposed to conventional incon venient ECG monitors requiring multiple electrodes and leads can be valuable. W e demonstrated that cardiac abnormalities, where PPG signal deviates from typical morphology and rhythm, can be recognised in wearable PPG signal with an unsupervised deep-learnt autoencoder anomaly detection approach. Preliminary ev aluation on a lar ge ECG- based gold standard dataset sho wed our approach recognises 60%+ of ECG-detected PVCs in PPG signal, with a false positiv e rate of 23%. Expectedly , analysis of sev eral large clinical study datasets showed cardiac abnormalities detected are more frequent in higher acuity patients. Future work will enhance accuracy and sensitivity , and explore specific cardiac e vent classification. REFERENCES [1] M. Abadi, et. al. T ensorflow: A system for large-scale machine learning. In OSDI’16, pages 265–283, Berkeley , CA, USA, 2016. USENIX Association. [2] V . Chandola, A. Banerjee, and V . Kumar . Anomaly detection: A survey . ACM Comput. Surv . , 41(3):15:1–15:58, July 2009. [3] W . Karlen, K. K obayashi, J. M. Ansermino, and G. A. Dumont. Photoplethysmo- gram signal quality estimation using repeated gaussian filters and cross-correlation. Physiological Measur ement , 33(10):1617, 2012. [4] W . Karlen, S. Raman, J. M. Ansermino, and G. A. Dumont. Multiparameter respiratory rate estimation from the photoplethysmogram. IEEE TBME , 60:1946– 1953, 2013. [5] N. Kurka, T . Bobinger, B. Kallmünzer , J. Koehn, P . D. Schellinger , S. Schwab, and M. Köhrmann. Reliability and limitations of automated arrhythmia detection in telemetric monitoring after stroke. Stroke , 46(2):560–563, 2015. [6] J. Lin, E. K eogh, S. Lonardi, and B. Chiu. A symbolic representation of time series, with implications for streaming algorithms. In ACM SIGMOD 2003 , DMKD ’03, pages 2–11, New Y ork, NY , USA, 2003. ACM. [7] C. Orphanidou, T . Bonnici, P . Charlton, D. Clifton, D. V allance, and L. T arassenko. Signal-quality indices for the electrocardiogram and photoplethysmogram: Deriv a- tion and applications to wireless monitoring. IEEE JBHI , 19(3):832–838, 2015. [8] M. A. Rahhal, Y . Bazi, H. AlHichri, N. Alajlan, F . Melgani, and R. Y ager . Deep learning approach for acti ve classification of electrocardiogram signals. Information Sciences , 345:340 – 354, 2016.
Original Paper
Loading high-quality paper...
Comments & Academic Discussion
Loading comments...
Leave a Comment