Audio-based performance evaluation of squash players
In competitive sports it is often very hard to quantify the performance. A player to score or overtake may depend on only millesimal of seconds or millimeters. In racquet sports like tennis, table tennis and squash many events will occur in a short t…
Authors: Katalin Hajdu-Szucs, Nora Fenyvesi, Jozsef Steger
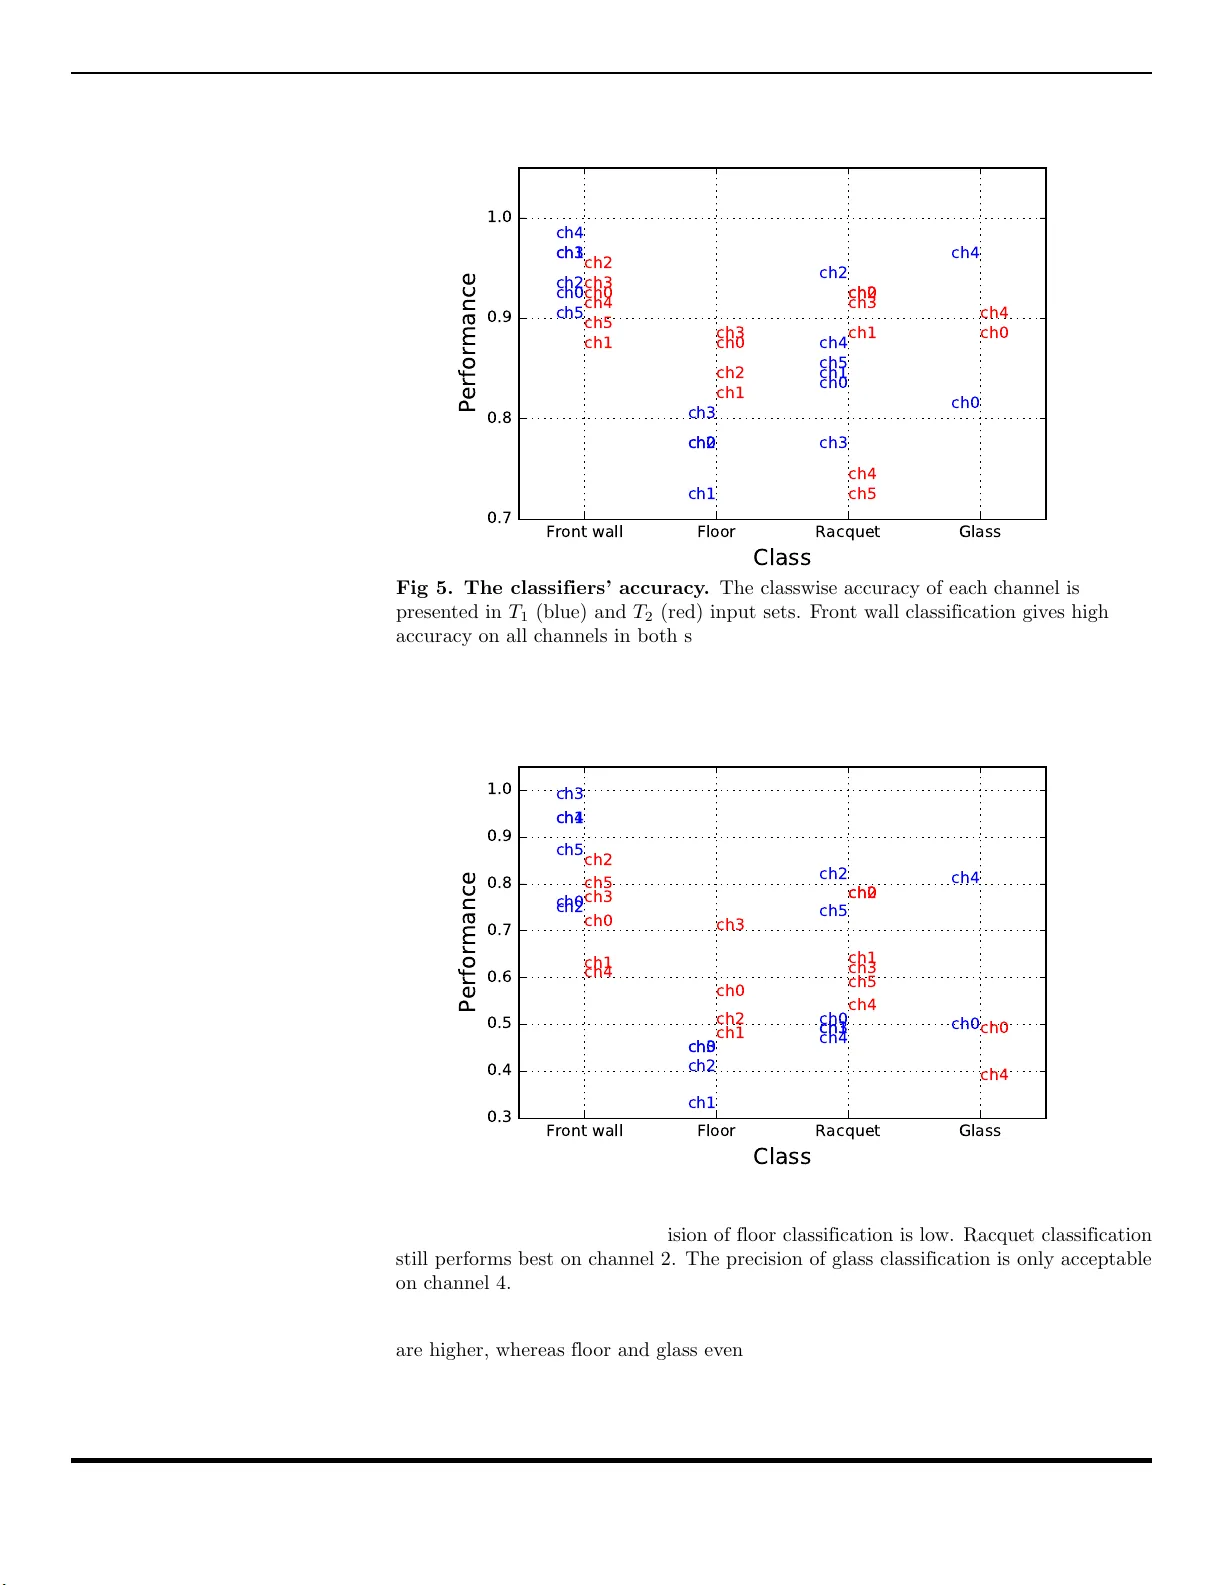
Audio-ba sed p erfo rmance ev aluat ion of squash pla y ers Katalin Ha jd´ u-Sz ¨ ucs 1* , N´ ora F enyv esi 2 , J´ ozsef St ´ eger 2 , G´ ab or V attay 2 1 Dept. of Information Systems, E¨ otv¨ os Lor´ and Universit y , Budap est, Hungary 2 Dept. of Physics of C o mplex Systems, E ¨ otv¨ o s Lor´ and Univ ersity , Budap es t, Hungar y * sz ucsk@caes a r.elte.hu Abstract In comp e titiv e sp or ts it is often very hard to quantify the per formance. A play er to score o r overtak e may dep end on only millesimal of seconds o r millimeters. In racquet sp orts like tennis , ta ble tennis a nd squa s h many even ts will o ccur in a sho r t time duration, whose r ecording and ana lysis can help re veal the differences in per formance. In this pa p er we show that it is po ssible to architect a fr amework that utilizes the characteristic sound patterns to precisely cla s sify the types of and lo calize the po sitions of these even ts. F rom these basic infor mation the sho t t ype s and the ball sp eed along the tra jecto ries can b e estimated. Comparing these estimates with the optimal s p eed a nd target the precisio n of the shot can be defined. The detailed shot statistics and precision infor ma tion sig nificantly enriches and improves da ta av ailable to day . F eeding them back to the play er s a nd the coaches facilitates to describ e playing per formance ob jectively and to impr ove strategy skills. The framework is implemented, its hardware a nd soft ware compo nents are installed and tested in a s quash court. 1 In tro duction A t pr esent in c omp etitive s p o rts ther e are a lot of talented sp ortsmen and the differences b etw een individual p e rformance a re often v ery small to sp ot. It catalys es a race co ndition to b e prese nt alre ady in the practising p erio d, th us more and mor e coaches and players s e ek finding different means and aids to elab orate and ma ke the preparatio n for the to urnaments alwa y s more effective. There a re a lot o f new techn ologica l achiev emen ts av a ilable in the market. Small electro nic devices are capable of meas ur ing v a rious metr ics including thos e that ar e re lev ant for the sp or ts, like heart r ate a nd blo o d temp era tur e and pr e s sure reg isters, p edometer s, sp eedometers and a ccelerometer s to na me a few. Using such devices is more tha n necessary since the re s ults in a comp etition and then the final scores may dep end on millesimal of millimeter s . Another r eason why to use mea surement devices yielding ob jective p er formance metric s is b eca us e when sp or tsmen ar e overloaded in a per formance, with a drenalin in their vein, it is hard if po s sible for them to sp ot and fix their failures. In certain t yp e s of sp or ts a contin uous or prompt feedback is definitely helpful, s q uash is one o f them. Squash is a very ra pid ball and racquet game with t ypically 40-60 hit even ts p er second. Depending on the v arious sur faces the ba ll interacts dur ing its flight defines the different shot class e s. Some sho t classes are very rar e due to b eing tr icky to deliver or may o ccur o nly in cir c umstances where the rally may seem a lready lo st. So knowing the detailed sta tistics o f v a r ious hits and shot patterns talks ab out the quality of the s po rtsmen and ar e very imp ortant information for b oth the coaches and 1 the squash play ers . How ever, thes e da ta a nd their statistica l ana lysis are not av ailable at pre s ent b eca use of the paste of squash. Given its fast sp eed the hum an pr o cessing of even ts ena bles the sco re r egistratio n in re a l-time o nly , but the recording of sho t t yp es and the detailed se quences of the shots are rendered definitely imp o ssible. One po ssible solution mig h t be to analys e video s of the matches using ima ge pr o cessing as it ha s b een shown to work for the tennis [1]. Though fo r the squas h it turns out that this approach remains difficult even with the use of high spee d and high re solution cameras, due to the small size of the ba ll a nd the view provided by the cameras. T raditio na lly camera s are placed b e hind the court, therefore the play ers will most often cov er the sight o f the ball during the match making the r econstruction o f ball tra jectories a n inaus pic io us pr oblem. T o provide reliable statistics by this a pproach will require human pr o cessing and v alida tion so in the end a thorough analysis o f the tournament will cost ma ny times o f the duration of this sp ort even ts in man-hours. In this s tudy w e intro duce a framework to unhide these information based o n the analysis o f acoustic data. Playing s quash pro duces ch aracter istic s ound patter ns. The sound fo o tprint of ea ch r ally is a pro jection of all the deta ils ab out the streng th and the pos ition o f the ball hitting v arious surfaces in the c o urt. Naturally , this pattern, which maintains the natural or der of the even ts , is contaminated by some additional noise. Recording the sound in mor e dire c tions a llows for inv erting the problem and for giving statistical statements a b out wher e and what type o f an even ts to ok place in the play . W e ar e fo cus ing on even ts genera ted by the ball hits, which serves as a basis for further analysis and the reco nstruction of shot patterns or the ball tra jectories. Note, the framework to b e detailed can b e applied to v arious o ther types o f ball ga mes. The subsequent sections of the pa per ar e structured as follows. Section 2 details the hardware comp onents installed in a squas h court to r ecord input. In sections 3, 4 and 5 ma thematical mo de ls ar e presented to detect, lo calize and classify audio even ts resp ectively . The data co llection is describ ed a nd the results ar e presented in section 6. Finally , metho ds descr ibe d in this study is co mpared to the rela ted works of the topic in section 8 . 2 The measuremen t equipmen t This study is bas ed on the analysis of sound wav es g enerated during the squash play . Among many other , squa sh is a ga me where v a rious different sources of so und a re present, including the play er s themselves (their sig hing or their sho es s queaking o n the flo o r), the ball hitting sur faces (like the walls, the flo or or the r acquet) a nd also external sources (including the ov ation of the sp ectator s o r sound gener ated in an adjacent court). Here we fo cus o n audio even ts rela ted to the ball. When pla nning the exp eriments the following co ns traints had to b e inv estig ated and satisfied. The framework sho uld be fast in signa l pr o cessing p oint o f view, b ecause the target information can b e most v aluable when in a co mpetitive situation it helps fine tune tactica l decisio ns ma de by the coa ch and/or the play er. The cost o f the equipment should b e kept low a nd the installatio n of the sensor s requir es a careful design to prevent them from disrupting the play . As the spa tial lo c alization of the ball is one o f the fundamental go als a low er b ound to the sampling r ate is enforc e d to remain able to differentiate b etw een displa ced so und sources. In Fig 1 the hardware and softw are comp onents are sketc hed. Hardware comp onents include 6 a udio senso rs, three of which are omnidirectional microphones (Audio T echnica ES945 ) sinking in the flo o r a nd the r est o f them a r e cardio id microphones (Audio T ec hnica P RO 45) ha nging from the top. Amplification and sampling of the micr ophone sig na ls a re done by a single dedicated sound ca rd (Presonus AudioBox 1 818VSL) so that all channels in a sample frame a re in synchron y . 2 The highest sa mpling r ate o f the so und car d is used (96 kHz), so by ea ch new sample the front o f a so und wa ve trav els approximately 6 mm. Capture Analysis Storage Monitor interface Control interface Detection Localization Classification Raw data Configuration Repeater Sensors Digitizer Stream dispatcher Measurement components Output queue Fig 1. A schematic view of the com p onents. T o pr o cess audio even ts in the sqash court a three comp onent ar chitecture was des ig ned. According to their functiona lities softw ar e c o mpo nents fall in the following g roups. Signal pro cessing is do ne in the analy s is mo dule, which include the detection of the audio even ts, the c la ssification a nd the filtering of the detections and after ma tch ing even t detections of mo r e channels the lo ca lization of the sound source. While these steps o f s ignal pro cessing c a n b e done real-time a storage mo dule is als o implemented so tha t the a udio o f imp ortant matches can b e recor ded. Recor ding o f data helps training of the para meters of the class ification algo rithms, a nd it also enables a who le re-analy sis of former data with different detector s a nd/or different cla ssifiers. All output generated by the Analys is mo dule is fed to the output queue. Hardware a nd softw ar e co mpo nents ar e triggere d and reconfigur ed via a w eb ser vices API ex p o sed by the Control interface. Finally , to b e able to listen to what is going on in the remote court a Monito r ing interface provides a mixed, downsampled and compress ed live stream across the web. 3 The ball impact detection The lo calization a nd the c la ssification o f ba ll hits b oth requir e the precise ident ification of the b eginning o f the corr esp onding even ts in the audio streams. The detection of ball impac t even ts is car ried out for each a udio channels indep endently and in a para lle l fashion, which sp eeds up the overall p erfo r mance of the fra mework significantly . Diff erent detectio n alg orithms of v ar ious complexities were inv estigated t wo extreme c a ses ar e sketched her e. The firs t mode l assumes that the background noise follows the no rmal distribution. An event is detected if new input samples deviate fr om the Gaussian distribution to a certa in predefined threshold v alue. Next for each channels the mean a nd the v ariance e s timates o f a finite subset of the samples are contin ually up dated a ccording to the W elford’s a lg orithm [2]. The seco nd metho d is a n extension of the window e d Gaussian surpr ise detection by Schauerte and Stiefelhag en [3]. The a lgorithm tackles the pr oblem ev a luating the relative e nt ropy [4]. It is first applied in the frequency domain and if there is a detection then a finer sca le sear ch is carr ied out in the time domain. The p ower 3 sp ectrum of w -sized ch unks o f windowed data samples is calculated. Betw een detection regime the ser ies o f the p ow er sp ectra is mo delled by a w -dimensio nal Gaussian. The a pr iori par ameters o f the distr ibution ar e ca lculated for n elements in the past, and the p oster iori par ameters ar e approximated including the new p ow er sp ectrum. The Kullback Leibler divergence b etw een the a prio ri a nd the p osterio ri distributions exceeds a predefined thre s hold when a new detection takes place S i = 1 2 log | Σ i | | Σ ′ i | + T r Σ − 1 i Σ ′ i − w + µ ′ i − µ i T Σ − 1 i µ ′ i − µ i , where pr imed parameters corres po nd to the p oster iori distr ibutio n. T he time resolution at this stag e is w and to increa se precision a new search is carried out in the time do main ev a luating the K ullback Leibler divergence for 1 -d data . In or der to bo otstrap a prior i distr ibutio n par a meters n sa mples from the former windows a r e used. 4 The lo calization of sound ev en ts In this s ection we lay down a probabilistic mo del to determine the time a nd lo catio n of an audio even t. F o r a unique even t we denote these unknowns t and r ev resp ectively . The inputs r equired to find the audio even t are the lo cations of the N + 1 detecto rs r mike i and the timestamps τ i when these synchronized detector s sens e the even t (0 ≤ i ≤ N ). The probability tha t micr ophone i detects a n even t at ( r , t ) is p ( t i , r i ) = 1 √ 2 π σ i exp − ( ct i − r i ) 2 2 σ 2 i c 2 , where c is the sp eed of sound, t i = τ i − t is the propag a tion delay and r i = || r − r mike i || is the distance b etw een the sound sour ce and the micr ophone. The uncertaint y σ i depe nds o n the characteristics of the micropho ne, which we will c o nsider constant in the first approximation. By intro ducing r elative delays ˆ τ i = τ i − τ 0 the join t proba bility o f rela tive de lays detected is p ( ˆ τ 1 , . . . ˆ τ N ) = Z d t 0 p ( t 0 , r 0 ) N Y i =1 p ( ˆ τ i + t 0 , r i ) . The formula ca n be r earra nged p ( ˆ τ 1 , . . . ˆ τ N ) = 1 √ 2 π N +1 Q N i =0 σ i Z d t 0 e − f ( t 0 ) , where f ( t 0 ) = P N i =0 ( c ˆ τ i + ct 0 − r i ) 2 2 σ 2 i c 2 is a q ua dratic function and in the express ion for p the Gaussian in tegral follows Z d t 0 e − f ( t 0 ) = s 2 π f ′′ ( t ∗ 0 ) e − f ( t ∗ 0 ) . The first or der deriv ative f ′ v anishes in t ∗ 0 = Σ 2 P N i =0 1 σ 2 i r i c − ˆ τ i , where Σ 2 = 1 / P N i =0 1 σ 2 i is intro duced for conv enience. After substitution of t ∗ 0 we a rrive at f ( t ∗ 0 ) = 1 2 N X i =0 1 σ 2 i r i c − ˆ τ i 2 − Σ 2 " N X i =0 1 σ 2 i r i c − ˆ τ i # 2 . 4 This formula ca n b e interpreted as a v ar iance formula, which can b e rewritten f ( t ∗ 0 ) = 1 2Σ 2 N X i =0 1 σ 2 i N X j =0 1 σ 2 j r i − r j c − ( ˆ τ i − ˆ τ j ) 2 . A g o o d a pproximation of the audio even t maximizes the likelihoo d p , which at the same time minimizes f ( t ∗ 0 ), thus w e see k the solution of ∇ r f ( t ∗ 0 ) = 0 equa tions. In practice f behaves w ell and its minimum can b e found by g radient desce nt metho d. Fig 2 s hows a situa tion, wher e the ball hit the front wall and 6 micropho nes detect this e vent er ror free. T o show the functions b ehaviour f is ev alua ted in the flo o r, in the fro nt wall and in the right side wall. Finding the minimum of f takes less than ten g radient s teps . 0 1 2 3 4 5 6 7 0 2 4 6 8 1 0 0 1 2 3 4 5 c h 0 c h 1 c h 2 c h 3 c h 4 c h 5 Fig 2. The visuali zation of the li k el iho o d function. The ball hit the front w all. f ( t ∗ 0 ) c an b e ev alua ted in space given the p ositions of the sensors (marked by w hite disks) to find its minimum, which indicates where the even t too k place. (0.5 m fr o m the right corner a nd 3 m ab ov e the flo or, marked b y a blue disk.) The likelihoo d based lo c alization mo del is der ived for a noiseles s situation, assuming the per fect detection of samples in each channel. In re al environment , how ever, noise is pr esent and the err o r deviating the detection is exp osed in the final result o f the lo calization. In order to track this effect the method was numerically inv estiga ted as follows. 10 0 00 p oints in the volume of the co ur t is selec ted ra ndo mly and the sound pr o pagation is calcula ted in each six microphones . Next for the ideal detections Gaussian no ise is a dded in all channels, with increasing v ariation ( σ = 1 , 10 , 50). In Fig 3 the noiseless c ase is compa r ed to cases with increas ing error s. In the figur e the cumulativ e distributio n o f the erro r, ie. the difference b etw een the randomly selected point a nd the lo catio n gues s by the mo del is pr esented. Na tur ally , by incr easing the detection er ror the er ror in the p osition guess is increasing, but the mo del per forms very well, for p o o r signa l detector s the err or in lo calizatio n is in the order o f 10 cm. 5 Classification It is the task of the classification mo dule to distinguish b etw een the differe n t sound even ts according to their o rigin. Sound event s a re cla ssified ba sed o n the type of the surface that suffered fro m the impact of the ball. This s urface can b e the wall, the racquet, the floo r o r the glass . When the sound do es not fit any of these cla s ses, like the squeaking sho es, then it is classified as a false even t. The cla ssification enhanc e s 5 1 0 - 5 1 0 - 4 1 0 - 3 1 0 - 2 1 0 - 1 1 0 0 1 0 1 Di st a n c e d [ m ] 0 . 0 0 . 2 0 . 4 0 . 6 0 . 8 1 . 0 P ( e r r or < d ) n o i se l e ss si g m a = 1 si g m a = 1 0 si g m a = 5 0 Fig 3. The cumulativ e distribution of the lo calization error. F or a noiseless case most often lo calization will hav e a n error compa r able to the size of the ball. With a ba d detector ( σ = 5 0 s a mples) still the lo caliz ation is exact in the order o f 10 cm. the ov era ll p er formance of the sys tem by tw o means. First, skipping to lo calize the false events spee ds up the pr o cessing. And seco nd, in doubtful situations when the calculated lo cation of the even t falls near to multiple p os sible sur faces, by knowing the t yp e of the surfac e that suffered from the impact can r einforce the lo caliz ation. F or example a so und event lo ca lized a few centimetres ab ov e the flo or could b e g enerated by a ra cquet hit close to the flo or or by the flo o r itse lf. Classification utilizes feed-forward neural ne tw orks tha t ha d b een trained with backpropagation [5 – 8]. The training sets a re c omp osed of vectors b elonging to 54 6 1 audio even ts, which have been manually la be lle d. Based on these audio even ts tw o t yp es of input were constr ucted for teaching. In the first case tempor al data is used directly . A vector elemen t of the training set T 1 is the sequence o f the s amples aro und the detections for each channels. T 1 = { ( a d − w , . . . , a d , . . . , a d + w ) } , where the channel index is dropp ed and d is a uniq detectio n and w sets the leng th o f the v ector. Given the s ampling r ate 9 6 k Hz and setting w = 300 the neural netw ork is taught b y 6 . 25 milliseco nd long data. The second feature set T 2 is built up o f the p ow er sp ectra . T 2 = {|F ( a d , . . . , a d + w ) |} , where F denotes the discrete F ourie r tr a nsform. A s ingle neur al netw ork mo del wher e all even t classes ar e handled together per formed po o rly in our ca se. Therefore, se pa rate discr iminative neural net w ork mo dels were built for a ll four class e s (racquet, wall, floo r and glass impac t) and for bo th of the tr aining sets. It has also b een inv estig ated if any of the input channels int ro duce discrepancy . In or der to discov er this effect mo dels were built and tra ined for e a ch unique channels and ano ther o ne handling the six channels to gether. Note, that not all p oss ible co mbinations o f the mo dels were trained due to the fa c t that 6 some channels po o rly detected c e rtain e vents, for exa mple micro phones near the front wall detected g lass events very rarely . In the tr aining sets the class of int erest w as alwa ys under-repres ented. T o balance the classifier the SMOTE [9] alg orithm was used, which is a synthetic minority ov er -sampling technique. A new element is sy n thesized as follows. The difference betw een a fea ture vector from the p ositive clas s and one of its k nea rest neighbours is computed. The difference is blown by a random num b er be tw een 0 and 1, to b e a dded to the or iginal feature vector. This technique forces the minority class to b ecome more general, a nd as a res ult, the class of in terest b ecomes equally represented like the ma jority set in the training data. Differen t ne tw ork configuratio ns were realized to find that for the direct tempo ral input a 20 hidden lay er netw or k (with 10 neuro ns in each lay er) p er formed the b est, while for the sp ectr a input a 10 hidden lay er (each lay er with 1 0 neur ons) is the b est choice. 6 Analysis In this section the p erformance of each mo dules of the fra mework a nd the datase ts are presented. 6.1 Datasets In order to analys e the comp onents of the framework implemen ting the prop osed metho ds t wo audio r ecord s e ts were used. Audio 1 w as r e c orded on the 18th of May 2016 when a squa sh play er was asked to target front w all s ho ts to sp ecific area s of the wall. This measur ement was necessa ry to increase the cardinality of front w all a nd racquet hit s ignificantly in the tr aining datasets T 1 and T 2 , and it was also manually pro cessed to b e a ble to v alida te the op era tions of the detector and the lo c a lization comp onents. Audio 2 resem bles data in a real situatio n as it contains a seven min utes squash match r ecorded o n the 8 th of Mar ch 2016 . T able 1 summar izes the details of these audio recordings . T able 1. The con tent of the audi o files . Class Ch0 Ch1 Ch2 Ch3 Ch4 Ch5 T otal Audio 1 F ront wall 165 165 165 165 1 65 165 990 Racquet 166 1 66 1 66 1 6 6 16 6 166 996 T otal 331 3 31 3 31 3 3 1 33 1 331 1986 Audio 2 F ront wall 100 1 09 1 08 1 1 0 10 7 111 645 Racquet 112 1 12 1 13 1 1 0 10 9 99 655 Flo or 85 70 7 5 19 11 5 11 375 Glass 46 20 24 1 5 62 11 17 8 F alse even t 227 2 74 2 54 2 6 4 45 6 147 1622 T otal 570 5 85 5 74 5 1 8 84 9 379 3475 The count o f even ts in Audio 1 and Audio 2 broken down for each clas s and each channel. In total 54 6 1 even ts hav e been la b eled. T raining the neural netw or k mo dels require prop erly lab e lled datasets. After applying the ba ll impact detection alg orithm to the audio recor ds the timestamps o f the detected events w ere manu ally categ o rized as front wall even t, racquet even t, flo or even t, glass event o r fals e even t. 7 6.2 Detection Results The per formance o f the detecto r is analyse d by comparing the timesta mp rep orted b y the detector d detect or and the h uman re a dings d human . F or Audio 1 in Fig 4 the cum ulative probability distribution of the time difference is shown for each channel and in T able 2 the av erage error and its v a riance are shown gr oup ed by the tw o even t t yp es present in the datas e t. One ca n obse r ve that the detectors in channels ch4 a nd ch5 p er form p o o rly . When estima ting the p osition discar ding one of or b oth of these channels will enhance the pre cision of the lo caliza tion. 0 2 0 4 0 6 0 8 0 1 0 0 T i m e st a m p d i ffe r e n c e ∆ [ sa m p l e s] 0 . 0 0 . 2 0 . 4 0 . 6 0 . 8 1 . 0 P ( | d h u man − d d e t e c t or | < ∆) c h 0 c h 1 c h 2 c h 3 c h 4 c h 5 Fig 4. The error of the detector. The detection er ror is defined as the difference betw een the timestamps ge ne r ated by the mo dule and read by a hum an. T able 2. The class and c hannel wise error of the detector. F ront wall Racquet ch0 9.6 ± 46 .0 -5.8 ± 6 3.7 ch1 3.1 ± 1.9 -9.3 ± 130 .6 ch2 3.5 ± 5.4 21.3 ± 129 .3 ch3 3.0 ± 1.9 7.3 ± 39 .9 ch4 221.4 ± 47 6.5 1 16.4 ± 401 .3 ch5 210.8 ± 51 2.3 23.5 ± 136 .2 The error of the detector algo rithm is measured in s amples fo r the v ar ious c la sses and all channels. In T able 3 the er r or sta tistics for datas e t Audio 2 is shown. In tensive even ts, like front w all impac ts , ca n b e detected precise ly , wher e a s the detection of milder sounds like a flo or or glas s impact is less accurate. The false disc overy and the false negative ra te of the detector were examined o n Audio 2 . F alse po sitives a r e co unt ed if detecto r s ignals for a false even t, and false negatives are the miss ing detectio ns. The r esults a r e s umma r ised in T able 4. 8 T able 3. Cl asswise error of the detector. Class Audio 1 Audio 2 F ront wall 4.8 ± 23 .3 6.9 ± 19 Racquet 3.4 ± 99.8 107 ± 85 Flo or 38.0 ± 1 41.1 125 ± 149 Glass n.a. 183 ± 173 The statistics o f the da taset Audio 1 is calcula ted for 660 e vents for ea ch cla ss excluding Flo or event s, co un ting 24 pieces. F o r Audio 2 200 even ts were av a ilable fo r each class. T able 4. Performance of the detector. F alse alarm Ch0 Ch1 Ch2 Ch3 Ch4 Ch5 FDR 39% 47% 44% 51% 54% 39 % FNR 16% 24% 22% 38% 5 % 43% F alse Discov ery Rate (FDR: n fp n tp + n fp ) a nd F alse Negative Rate (FNR: n fn n fn + n tp ) o f the detector based o n 34 75 even ts. 6.3 Classification Results Approaching the pr oblem a t first and to use as muc h information as p os sible to teach the neural netw orks a lar ge training set was constructed of the union of the detections of all the six channels. Howev er , this technique g av e po orer r esults than treating all the c hannels s eparately . The different settings of the microphones and the distinct acoustic prop erties o f the s q uash c o urt a t the micropho ne p ositions are found to b e the reasons of that phenomenon. Eight-fold cross -v alidation [10] was used on the datas e ts to ev aluate the per formance of the cla ssifiers. Three measures a re investigated c lo ser: the accuracy , the precision and the reca ll. Accuracy (in Fig 5) is the r atio of cor rect clas s ifications and the total num ber of cases examined ( n tp + n tn n ). Precision (in Fig 6 ) is the fractio n constrained to the r elev ant cases ( n tp n tp + n fp ). Recall (in Fig 7) is the fraction of r elev ant instances that a re retrieved ( n tp n tp + n fn ). T able 5 summarises the results o f the b est cla ssifiers for each class . It can b e seen that the class ifica tion of the front wall a nd the racquet even ts is reliable. How ever, the precision and the re call o f flo or and glas s even ts are po or. The r e a son for it is that these classes a re under-repres e nt ed in the data sets. Whenever x , an unseen sample comes, the bes t class ifiers of each cla ss are applied on the new ele ment . The prediction of the class lab el ˆ y to which x belo ngs to is computed by the following formula: ˆ y = arg max k ∈ C f k ( x ) − cut k 1 − cut k prec k P i ∈ C prec i , ∃ k : f k ( x ) > cut k false event , otherwise where C is the set of class lab els w itho ut the cla ss of false even ts and f k ( x ), cut k and prec k are the confidence, the cutoff v alue and the precision of the b est class ifier in class k r esp ectively . Fig 8 depicts the co m bined output gener ated by the detector and the cla ssifier mo dules. A 1.77 se conds lo ng s egment of channel 1 audio samples are grabb ed from Audio 2 . Detections a nd r esolved c la sses a r e also shown. F rom the sna pshot o ne can observe the differen t intensities of the even ts. Generally the change in the ball’s moment happ ens whe n a rac quet or a front wall impacts a nd the s a mple amplitudes 9 F r o n t w a l l F l o o r R a c q u e t G l a ss C l a ss 0 . 7 0 . 8 0 . 9 1 . 0 Pe r fo r m a n c e c h 0 c h 0 c h 0 c h 0 c h 0 c h 0 c h 0 c h 0 c h 1 c h 1 c h 1 c h 1 c h 1 c h 1 c h 2 c h 2 c h 2 c h 2 c h 2 c h 2 c h 3 c h 3 c h 3 c h 3 c h 3 c h 3 c h 4 c h 4 c h 4 c h 4 c h 4 c h 4 c h 5 c h 5 c h 5 c h 5 Fig 5. The classi fiers’ accuracy . The classwis e accura cy of each channel is presented in T 1 (blue) and T 2 (red) input s e ts . F r ont wall cla ssification gives high accuracy on a ll channels in b oth sets. It is in teresting to observe that flo or classification is more a ccurate in input T 2 . Racquet c la ssification p e rforms b e s t on channel 2 in b oth sets. F r o n t w a l l F l o o r R a c q u e t G l a ss C l a ss 0 . 3 0 . 4 0 . 5 0 . 6 0 . 7 0 . 8 0 . 9 1 . 0 Pe r fo r m a n c e c h 0 c h 0 c h 0 c h 0 c h 0 c h 0 c h 0 c h 0 c h 1 c h 1 c h 1 c h 1 c h 1 c h 1 c h 2 c h 2 c h 2 c h 2 c h 2 c h 2 c h 3 c h 3 c h 3 c h 3 c h 3 c h 3 c h 4 c h 4 c h 4 c h 4 c h 4 c h 4 c h 5 c h 5 c h 5 c h 5 Fig 6. The classi fiers’ precisio n. T he cla sswise pr e cision o f each channel is presented in T 1 (blue) and T 2 (red) input s e ts . F r ont wall cla ssification gives high precision in input T 1 . The prec ision of flo o r class ification is low. Racquet classificatio n still per forms bes t on channel 2. The precisio n of glass classificatio n is only acceptable on channel 4. are higher, whereas flo o r and glass even ts tend to generate lower intensit y and a r e harder to detect. 10 F r o n t w a l l F l o o r R a c q u e t G l a ss C l a ss 0 . 4 0 . 5 0 . 6 0 . 7 0 . 8 0 . 9 1 . 0 Pe r fo r m a n c e c h 0 c h 0 c h 0 c h 0 c h 0 c h 0 c h 0 c h 0 c h 1 c h 1 c h 1 c h 1 c h 1 c h 1 c h 2 c h 2 c h 2 c h 2 c h 2 c h 2 c h 3 c h 3 c h 3 c h 3 c h 3 c h 3 c h 4 c h 4 c h 4 c h 4 c h 4 c h 4 c h 5 c h 5 c h 5 c h 5 Fig 7. The classi fiers’ recall. The classwis e recall of e a ch c hannel is pr esented in T 1 (blue) and T 2 (red) input s e ts . The p erformance of front wall cla ssification is reliable. The recall o f r acquet classification is hig h on channels 1 and 2 in b oth sets. How ever, the pe rformance o f floo r a nd gla ss class ifications is low. T able 5. The classwise preformance of the b e st classifi ers. Class Channel Input Acc Prec Rec F ront wall ch4 T 1 0 . 98 0 . 93 0 . 88 Racquet c h2 T 1 0 . 94 0 . 81 0 . 81 Flo or ch4 T 2 0 . 88 0 . 53 0 . 7 Glass ch0 T 2 0 . 88 0 . 63 0 . 5 4 0 . 4 4 0 . 6 4 0 . 8 4 1 . 0 4 1 . 2 4 1 . 4 4 1 . 6 4 1 . 8 4 2 . 0 4 2 . 2 T i m e [ s] 1 . 0 0 . 5 0 . 0 0 . 5 1 . 0 A m p l i tu d e G l a ss R a c q u e t F r o n t w a l l R a c q u e t F r o n t w a l l F l o o r Fig 8. Labe lled audi o sig nal. 1.77 seco nd long samples from channel ch1 in Audio 2 . Detected timestamps and the event cla sses are mar ked. 6.4 Lo calization Results Based on the geo metry of the court, the placement of the micr ophones and using the lo calization technique detailed in this study for each set of detection timestamps the 3-d p o sition o f the so urce of the even t can be e s timated. In case not all source channels provide a detection of the even t lo caliza tion is still p ossible. F our or more corres p o nding timestamps will yield a 3- d estimate, wher eas with three timestamps the lo c alization o f event s co nstrained on a surface (e.g. planes like wall or flo o r ) remains po ssible. In Fig 9 the lo cated even ts present in dataset Audio 1 a re s hown. In this measurement scenario the play er w as asked to hit different target areas on the fro nt 11 wall. It was a rapid exercise, a s the ball was shot back a t once. Only a few times the ball hit the floo r, mo st of the sound is c omp osed of alternating ra cquet a nd front wall even ts. In Fig 1 0 the front wall event s ar e shown. The targ et ar eas can b e se e n clear ly , and also it is visible the spo ts scatter a little mor e o n the left. The r e ason could b e the play er being right handed o r the fact the targ et area w as hit la ter dur ing the exp eriment and the player s how ed tir e dness. 0 1 2 3 4 5 6 7 0 2 4 6 8 1 0 0 1 2 3 4 5 Fig 9. The p osition of im pacts. Visualize the lo calized even ts embedded in 3-d. 0 1 2 3 4 5 6 7 0 1 2 3 4 5 Fig 10. F ron t w all impacts. Gray square s embrace the eight target areas. Measuring the er ror o f the lo calization metho d is not straight forward b eca use the ball hitting the main wall do es not leav e a ma rk, where the impact happ ened and there was no means to take pictures o f these even ts. T aking adv a nt age o f the geo metry of the front wall a n erro r metric can be defined for fr ont wall events. The erro r δ is defined by the offset of the approximated lo cation from the plane of the front wall. In Fig 1 1 the err or histog ram is shown. The mean o f δ should v anish and the smaller its v ariance the b etter the framework lo ca ted the even ts. F rom this exe rcise one ca n rea d the standard devia tion is σ ( δ ) < 3 c m, which is s maller then the size of the squash ball. Another wa y to define the erro r is based on relying on human rea dings o f the even ts. In the dataset Audio 1 all of the sound even ts were ma rked by h uman as well 12 − 0 . 0 5 − 0 . 0 4 − 0 . 0 3 − 0 . 0 2 − 0 . 0 1 0 . 0 0 0 . 0 1 0 . 0 2 0 . 0 3 O ff se t fr o m th e p l a n e δ [ m ] 0 2 4 6 8 1 0 1 2 1 4 1 6 C o u n t Fig 11. The front w all offsets. The distribution of the o ffset δ from the front wall ( σ ( δ ) ≈ 0 . 02 m). as by the detector algo rithm. Loca lizing the events using b oth inputs the direct po sition differenc e c a n b e inv estigated. The mean difference b etw e en the p o sitions is 11.8 cm and their standar d deviation is 39.9 c m. 7 Discussion Our results s uppo rt that in sp or ts, wher e the relev ant sound patterns are distinguishable, careful signal pro cessing a llows the lo ca lisation of sho ts . The describ ed s ystem is o ptimized for ha ndling even ts and as a consequences the r eal-time analysis o f data is p ossible, which is imp ortant to give an insta nt feedback. The framework can be extended to provide higher level statistics of events such as the evolution of sho ts types. F rom the wide ra nge of p ossible applications we highlight three use c a ses. Firstly , during a ma tch the play ers can g et to know their precisio n in short time and if is necessar y they can change their stra teg y . Secondly , during practice coaches can tra ck the de velopment of the play ers hit accura cy . Or thirdly , certain exercises can b e defined, which can b e automatically and ob jectively ev aluated, without the nee d for the coach b e present during the ex ercise. 8 Related w ork Squash a nd so ccer were the firs t sp orts to b e analysed b y ways of ana ly sis systems. F ormal scientific supp or t for squash emerged a t the late 1960 s. T he cur rent applications of p er fo rmance analysis techniques in squa sh a r e deeply inv e s tigated in the bo o k o f Sta ffor d et al. [11]. One test that was develop ed by squas h coa ch Geoffry Hunt is the “Hun t Squash Accuracy T est” (HSA T) [12], tha t is a r eliable metho d use d by coa ches to assess shot hitting accuracy . The test is comp osed of 375 sho ts acr oss 1 3 different types of squas h strokes and it is ev aluated ba sed on a total sc o re expr e ssed as the num be r of s ucc essful shots. 13 Recent technological adv ances hav e facilitated the development o f spo rt a nalytical softw ar e such as Da r tfish video ba sed mo tio n ana lysis s ystem [1 3, 14]. How ever, thes e systems still r equire a c o nsiderable a mount o f professional ass istance. T o the bes t of o ur knowledge ther e is no previous rese arch inv es tigating the applicability of sound a nalysis techniques for squash p erfor mance a nalysis. Ac kno wledgemen ts The hardware co mpo nents e na bling this study a re ins ta lled at Gold Center’s squas h court. W e thank them for this o pp o rtunity and squash coa ch Sha keel Kha n for the fruitful discussions. W e thank the supp ort of SmartActive pro ject run by Ericsso n Hungary Resear ch and Development Center. References 1. Bro adb ent DP , F ord P R, O’Har a DA, Williams AM, Causer J. The effect o f a sequential structure of pra ctice for the training of per ceptual-cog nitive skills in tennis. PLOS ONE . 2017;1 2(3):1–1 4 . do i:10.13 7 1/journa l.p o ne.017431 1. 2. W elfo r d BP . Note o n a Metho d for Calculating Corrected Sums of Squa res and Pro ducts. T echnometrics. 196 2;4(3):41 9–420 . 3. Bor is S, Stiefelhagen R. “W ow!” Ba yesian surpr ise for salie nt aco us tic even t detection. 2013 IE EE International Conference on Acoustics , Sp eech and Signal Pro cess ing. 2013;. 4. Kullba ck S, Leibler RA. On Information and Sufficiency . The Annals o f Mathematical Statistics. 1 9 51;22 (1):79–86 . 5. Hinton G, et al. Deep neural netw orks for acous tic mo deling in sp eech recognition: The shared views of four resear ch gr oups. IEEE Signal Pro ces sing Magazine. 2 012;2 9 .6:82– 97. 6. Buga tti A, Flammini A, Migliorati P . Audio classification in s pe e ch a nd m usic: a co mparison b etw een a statistical and a neural approach. EURASIP Journa l on Adv ance s in Signal Pro ce ssing. 20 02;200 2(4):1–7 . 7. Shao X, Xu C, Ka nk anhalli MS. Applying neural netw ork o n the conten t-based audio classification. In: Information, Co mmu nications and Signa l Pr o cessing, 2003 and F ourth Pacific Rim Conference on Multimedia. Pro ceedings of the 2003 Jo int Conference of the F our th International Co nference on. vol. 3. IEEE ; 2003. p. 182 1–18 25. 8. W a ng Y, Lee CM, Kim DG, Xu Y. So und- q uality prediction fo r nonsta tionary vehicle interior noise based on wav elet pre-pro ces sing neural net work mo del. Journal of So und and Vibra tio n. 2007;2 99(4):93 3 –947. 9. Chawla NV, Bowy er KW, Hall LO , Keg elmeyer WP . SMOTE: synthetic minority ov er -sampling tec hnique. Journal of artificial in telligence r esearch. 2002;1 6:321 –357. 10. Arlo t S, Celisse A, et al. A sur vey o f cr oss-v alida tion pro cedures for mo del selection. Statistics surveys. 2010 ;4:40–7 9. 14 11. O BE NM. Current applicatio ns of p erformance analy s is techniques in squash. Science o f Sp or t: Squash. 2 016;. 12. Williams BK, Hunt GB, Graham-Smith P , Bour don PC. Measuring squas h hitting accuracy using the ‘Hunt squas h accura cy test’. In: ISBS-Confer ence Pro ceeding s Archive; 2 014. 13. Ba rris S, Button C. A review of vis ion-based mo tio n analysis in sp o r t. Spor ts Medicine. 2008;3 8(12):10 25–1043. 14. T rav a ssos B, Da vids K , Ara ´ ujo D, Esteves PT. Performance a na lysis in team sp orts: Adv ances from an E cologica l Dyna mics appr oach. International Jo urnal of Performance Analysis in Sp ort. 201 3;13(1):8 3–95. 15
Original Paper
Loading high-quality paper...
Comments & Academic Discussion
Loading comments...
Leave a Comment