A Design Space Exploration (DSE) on Non-Invasive Sensing of Bladder Filling Using Near Infrared Spectroscopy (NIRS)
Urinary Incontinence (UI) is a widespread medical condition that affects one person from every three or four Americans. Near-Infrared Spectroscopy (NIRS) is a non-invasive under-study method for bladder filling sensation that can enhance the life qua…
Authors: Mahya Saffarpour, Soheil Ghiasi
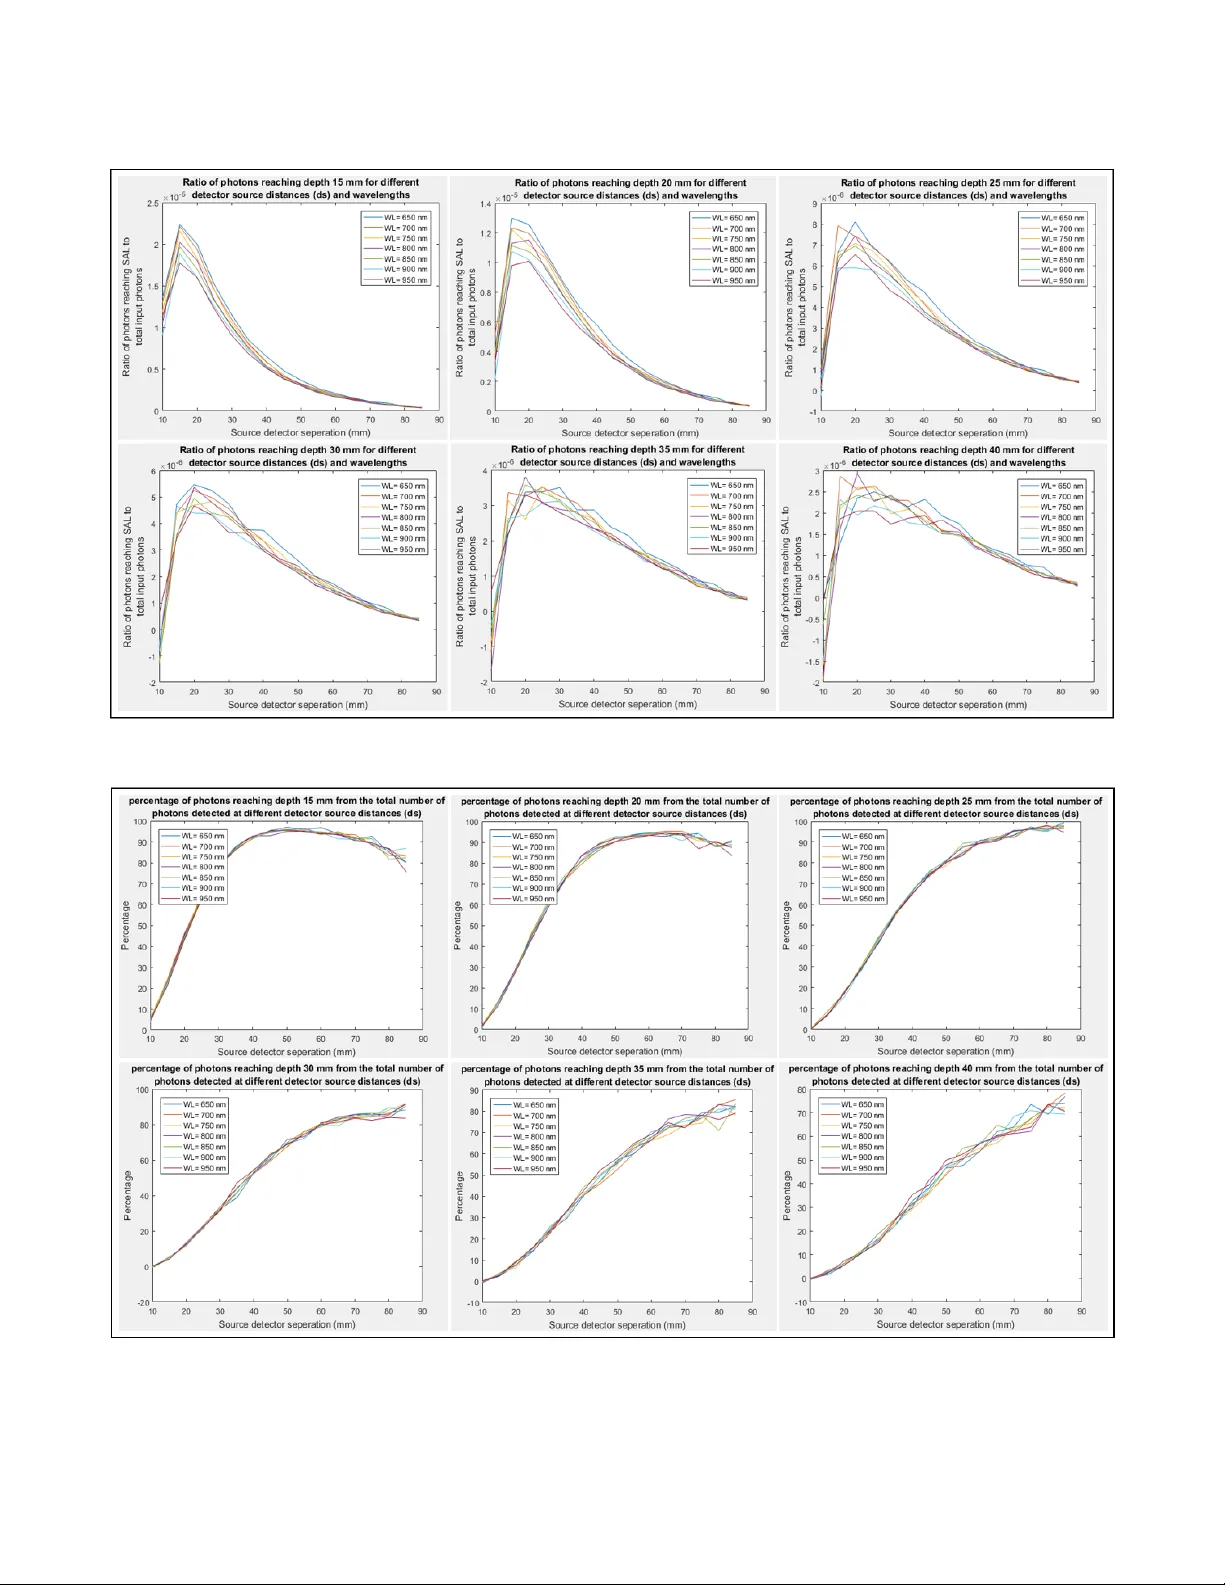
A Design Space Exploration (DSE) on Non-Invasive Sensing of Bladder Filling Using Near Infrared Spectroscopy (NIRS) M. Saarpour msa@ucdavis.edu S. Ghiasi ghiasi@ucdavis.edu ABSTRA CT Urinary Incontinence (UI) is a widespread medical condition that af- fects one person from every three or four Americans. Near-Infrared Spectroscopy (NIRS) is a non-invasive under-study method for blad- der lling sensation that can enhance the life quality of UI patients by nding the optimal voiding time. Howev er , the application of NIRS to bladder volume sensing can be quite challenging due to three major obstacles: non-adequate traversal depth of NIR wave- lengths, robustness and p ower eciency requirements of the appli- cation, and low power transmission rate of NIR wavelengths. is work provides a Design Space Exploration (DSE) through the ee ct of various design parameters on NIRS applicability for bladder vol- ume sensing. W e investigate the impact of 7 dierent wavelengths from 650-950 nm, 16 possible detector-source distances, and 6 dif- ferent sensation depths. e results of our work can b e use d as a guideline through optimal design and implementation of NIRS for bladder lling sensation. KEY W ORDS UI, NIRS, non-invasive, DSE 1 IN TRODUCTION NIRS can be a promising method for non-invasive bladder moni- toring of patients with UI symptoms. e loss of bladder control, known as UI, is a world-wide prevalent me dical condition that af- fects 25-33% of Americans [ 6 ]. NIRS te chnique is projecte d to be a useful tool for sensing the bladder lling which can help in nding the optimal voiding time in short-term, while providing valuable information for the long-term treatment process. Although NIRS technique has been teste d for bladder volume sensing in some clinical trials [ 2 ][ 1 ][ 3 ], its applicability for practical usage faces several challenges. First of all, we show that due to high absorption and scaering characteristics of tissue layers in ab dominal area for NIR wave- lengths, the traversal depth may not b e adequate to sense the blad- der . is problem becomes more challenging when bladder depth is higher as a result of patient’s ob esity . Secondly , robustness and power eciency of the nal probe is a requisite. is device should not b e sensitive to misplacements and small movements during usage and should be low p ower in order to b e powered by baer y in a daily basis. On the other hand, the intensity of detected photons should be high enough to provide a reasonable power range to the detection module. Since the input p ower is limite d by system’s power budget, providing the minimum sensational power for dete ction module can be an obstacle. erefore, the optimal wavelength should b e able to maximize the power transmission ratio from input to output, and as a result, minimize the absorption and scaering power losses in the transmission process. ese challenges necessitate the need for a comprehensive de- sign space exploration (DSE) to evaluate the ee ct of parameters such as wavelength and source-detector distances on penetration depth, sensitivity , and power transmission ratio. In this work, we employed monte carlo simulation to p erform the aforementioned DSE while considering following parameters: • 7 wavelengths in range of 650-950 nm • 16 p ossible detector-source spacings • 6 dierent tissue thicknesses in range of 15-40 mm In what follows, rst the power transmission ratio calculation has been explained (section 2). en, section 3 and 4 cover the sim- ulation setup and the results of this project, consecutively . Finally , Section 5 is de dicated to conclusion of this work. 2 PO WER TRANSMISSION RA TIO e p ower transmission ratio is the ratio of dete cted photons power to the input photons’ power . In this work, we assume that the detection of all photons happen at the same time. As a result, the power transmission ratio would be equal to energy transmission ratio. e energy of N photons with wavelength λ can be calculated by e quation 1 where h and c are the Plank constant and speed of light, conse cutively . E = N ∗ hc λ (1) erefore, the overall energy transmission ratio would be equal to the numb er of detected photons to the numb er of input photons. 3 SIMULA TION SET UP W e have use d Monte Carlo Extreme simulator in order to quantify the ee ct of wavelength and source-detector spacing on traversal depth. In order to get track of photons’ traversal depth in the simula- tion, we have compared the number of detected photons with and without a super-absorb ent layer (SAL) at the depth of interest. SAL has signicantly high absorption and zero scaering characteris- tic which would swallow and absorb photons reaching its surface. e de creased number of detected photons, as a result of applying SAL, indicates the numb er of photons reaching the SAL depth. e simulation mo del has b een presented in gure 1. W e utilized Monte Carlo simulation with 500 million input pho- tons at 7 dierent NIR wavelengths in range of 650nm to 950nm. e optical properties of tissue layers used in this model has been adopted from [5]. For all the wavelengths under study , we have swept the SAL from 10 mm to 40 mm with a step-size of 5 mm and colle cted the Figure 1: e simulation model which is capable of perform- ing p enetration depth analysis by using a sweeping SAL. penetration depth information. e simulation contains 16 dete c- tors which are placed every 5 mm in range of 10-85 mm distance to light source. All these 16 detectors have the similar radius of 1.41 mm. Finally , the power transmission ratio has been calculated p er wavelength for each source-detector distance using equation 1 and number of detected photons at each detector . en we back- calculated the minimum input power required for receiving the minimum sensible output power (detector characteristics provided in [4]) considering these transmission ratio values. 4 RESULTS AND DISCUSSION Figure 2 and 3 illustrate the source detector distance and wave- length eect on penetration depth. Figure 2 focuses on the ratio of photons reaching the depth of interest to the overall numb er of input photons. On the other hand, gure 3 provides a measure of sensitivity by presenting the p ercentage of dete cted photons which are reaching the depth of interest to overall detected photons at the same dete ctor . e comparison of gure 2 and gure 3 oers a beer under- standing of optimal source-detector spacing. Although a higher number of photons can be detecte d at low spacings, a stronger signal to noise ratio is achievable using higher separation distances. W e present the minimum sensible output power and the resulted minimum input p ower in gure 4. 5 CONCLUSION In this work we p erforme d DSE to analyze the eect of parameters such as wavelength and source-detector spacing on the penetration depth of NIR photons for a bladder volume spectroscopy application. W e used monte carlo simulation using 7 dierent wavelengths and 16 p ossible source-detector spacings for 6 penetration depths. W e have also illustrated the minimum input p ower for a sp ecic choice of detector at these wavelengths and spacings. e results of our simulation can be used to direct the optimal design and implementation of a NIRS probe for bladder lling sensation. REFERENCES [1] Macnab, Andrew J. ”e evolution of near infrared spectroscopy in urology . ” Biomedical Spectroscopy and Imaging 3.4 (2014): 311-344. [2] Macnab, A. J., R. E. Gagnon, and L. Stothers. ”Clinical NIRS of the urinary bladderA demonstration case report. ” Journal of Spectroscopy 19.4 (2005): 207-212. [3] Molavi, Behnam, et al. ”Noninvasive optical monitoring of bladder lling to capacity using a wireless Near Infrared Spectroscopy device. ” IEEE transactions on biomedical circuits and systems 8.3 (2014): 325-333. [4] FairChild. ”QSB34GR / QSB34ZR / QSB34CGR / QSB34CZR Surface-Mount Sili- con Pin Photo diode. ” QSB34GR / QSB34ZR / QSB34CGR / QSB34CZR datasheet, Sep. 2016. [5] Simpson, C. Rebecca, et al. ”Near-infrared optical properties of ex vivo human skin and subcutaneous tissues measured using the Monte Carlo inversion tech- nique. ” P hysics in Medicine & Biology 43.9 (1998): 2465. [6] Urology care foundation. ”What is Urinar y Incontinence?” , hp://www.ur ologyhealth.org/urologic-conditions/urinary- incontinence/printable-version. Accessed 23 June. 2018. 2 Figure 2: e ratio of photons reaching depth of interest to overall number of input photons at each source-detector distance. Figure 3: e percentage of photons reaching depth of interest from the total number of photons detected at each detector 3 Figure 4: Minimum input power calculation using mini- mum sensible output power and power transmission ratio. 4
Original Paper
Loading high-quality paper...
Comments & Academic Discussion
Loading comments...
Leave a Comment