Robust Feature Clustering for Unsupervised Speech Activity Detection
In certain applications such as zero-resource speech processing or very-low resource speech-language systems, it might not be feasible to collect speech activity detection (SAD) annotations. However, the state-of-the-art supervised SAD techniques bas…
Authors: Harishch, ra Dubey, Abhijeet Sangwan
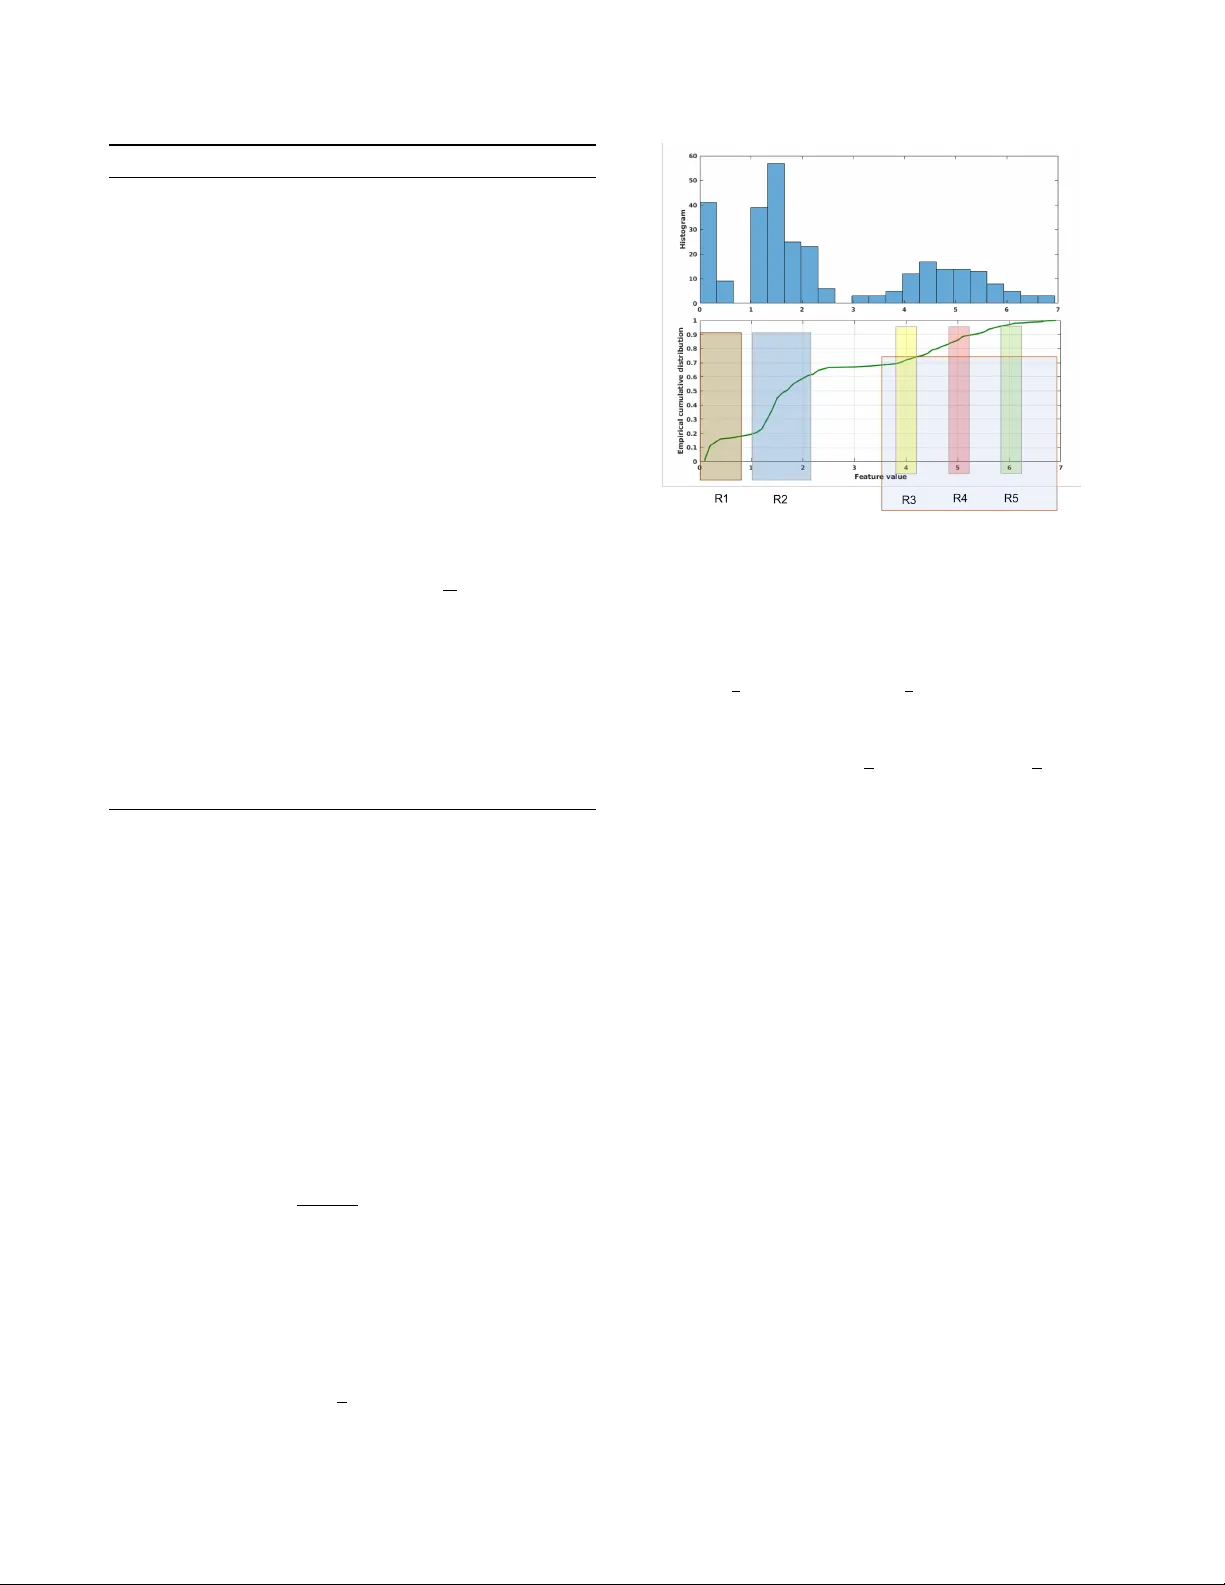
R OBUST FEA TURE CLUSTERING FOR UNSUPER VISED SPEECH A CTIVITY DETECTION Harishchandr a Dube y , Abhijeet Sangwan, J ohn H. L. Hansen + Robust Speech T echnologies Lab, Center for Robust Speech Systems The Uni versity of T exas at Dallas, Richardson, TX 75080, USA {Harishchandra.Dubey, Abhijeet.Sangwan, John.Hansen}@utdallas.edu ABSTRA CT In certain applications such as zero-resource speech process- ing or very-lo w resource speech-language systems, it might not be feasible to collect speech activity detection (SAD) an- notations. Howe ver , the state-of-the-art supervised SAD tech- niques based on neural networks or other machine learning methods require annotated training data matched to the tar get domain. This paper establish a clustering approach for fully unsupervised SAD useful for cases where SAD annotations are not av ailable. The proposed approach lev erages Harti- gan dip test in a recursive strategy for segmenting the fea- ture space into prominent modes. Statistical dip is in variant to distortions that lends rob ustness to the proposed method. W e evaluate the method on NIST OpenSAD 2015 and NIST OpenSA T 2017 public safety communications data. The re- sults showed the superiority of proposed approach over the two-component GMM baseline. Index T erms : Clustering, Hartigan dip test, NIST OpenSAD, NIST OpenSA T , speech acti vity detection, zero-resource speech processing, unsupervised learning. 1. INTR ODUCTION Speech activity detection (SAD) is an essential front-end in most speech systems such as automatic speech recognition, speaker verification etc [1]. SAD methods are broadly con- sidered into two categories: (1) supervised and (2) unsuper- vised. While supervised approaches are trained on massiv e amount of annotated data, unsupervised techniques do not re- quire labeled data [2]. Supervised techniques tend to perform poorly on mis-matched train and test conditions. Gaussian mixture models (GMMs) have been extensiv ely used for su- pervised, semi-supervised and unsupervised SAD [1, 3, 4]. Robust SAD o ver degraded channels ha ve been of interest for + This project was funded in part by AFRL under contract F A8750-15- 1-0205 and partially by the University of T exas at Dallas from the Distin- guished University Chair in T elecommunications Engineering held by J. H. L. Hansen. This material is presented to ensure timely dissemination of scholarly and technical work. Copyright and all rights therein are retained by the au- thors or by the respectiv e copyright holders. The original citation of this paper is: H. Dubey , A. Sangwan, and J. H. L. Hansen, "Robust feature clus- tering for unsupervised speech acti vity detection,"in IEEE ICASSP , 2018, pp. 2726-2730. sev eral years [5, 6, 7, 8, 9, 10, 11]. SAD methods are varied, from energy-based [2] to deep neural networks (DNN) [7]. The D ARP A RA TS program supported the SAD research in multiple phases that led to the dev elopment of advanced ap- proaches [12, 13, 14, 15, 16, 17]. Recent work in [1] summa- rized the SAD de velopments in context of semi-supervised and unsupervised techniques. Specifically , it introduced the idea of semi-supervised learning in con ventional expectation- maximization (EM) algorithm for semi-supervised GMM for speech activity detection. 2. PR OPOSED METHOD 2.1. Featur e Extraction The handcrafted fi ve-dimensional features for Combo-SAD approach were introduced in [3]. Authors performed mean and variance normalization on each feature dimension. The normalized features were later processed with principal com- ponent analysis (PCA) for extracting the first principal com- ponent that was named Combo feature. The Combo features were later employed to consider a two-component GMM for unsupervised SAD [3]. W e used the two-component GMM as baseline decision backend for comparison with proposed Dip-based unsupervised backend in this study . 2.2. Hartigan dip test The dip test [19] is a statistical test for hypothesizing the modality of a distribution. It is based on the geometrical shape of the feature distribution. The dip test tries to fit a piece- wise linear function, that is con vex then a concav e, to the cu- mulativ e distribution. The unimodality is decided based on the goodness of this piecewise linear fit [18]. W e le veraged recursions based on dip test for clustering feature space into speech and non-speech classes. This paper is moti vated by the recent success in applying Hartigan test for clustering ex- tremely noisy data from other domains [20]. Application to speech processing, particularly speech activity detection is a nov el contribution of this paper . By comparing the dip statis- tics with that of a suitable reference unimodal distrib ution (i.e., null distrib ution), a p-value is set for the null hypoth- esis. Using the significance le vel, α = 0 . 05 , we may reject or fa vor the null hypothesis (unimodality) against the alternativ e Algorithm 1 computeDip Input: speech features were sorted in ascending order i.e., o =[ o 1 , o 2 , ..., o N ] where o 1 ≤ o 2 ≤ ... ≤ o N . Output: primary modal interval [ o L , o U ], DIP and p-value, p . Step 1: Initialize, lower point o L = o 1 , upper point o U = o N and D = 0. Step 2: Compute greatest con vex minorant G and least concav e majorant H of empirical distrib ution F of fea- tures in interv al [ o L , o U ] [18]. Let the points of con- tact with F are respecti vely , g 1 , g 2 , .., g k (for G ) and h 1 , h 2 , .., h m (for H ). Step 3: Let d = max | G ( g i ) - H ( g i ) | > max | G ( h j ) - H ( h j ) | and the maximum occurs at h j ≤ g i ≤ h j +1 . Then, define o 0 L = g i , o 0 U = h j +1 . Step 4: Let d = max | G ( h j ) - H ( h j ) | ≥ max | G ( g i ) - H ( g i ) | and the maximum occurs at g i ≤ h j ≤ g i +1 . Then, define o 0 L = g i , o 0 U = h j . Step 5: If d ≤ D , Stop and set DIP= D 2 . Step 6: If d > D , set D= max { sup o L ≤ o ≤ o 0 L | G ( o ) − F ( o ) | , sup o U ≤ o ≤ o 0 U | H ( o ) − F ( o ) | }, where sup is the supremum (supremum is the smallest number that is greater than or equal to every number in the set). Step 7: Set o L = o 0 L , o U = o 0 U . Go to Step 2. hypothesis (multi-modality). In this way , the dip test quan- tifies the empirical cumulative distribution’ s departure from unimodality . Importantly , the dip test (see Algorithm 1 com- puteDip ) communicates the modal interval [ o L , o U ], the p- value and the DIP . It is important to note that the proposed clustering approach works on all frames of a single utterance thus it a utterance-level approach. The speech feature vector , feats are sorted in increasing order . W e still store the original feature v ector in memory for preserving the temporal order (time information) of the frames. Let the sorted features (ob- servations) be o = o 1 , o 2 ,..., o N with o 1 ≤ o 2 ≤ ... ≤ o N where N is the length of the feature vector (number of frames). All speech and non-speech modal interv als, ( o i , o j ) in the feature space would be the pairs of values from o . If N is the length of feats or equi valently o , total number of possible modal in- tervals would be N 2 = N ( N − 1) 2 that is combinations obtained by choosing two values out of o vector . Now , for each modal interval ( o i , o j ) we compute the greatest con vex minorant, G of empirical distribution, F in (- ∞ , o i ) and least conca ve ma- jorant, H of empirical distrib ution, F in ( o j , ∞ ). Let d ij be the maximum distance between F and curves G , H in modal interval ( o i , o j ). Then, the DIP is given as DIP = 1 2 min { d ij } , (1) Fig. 1 . Illustration of the dip-based clustering technique on synthetic data with fiv e classes, identified with R1 to R5 where three regions R3, R4 and R5 lie close to each other in the feature space. ov er all modal interval ( o i , o j ) such that the line se gment from [ o i , F ( o i ) + 1 2 d ij ] to [ o j , F ( o j ) − 1 2 d ij ] lies in the set defined by { o, y | o i ≤ o ≤ o j , F ( o ) − 1 2 d ij ≤ y ≤ F ( o ) + 1 2 d ij } (2) The Equation 2 ensures that the greatest con vex minorant, modal segment and the least conca ve majorant together form a unimodal distribution. The Algorithm 1 computeDip com- pute the DIP value, the modal interv al and the p-value, p from the significance test. 2.3. Dip-based clustering W e used the dip test recursively to locate the modal intervals that could contain speech or non-speech frames. W e explain the proposed clustering approach by looking at Figure 1 and going through the Algorithm 2 Dip-SAD . Figure 1 illustrates a simulated scenario sho wing fiv e categories in the feature space. The top sub-figure shows the histogram of features, while the bottom one sho ws empirical cumulative distribu- tion. Clearly , the region R3, R4 and R5 lie close to each other in the feature space. On applying the clustering ap- proach described in Algorithm 2 Dip-SAD , the first modal interval detected consisted of R3, R4 and R5 (Step 3 in Dip- SAD ). On recursing again in this interval for each o j such that o L ≤ o j ≤ o U , we get all the three regions R3, R4 and R5 that forms I mid i.e., middle modal interv als (Step 4). Next, we recurse into the right and left side of the primary interval to find if other segments were present (Step 5). While re- cursing to the left and right, we included the nearest detected modes from respectiv e left or right region, i.e., for left recur- sion, region R3 in included in the search region while for right recursion, region R5 is included in the search re gion (Step 6). Algorithm 2 Dip-SAD Input: frame-level speech features from an utterance Output: speech non-speech labels for each frame Step 1: Sort the features in ascending order and let o =[ o 1 , o 2 , ..., o N ] be the ordered vector , where o 1 ≤ o 2 ≤ ... ≤ o N . The significance lev el, α is set to 0.05 for all experi- ments reported in this paper . Step 2: { o L , o U , p } ← computeDip ( o ) Step 3: If p > α , then the detected primary modal interval is [ o L , o U ]. Else, [ o 1 , o N ] is primary modal interval. Step 4: Recurse into the modal interval to find the list I mid of the modal intervals within detected primary mode. Step 5: No w , we check to the right and left of the primary modal interv al recursiv ely and extract additional modes if found. Step 6: { u } ← min o U ∈ I mid ( o U ) , { l } ← max o L ∈ I mid ( o L ) . Step 7: p l ← computeDip ( ∀ o j : o j ≤ u ) , p u ← computeDip ( ∀ o j : o j ≥ l ) . Step 8: I l ← If p l ≤ α , then ∀ o j : o j < o l forms a multi- mode segment. W e recurse into this interval and return all found modal intervals. Else return φ i.e., an empty set. Step 9: I r ← If p u ≤ α , then ∀ o j : o j > o u forms a multi-mode segment. W e recurse into this interval and return all found modal intervals. Else return φ i.e., an empty set. Step 10: The final set of all modal interval is I l S I mid S I r . Step 11: As we kne w that combo-SAD features ha ve high positive value for speech and low value for dif fer- ent noises, the cluster with highest av erage feature value is taken as speech and rest clusters as non-speech. In some instances, where two prominent noise sources were present such as non-stationary background noise and oc- casional tonal impulsi ve noise, this approach led to three or more clusters. Thus, upper limit ( u ) for left search is minimum among all detected upper limits, i.e., upper limit of region R3. On the other hand, lower limit ( l ) for right search is chosen as max- imum among all lower limits in detected regions, i.e., lower limit of R5 (Step 6). This strategy ensures that the left and right searches will either hav e unimodal (means same region extended in that direction such as R5 here extends till the end of the right region) or have multi-modalities (means dif ferent modes in that direction such as R1 and R2 in left). This is done in Step 6 of the Algorithm 2 Dip-SAD . After we have upper limit, u and lower limit, l for left and right searches re- spectiv ely , we iterate using Algorithm 1 computeDip on both regions to get the corresponding p-values, p l and p u (Step 7). From the corresponding p-v alues of such recursions, we conclude unimodality if p l > α and return empty set φ . If p l ≤ α , we find the corresponding modal interv al and add it to set I l that is set of modal intervals for left region (Step 8). Similarly , we do for right search (Step 9) to get set I r that is set of modal intervals for the right region. The final set of all modal interv als is the union of middle set I mid , left set I l and right set I r . The Figure 1 w as for illustration of the dip-based clustering approach. For speech activity detection (SAD), at the end of recursive dip tests on detected primary modal in- terval, left region and right region, we usually get just two, three or four clusters. W e found that when there are more than one type of noise in an utterance such as non-stationary background noise, occasional impulsiv e noise etc then each non-speech re gion with a specific noise-type got clustered separately . From [3], we know that the Combo features are relativ ely lar ge positi ve v alues for speech and v ery small pos- itiv e or negati ve values for noise. W e leverage this fact in assigning clusters to speech or non-speech class. The clus- ter with highest a verage sample v alue was assigned to speech and rest clusters corresponded to non-speech. This assign- ment was done automatically on the basis of average feature value for each detected cluster . Authors in [17] also noticed that the Combo features for OpenSAD data were significantly tri-modal on some channels and tri-modal GMM helped in gaining improv ements in DCF (Section 6.4.1) [17]. 3. RESUL TS & DISCUSSIONS W e used 40ms windows with a 10ms skip-rate for extracting the Combo features from each utterance. The sampling rate for processing the speech data was kept at 8kHz. The NIST OpenSAD 2015 program was organized to advance the state- of-the-art SAD o ver extremely degraded communication channels [21]. Six channels namely B, D, E, F , G and H from the DARP A RA TS were included in the training set along with the source channel. This data consisted of re-transmitted telephone con versations captured through different communi- cation channels. This data was provided at 16 kHz sampling rate with 16 bit resolution. W e do wnsample the OpenSAD data to 8 kHz for feature extraction and further processing. In this study , we ev aluate all channels of the training set as techniques being ev aluated are fully unsupervised and parameter-free. Recently , NIST or ganized speech analytic technologies ev aluation NIST OpenSAT 2017 [22]. It had three tasks: SAD, key word search, and automatic speech recognition. W e e val- uated the proposed SAD approach for OpenSA T public safety communications (PSC) data. It contained audio recordings from sofa super store fire (SSSF) dispatcher that occurred on June 18, 2007 in Charleston, South Carolina. The data con- stitute real fire-response operational data that can not be du- plicated through controlled scientific collection [22]. Thus, the data is rich in naturalistic distortions such as (i) land mo- bile radio transmission ef fects; (ii) speech under cogniti ve and physical stress; (iii) v arying background noise types and lev- els etc [22]. The data consisted of six audio recordings, each of approximately fi ve minute duration, thus making up a total T able 1 . DCF (%) with two-second collar on all channels of Lev antine Arabic (alv) in training set of NIST OpenSAD-2015 data. The scores were averaged o ver all audio files. System alv − B alv − D alv − E alv − F alv − G alv − H alv − src Combo-SAD 8.54 7.21 6.09 5.60 1.51 6.07 3.02 Proposed 13.21 6.40 5.83 4.19 1.34 3.63 2.68 Relativ e Improv ement (%) -54.68 11.23 4.27 25.18 11.26 40.20 11.26 T able 2 . DCF (%) with two-second collar on all channels of American English (eng) in training set of NIST OpenSAD-2015 data. System eng − B eng − D eng − E eng − F eng − G eng − H eng − src Combo-SAD 9.65 10.32 6.44 5.83 8.18 5.66 4.18 Proposed 10.68 8.18 5.12 2.96 9.30 4.11 6.87 Relativ e Improv ement (%) -10.67 20.74 20.50 49.23 -13.69 27.38 -64.35 T able 3 . DCF (%) with two-second collar on all channels of Urdu (urd) in training set of NIST OpenSAD 2015 data. System urd − B urd − D urd − E urd − F urd − G urd − H urd − src Combo-SAD 7.63 6.98 5.69 5.76 3.73 5.62 3.48 Proposed 5.85 5.51 5.30 5.26 3.67 4.78 4.22 Relativ e Improv ement (%) 23.33 21.06 6.85 8.68 1.61 14.95 -21.26 of 30 minutes of dev data. The data were provided as 16- bit signed integer PCM at 8 kHz sampling rate. The dev set was shipped with the ground-truth SAD reference labels for ev aluation. The e valuation metric used in NIST OpenSAD-2015 and NIST OpenSA T -2017 was the detection cost function (DCF) giv en by: D C F = 0 . 25 ∗ P f a + 0 . 75 ∗ P miss (3) where P f a is the false alarm rate (non-speech frames detected as speech) and P miss is the miss rate (speech frames detected as non-speech). The DCF values were computed for each au- dio file and av eraged to get the DCF for each channel ov er three languages in NIST OpenSAD. W e incorporated the two- second collar around each speech region in accordance with the NIST OpenSAD 2015 protocol. T able 1, T able 2 and T able 3 shows the comparison of results obtained with the proposed technique using a significance lev el, α = 0 . 05 and Combo-SAD baseline. The baseline Combo-SAD approach had Combo features considered for fitting a two-component GMM. W e chose 0.5 weights for both speech and non-speech GMM during threshold selection in baseline [3]. Fixing the weights made the approach parameter-free. Clearly , we can see that the proposed approach led to significant relativ e gains in DCF as compared to the baseline Combo-SAD except for alv-B, eng-B, eng-G, eng-src, urd-src channels. The Combo- SAD baseline is a model-based technique and it performs well when Combo features are bi-modal. On channels where Combo-SAD is better than the proposed Dip-SAD approach, we found that Combo feature were distinctly bi-modal for ma- jority of the utterances. Overall, we found that the Dip-SAD T able 4 . DCF with no collar on all audio recording in PSC SSSF dev set from NIST OpenSA T 2017. Audio GMM Proposed Relativ e name (%) (%) Improv ement(%) sssf_dev_001 10.04 8.76 12.75 sssf_dev_002 9.25 11.03 -19.24 sssf_dev_003 6.20 5.67 8.55 sssf_dev_004 4.39 4.57 -4.10 sssf_dev_005 6.58 5.13 22.04 sssf_dev_006 8.29 7.88 4.95 Overall 7.46 7.17 3.89 had reasonable DCF gains ov er Combo-SAD on man y chan- nels. The poor performance of Dip-SAD on some channels is possibly due to ov er-clustering of speech into two clusters. In future, we would consider semi-supervised cluster assign- ments for such cases. T able 4 sho ws the DCF with no collar for all audio recordings in NIST OpenSA T PSC SSSF dev set. W e can see that the proposed Dip-SAD approach has ov erall 3.89% relativ e improvement in DCF as compared to GMM baseline with same features. 4. CONCLUSIONS This study lev erages Hartigan dip test for unsupervised speech activity detection for scenarios that lack annotations. W e used Combo features in proposed clustering approach as these were found to perform well on extremely noisy D ARP A RA TS data. The proposed approach is deterministic and parameter-free. Results on NIST OpenSAD-2015 data sho ws proposed approach to be significantly better than the baseline on many channels from three languages. The ov erall relati ve improv ement in DCF was 3.89% for NIST OpenSA T . 5. REFERENCES [1] A. Sholokhov , M. Sahidullah, and T . Kinnunen, “Semi- supervised speech activi ty detection with an application to automatic speaker verification, ” Computer Speech & Language , v ol. 47, pp. 132–156, 2018. [2] J. Sohn, N. S. Kim, and W . Sung, “ A statistical model- based voice acti vity detection, ” IEEE Signal Pr ocessing Letters , v ol. 6, no. 1, pp. 1–3, 1999. [3] S. O. Sadjadi and J. H. L. Hansen, “Unsupervised speech acti vity detection using voicing measures and perceptual spectral flux, ” IEEE Signal Processing Let- ters , v ol. 20, no. 3, pp. 197–200, 2013. [4] H. Dubey , A. Sangwan, and J. H. L. Hansen, “ A rob ust diarization system for measuring dominance in peer-l ed team learning groups, ” in IEEE Spoken Language T ech- nology W orkshop (SLT) , 2016, pp. 319–323. [5] J. Ramırez, J. C. Segura, C. Benıtez, A. De La T orre, and A. Rubio, “Ef ficient voice activity detection algorithms using long-term speech information, ” Speech communi- cation , vol. 42, no. 3, pp. 271–287, 2004. [6] J. Ramírez, J. C. Segura, C. Benítez, L. García, and A. Rubio, “Statistical voice activity detection using a multiple observ ation likelihood ratio test, ” IEEE Signal Pr ocessing Letters , vol. 12, no. 10, pp. 689–692, 2005. [7] X.-L. Zhang and J. W u, “Deep belief networks based voice activity detection, ” IEEE T rans. on A udio, Speech, and Language Pr ocessing , vol. 21, no. 4, pp. 697–710, 2013. [8] P . Ghosh, A. Tsiartas, and S. Narayanan, “Robust voice activity detection using long-term signal variability , ” IEEE T rans. on Audio, Speech, and Languag e Pr ocess- ing , vol. 19, no. 3, pp. 600–613, 2011. [9] J. W . Shin, J.-H. Chang, and N. S. Kim, “V oice activ- ity detection based on statistical models and machine learning approaches, ” Computer Speech & Language , vol. 24, no. 3, pp. 515–530, 2010. [10] J. M. Górriz, J. Ramírez, E. W . Lang, and C. G. Pun- tonet, “Hard C-means clustering for voice activity de- tection, ” Speech Communication , vol. 48, no. 12, pp. 1638–1649, 2006. [11] H. Dubey , A. Sangwan, and J. H. L. Hansen, “Using speech technology for quantifying beha vioral charac- teristics in peer-led team learning sessions, ” Computer Speech & Languag e , vol. 46, pp. 343–366, 2017. [12] T . Ng, B. Zhang, L. Nguyen, S. Matsoukas, X. Zhou, N. Mesgarani, K. V esel ` y, and P . Matejka, “Dev eloping a speech activity detection system for the DARP A RA TS program, ” in ISCA INTERSPEECH , 2012, pp. 1969– 1972. [13] G. Saon, S. Thomas, H. Soltau, S. Ganapathy , and B. Kingsbury , “The IBM speech activity detection sys- tem for the D ARP A RA TS program, ” in ISCA INTER- SPEECH , 2013, pp. 3497–3501. [14] S. Thomas, G. Saon, M. V an Segbroeck, and S. S. Narayanan, “Improvements to the IBM speech acti v- ity detection system for the D ARP A RA TS program, ” in IEEE ICASSP , 2015, pp. 4500–4504. [15] M. Graciarena, A. Alwan, D. Ellis, H. Franco, L. Fer - rer , J. H. L. Hansen, A. Janin, B. S. Lee, Y . Lei, V . Mi- tra et al. , “ All for one: feature combination for highly channel-degraded speech activity detection. ” in ISCA INTERSPEECH , 2013, pp. 709–713. [16] S. Novotne y , D. Karakos, J. Silovsky , and R. Schwartz, “BBN technologies’ OpenSAD system, ” in IEEE Spo- ken Language T ec hnology W orkshop (SLT) , 2016, pp. 8–12. [17] M. Graciarena, L. Ferrer , and V . Mitra, “The SRI system for the NIST OpenSAD 2015 speech activity detection ev aluation, ” in ISCA INTERSPEECH , 2016, pp. 3673– 3677. [18] P . M. Hartigan, “Computation of the dip statistic to test for unimodality , ” Applied Statistics , vol. 34, pp. 320– 325, 1985. [19] J. A. Hartigan and P . M. Hartigan, “The dip test of uni- modality , ” The Annals of Statistics , pp. 70–84, 1985. [20] S. Maurus and C. Plant, “Skinny-dip: clustering in a sea of noise, ” in Pr oceedings of the 22nd A CM SIGKDD International Confer ence on Knowledge Discovery and Data Mining , 2016, pp. 1055–1064. [21] “NIST OpenSAD challenge 2015, ” (Date last accessed 5-July-2016). [Online]. A vailable: http://www .nist.gov/ itl/iad/mig/upload/Open_SAD_Eval_Plan_v10.pdf [22] “NIST 2017 pilot speech analytic technologies ev aluation, OpenSA T 2017, ” (Date last accessed 25-Oct-2017). [Online]. A vailable: https://www . nist.gov/sites/default/files/documents/2017/05/01/nist_ 2017_pilot_opensat_ev al_plan_v2.1_05- 01- 17.pdf
Original Paper
Loading high-quality paper...
Comments & Academic Discussion
Loading comments...
Leave a Comment