Assessing the Accuracy of a Wrist Motion Tracking Method for Counting Bites across Demographic and Food Variables
This paper describes a study to test the accuracy of a method that tracks wrist motion during eating to detect and count bites. The purpose was to assess its accuracy across demographic (age, gender, ethnicity) and bite (utensil, container, hand used…
Authors: Yiru Shen, James Salley, Eric Muth
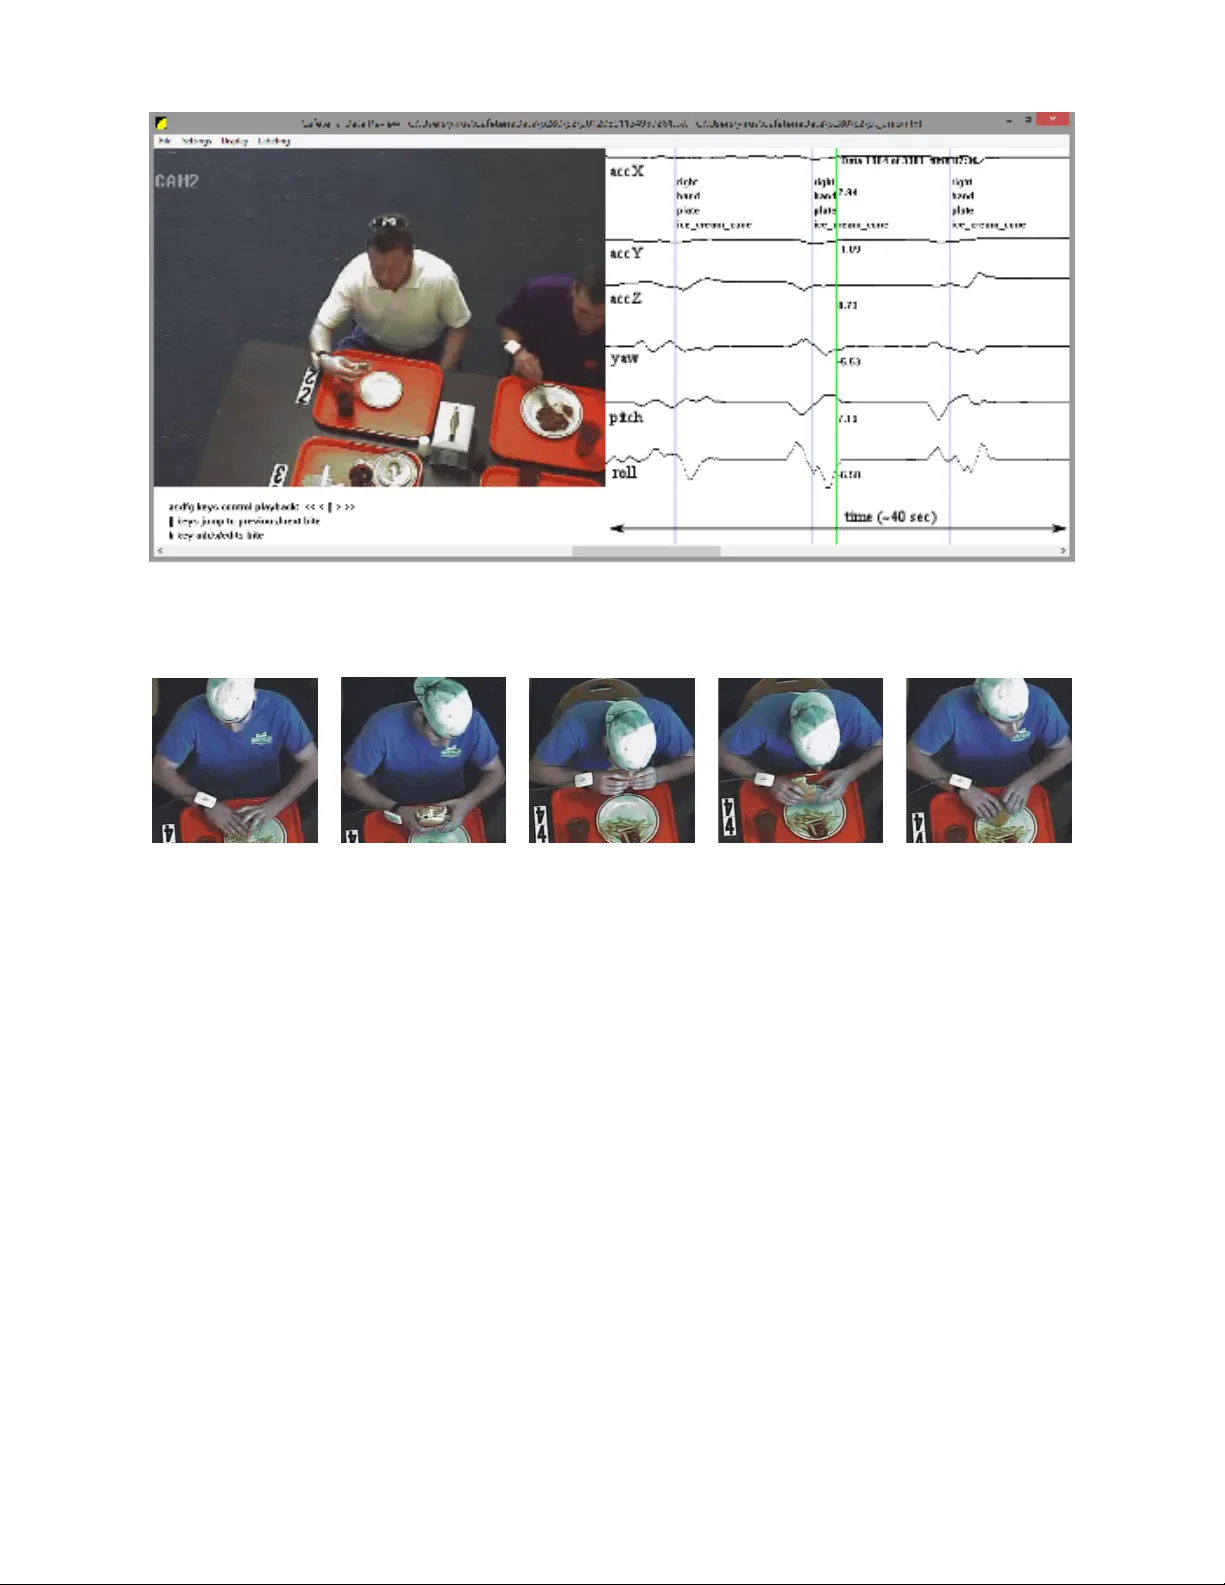
1 Assessing the Accurac y of a Wrist Motion T racking Method for Counting Bites across Demographic and F ood V ariables Y iru Shen, James Salley , Eric Muth, and Adam Hoover Senior Member , IEEE Abstract —This paper describes a study to test the accuracy of a method that tracks wrist motion during eating to detect and count bites. The pur pose was to assess its accuracy across demographic (age, gender , ethnicity) and bite (utensil, container , hand used, food type) variables. Data were collected in a cafeteria under normal eating conditions. A total of 271 participants ate a single meal while wearing a watch-like device to track their wrist motion. Video was simultaneously recorded of each participant and subsequently re viewed to determine the gr ound truth times of bites. Bite times were operationally defined as the moment when food or be verage was placed into the mouth. Food and be verage choices were not scripted or restricted. Participants were seated in groups of 2-4 and were encouraged to eat naturally . A total of 24,088 bites of 374 different food and bev erage items were consumed. Overall the method for automatically detecting bites had a sensitivity of 75% with a positive predictive v alue of 89%. A range of 62-86% sensitivity was found across demographic variables, with slower eating rates trending towards higher sensitivity . V ariations in sensitivity due to f ood type showed a modest correlation with the total wrist motion during the bite, possibly due to an increase in head-towards-plate motion and decrease in hand-towards-mouth motion for some food types. Overall, the findings provide the largest evidence to date that the method produces a reliable automated measure of intake during unrestricted eating. Index T erms —energy intake, gestur e recognition, mHealth, activity recognition I . I N T RO D U C T I O N M ORE than half of the world population is overweight (39%) or obese (13%) [32]. Obesity is associated with increased risks for cardiov ascular disease, diabetes, and certain forms of cancer [13], and has become a leading pre ventable cause of death [15]. The study and treatment of obesity is aided by tools that measure energy intake, determined by the amount and types of food and be verage consumed. Existing tools include questionnaires about the frequency of food consumption, food diaries, and 24-hour recalls of the foods consumed during the day [5], [30]. Ho wev er , these tools rely upon self-report and have a number of limitations, including high user and e xperimenter burden, interference with natural eating habits, decreased compliance over time, and underreporting bias [16], [30]. Experts in the field of dietetics Y . Shen and A. Hoo ver are with the Department of Electrical and Computer Engineering, Clemson University , Clemson, SC 29634-0915 USA (e-mail: yirus@clemson.edu; ahoo ver@clemson.edu). J. Salley and E. Muth are with the Department of Psychology , Clem- son University , Clemson, SC 29634 USA (e-mail: jnsalle@gmail.com; muth@clemson.edu). hav e emphasized the need for technology to adv ance the tools used for energy intake monitoring [14], [27], [31]. Advances in body sensing and mobile health technology hav e created new opportunities for empowering people to take a more activ e role in managing their health [12]. W earable sensors hav e significantly advanced the assessment of energy expenditure in the form of accelerometer -based physical ac- tivity monitors [34]. Ho wev er , the dev elopment of a similar tool for monitoring energy intake has remained elusiv e. Re- searchers ha ve in v estigated the automatic recognition of foods in images [3], [10], [20], [35] and sensors worn on the throat and ear area to detect swallowing ev ents [2], [17], [18], [23], [24], [26]. Our group has been in vestig ating using a wrist-w orn configuration of sensors to detect periods of eating [9] and track hand-to-mouth gestures [8], [21]. One benefit of wrist- mounted sensors is that they can be embodied in a device that resembles a common w atch. This makes the monitoring inconspicuous which helps promote long-term daily use [4]. In previous work our group developed a method that detects a pattern of wrist motion during the ingestion of a bite [7], [8]. An experimental e valuation of 49 people eating a meal of their choice in a laboratory setting found that the method counted bites with a sensitivity (ratio of true detections to total actual bites) of 86% and a positi ve predictive value (ratio of true detections to true detections plus false positives) of 81% [8]. The experiment also rev ealed that an inexpensi ve micro-electro-mechanical systems (MEMS) gyroscope was as accurate as a more sophisticated magnetic, angular rate and gravity (MARG) sensor in tracking the rele vant motion pat- tern [8]. These experiments were conducted using wrist-worn devices that were tethered to a stationary computer in order to facilitate the recording of raw motion data. Subsequently , the method was instantiated in a wearable version that resembles a watch. The watch e xecutes the algorithm to detect the rele v ant motion pattern on a microcontroller . A button is pressed at the beginning of an eating activity (e.g. meal or snack) to begin bite counting, and pressed again at the end of the eating activity to end bite counting. The total bite count for the eating acti vity is stored for subsequent downloading to an external computer . T o test its relev ance for measuring energy intake, 77 people wore the device for 2 weeks and used it to automatically count bites during all eating activities [28]. Participants completed the automated self-administered 24 hour recall to measure kilocalories consumed [29]. A total of 2,975 eating activities were ev aluated, an average of 39 per participant. A comparison of automated bite count to 2 kilocalories found an av erage per-individual correlation of 0.53, with 64 participants having a correlation between 0.4 and 0.7 [28]. This range of correlation is similar to what has been found in e v aluations of ener gy e xpenditure measured by accelerometer-based de vices (pedometers, physical activity monitors) [33]. This paper describes an experiment conducted to further ev aluate the accuracy of the automated bite counting method. The goal was to record a large number of people eating a wide v ariety of foods and bev erages to ev aluate its accuracy in terms of demographic v ariables (gender , age, ethnicity) and bite variables (food type, hand used, utensil, container). One approach to such an experiment is to script activities and ask each participant to complete the script. For example, a participant could be asked to consume 5 bites of 20 dif ferent types of food in a controlled order . This approach has been taken in some other studies of eating activities (e.g. [1], [18], [26]). Advantages to this approach include limiting the set of food types, simplifying the ground truth identification of ev ents due to the use of a controlled script, and ensuring an equal quantity of each event type through repetition. Ho wev er , this is unnatural in terms of food choices, eating pace, food order , and ov erall behavior during normal eating. Instead, we instrumented a cafeteria setting. Participants were allowed to select their own foods and eat naturally . This resulted in unequal distributions of bite variables which is of fset by recording a large number of participants. Section II describes the experimental conditions and Section III describes the variations in the accuracy of the bite counting method due to demographic and bite variables. I I . M E T H O D S A. Instrumentation The experiment took place in the Harcombe Dining Hall at Clemson Uni versity . The cafeteria seats up to 800 people and serves a large variety of foods and beverages from 10- 15 different serving lines. Figure 1 shows an illustration and picture of our instrumented table [11]. It is capable of recording data from up to four participants simultaneously and is similar to others in the cafeteria so that its appearance would not be distracting. Four digital video cameras in the ceiling (approximately 5 meters height) were used to record each participant’ s mouth, torso, and tray during meal consumption. A custom wrist-worn device containing MEMS accelerometers (STMicroelectronics LIS344ALH) and gyroscopes (STMicro- electronics LPR410AL) was used to record the wrist motion of each participant at 15 Hz. Cameras and wrist motion trackers were wired to the same computers and used timestamps for synchronization. All the data were smoothed using a Gaussian- weighted window of width 1 s and standard deviation of 2 3 s. B. P articipants The Clemson Univ ersity Institutional Revie w Board ap- prov ed data collection and each subject provided informed consent. A total of 276 participants were recruited and each consumed a single meal [22]. P articipants were free to choose any a vailable foods and be verages. Upon sitting at the table Fig. 1. The table instrumented for data collection. Each participant wore a custom tethered device to track wrist motion. to eat, an experimental assistant placed the wrist motion tracking de vice on the dominant hand of the participant and interviewed them to record the identities of foods selected. The participant was then free to eat naturally . If additional servings were desired, the participant was instructed to notify the experimental assistant to assist with removing the wrist motion tracker before moving through the cafeteria to obtain more food or be verage, returning to the table to begin a new segment of recording. Each such segment is referred to as a course. For 5 participants, either the video or wrist motion tracking data failed to record, and so are excluded from analysis. T otal usable data includes 271 participants, 518 courses with a range of 1-4 and av erage of 1.8 courses per participant. Demographics of the participants are 131 male, 140 female; age 18-75; height 50-77 in (127-195 cm); weight 100-335 lb (45-152 kg); self-identified ethnicity 26 African American, 29 Asian or Pacific Islander , 190 Caucasian, 11 Hispanic, 15 Other . C. Gr ound truth The goal of the ground truthing process was to identify the time, food, hand, utensil and container for each bite. Because our data set is so large and was collected during natural (unscripted) eating, the total process took more than 1,000 man-hours of work. Figure 2 shows a custom program we built to facilitate the process. The left panel displays the video while the right panel shows the synchronized wrist motion tracking data. K e yboard controls allo w for play , pause, rewind and fast forward. The horizontal scroll bar allo ws for jumping throughout the recording and additional keyboard controls allow for jumping to pre viously labeled bites. A human rater annotates a course by watching the video and pausing it at times when a bite is seen to be taken, using frame-by-frame rewinding and forwarding to identify the time when food or bev erage is placed into the mouth. Figure 3 shows an example of a sequence of images surrounding a bite. Once the bite time is identified, the rater presses a k ey to spawn a pop-up windo w that allows the user to select from a list of foods recorded as having been eaten by the participant during the course, and a list of hand, utensil and container options. The process of ground truthing a single course took 20-60 minutes. In total, 374 different food and be verage types were chosen by participants. Food and bev erage names were taken from the menus of the cafeteria. Some foods are given the generic name of the food line from which they are served due to the heterogeneous mixture of ingredients that could be custom 3 Fig. 2. A custom program created for manual labeling of ground truth bites. The left panel shows the video and the right panel shows the wrist motion tracking. V ertical purple lines indicate the times marked as bites, the vertical green line indicates the time currently displayed in the video. V ariables (hand, utensil, container , food) are identified for each bite. (a) frame=0 (a) frame=7 (a) frame=14 (a) frame=21 (a) frame=28 Fig. 3. Example identifying the time index of a bite (frame 14). selected by the participant, for example from a salad bar . In cases where a participant mixed 2 or more uniquely chosen foods, a single name was used that identified the combination. In cases where a participant ordered a custom version of a food in a food line, the modifier ‘custom’ was included in the name. Example food identities include salad bar, shoestring french fries, Asian vegetables, pasta tour of Italy , cheese pizza, homestyle chicken sandwich, hamburger , custom sandwich, garlic breadsticks, fried shrimp and grapefruit. Example bever - age identities include whole milk, coca cola, water , sweet tea, coffee and apple juice. Figure 4 shows some example images of foods. Foods and bev erages were served in four types of containers: plate, bowl, glass and mug. Four different utensils were used: fork, spoon, chopsticks and hand. Hand could be identified as left, right or both. T wo human raters independently labeled each course. A total of 22 raters contributed. Raters were trained during a 1 hour training session to understand the process and how to use the program for labeling. Quantifying rater agreement is complicated because labeling is a two step process. First, each rater had to decide when bites occurred. Second, they had to quantify food, hand, utensil and container for each bite. Therefore we dev eloped a two stage approach to determining rater agreement. For each bite labeled by one rater, a ± 1 sec window was searched for a corresponding bite from the second rater . If the food identity , hand, utensil and container all matched, then the bite was considered matched and the time index was taken as the a verage of the time indicated by the two raters. If a corresponding bite w as found within the window b ut one or more of the v ariables did not match, then the bite was re vie wed by a third rater who judged which variable v alues were correct. If no corresponding bite was found within the window , the third rater revie wed the bite to determine if it was missed by one of the raters or if it was of f by more than 1 sec from a bite labeled by the other rater, in which case the third rater judged the correct time. Using this process, rater performance can be ev aluated using four metrics: mistaken identity (food identified incorrectly), time error (bite labeled more than 1 second from actual time), missed bite (the rater missed the bite completely) and data entry error (hand, utensil or container was mislabeled). Figure 5 shows some examples of foods that can be dif ficult to identify , for example when 2 or more foods of similar 4 Fig. 4. Examples of foods. From left to right: cheese pizza; cereal Apple Jacks; chunky chocolate chip cookie; California chicken wrap, shoestring french fries; hamb urger , shoestring french fries. missed bites 900 (3.7%) time error 1217 (5%) identity error 714 (3%) data entry error 1059 (4.4%) T ABLE I M A NU AL L A B EL I N G E RR O R R ATE S . color and texture are served ov erlapping each other . Figure 6 illustrates an example of when the time of a bite can be difficult to determine due to the head of the participant obscuring the precise time of food intake. Data entry errors occurred most commonly when a rater mistakenly labeled a bowl as a plate or a mug as a glass, either of which would propagate to all the related bites in the course. T able I summarizes the errors found as judged by the third rater . The usefulness of a fourth rater independently labeling each course and then comparing it to the union judged by the third rater was e xplored. After 71 courses were labeled, the process was stopped. In those 71 courses the following total errors were found: 17 missed bites, 0 timing errors, 18 identity errors and 8 data entry errors. Giv en the lar ge amount of time needed to independently label the data and the tiny amount of new errors disco vered, it was determined that the quality of ground truth pro vided by two human raters and then judged by a third rater was sufficient. D. Bite counting algorithm The bite counting algorithm described in [8] is briefly repeated here for background. The algorithm detects a pattern of wrist roll motion associated with a bite through the detection of four ev ents. First, the wrist roll velocity must surpass a positiv e threshold. Second, a minimum amount of time must pass. Third, the velocity must surpass a negati ve threshold. Finally , a minimum time must pass between the neg ativ e wrist roll for one bite and the positi ve wrist roll for the beginning of a next bite. The minimum times help reduce false positi ves during other motions. The algorithm for detecting a bite based on this motion pattern can be implemented as follows: Let EVENT = 0 Loop Let Vt = measured roll vel. at time t If Vt > T1 and EVENT = 0 EVENT = 1 Let s = t if Vt < T2 and t-s > T3 and EVENT = 1 Bite detected Let s = t EVENT = 2 if EVENT = 2 and t-s > T4 EVENT = 0 The v ariable E V E N T iterates through the ev ents just de- scribed. The parameters T 1 and T 2 define the threshold for roll detections, the parameter T 3 defines the minimum time between positiv e and negati ve rolls, and the parameter T 4 defines the minimum time between bites. E. Evaluation metrics The e valuation method follows the procedure previously established [8]. Algorithm bite detections are compared to ground truth manually marked bites. Figure 7 illustrates the possible classifications. For each computer detected bite (small square in the figure), the interval of time from the previous detection to the following detection is considered. The first actual bite taken within this window , that has not yet been paired with a bite detection, is classified as a true detection (T). If there are no actual bite detections within that window , then the bite detection is classified as a false detection (F). After all bite detections ha ve been classified, an y additional actual bites that remain unpaired to bite detections are classified as undetected bites (U). This approach defines an objectiv e range of time in which an actual bite must have occurred in order to classify a detected bite as a true positiv e. The window extends prior to the actual bite because it is possible in some cases for the wrist roll motion to complete just prior to the actual placing of food into the mouth. Sensitivity (true detection rate) is calculated as (total Ts)/(total Ts+ total Us). Because this method does not allow for the definition of a true ne gativ e, specificity (false detection rate) cannot be calculated. W e therefore calculate the positiv e predicti ve value as a measure of performance regarding false positives. The positiv e predictiv e value (PPV) is calculated as (total Ts)/(total Ts+ total Fs). F . P arameter T uning In the original experiment in volving 49 people eating a meal in a laboratory setting, T 1 = T 2 = 10 , T 3 = 2 and T 4 = 8 were determined to be optimal [8]. It was also found that a range of values provided reasonable results. The present work reports results using these same values but also reports results using a shorter time for T 4 . During ev aluation is was discov ered that people ate faster on av erage in the cafeteria experiment than in the previous laboratory 5 Fig. 5. Examples of foods that are dif ficult to identify bite by bite. From left to right: collard greens, macaroni and cheese, corn bread; edamame, jasmine rice, stir fry; char sui braised pork, bro wn rice, peas and carrots; pork chop suey with white rice, turke y sliced; Mexican rice, refried beans, roast pork loin. (a) frame=0 (a) frame=15 (a) frame=30 (a) frame=45 (a) frame=60 Fig. 6. Example of difficulty identifying the time index of a bite due to obscuring head motion. Fig. 7. Classification of results. experiment. It was found that setting T 4 = 6 produced a more balanced sensiti vity and positi ve predictive value. This is further discussed in sections III-IV. I I I . R E S U L T S T able II lists the sensiti vities found across demographic variables age, gender and ethnicity . Sensitivity trended higher as age increased. Sensitivity for females was 10% higher than sensitivity for males. For ethnicity , sensitivity was highest for African Americans and lowest for Asians/Pacific Islanders. T able II also reports the average eating rate for each de- mographic in seconds per bite (SPB). SPB trends lo wer for ev ery demographic as sensitivity trends lower , suggesting that a faster eating rate results in lower sensitivity . Figure 8 plots the sensiti vity of the method for the foods of which more than 100 bites were consumed. The a verage sensitivity (75%) is giv en for reference. For most foods the sensitivity trends consistently in the range of 60-90%. For a small number of foods the sensiti vity drops precipitously . For a food like ice cream cone the decrease in sensitivity is likely due to the natural minimization of wrist roll during consumption (for fear of having the ice cream fall out of the cone). Figure 8 also sho ws the average SPB of each food type. The correlation between SPB and sensitivity is 0.4 demographic #partic. #bites #detected (sensitivity) SPB age 51-75 21 1634 1404 (86%) 18 41-50 33 2790 2227 (80%) 17 31-40 27 2531 1949 (77%) 15 24-30 76 7426 5326 (72%) 13 18-23 114 9707 7050 (73%) 13 gender female 140 11811 9401 (80%) 15 male 131 12277 8555 (70%) 13 ethnicity African American 26 1958 1583 (81%) 18 Caucasian 190 15990 12327 (77%) 15 Hispanic 11 1195 877 (73%) 13 Other 15 1635 1115 (68%) 14 Asian or Pac. Isl. 29 3310 2054 (62%) 12 T ABLE II S E NS I T I VI T Y A N D S E CO N D S P ER B I T E ( S P B ) F O R A GE , G E N D ER , A N D E T HN I C I TY . suggesting it has a mild effect. T o look for other potential causes of variability we manually observed the motion in the hundreds of hours of video to try to infer commonalities. In many cases a bite inv olves head-towards-plate motion in combination with hand-tow ards-mouth motion. The former seems to be larger when a food is more prone to spillage, so a participant positions their head over the container to facilitate deliv ery of the food to the mouth (for e xample, compare figure 3 to figure 6). T o explore this hypothesis we calculated the amount of motion of the wrist during a 2 second window centered on ev ery bite and took the average v alue for each food type, finding a 0.4 correlation which again suggests a mild effect. T able III summarizes the accuracies found across other bite type variables. Container sensiti vity was fairly consistent with the exception of glass which was 9% lower than av erage. For utensils, chopsticks showed a relatively low detection rate (50%) but were also found to be used twice as fast (7 6 Fig. 8. Sensitivity and seconds per bite (SPB) for all foods of which participants consumed greater than 100 bites. Frequency (number of occurrences) of bites for food types in this figure ranged from 110 to 3,986. A verage sensitivity (75%) highlighted for reference. bite v ariable #bites #detected (sensitivity) SPB container bowl 3939 3091 (79%) 15 mug 116 87 (75%) 17 plate 16434 12389 (74%) 15 glass 3599 2389 (66%) 19 utensil fork 10308 8627 (83%) 16 spoon 2389 1711 (73%) 12 hand 10989 7419 (68%) 16 chopsticks 400 198 (50%) 7 hand used l-handed using left hand 1363 1106 (81%) 15 r-handed using right hand 18344 14267 (78%) 15 l-handed using both hands 162 116 (72%) 19 r-handed using both hands 1233 860 (70%) 16 T ABLE III S E NS I T I VI T Y A N D S E CO N D S P ER B I T E ( S P B ) F O R C O N T A I NE R , U T E NS I L S , A N D H A N D U S ED . seconds per bite) as a fork or hand (14-15 seconds per bite). Handedness showed a small variation in sensiti vity , while the use of both hands as opposed to a single hand reduced sensitivity by 8-9%. Overall, across all 24,088 bites the sensitivity was 75% with a positive predictive value of 89%. The algorithm parameters were originally determined using data recorded in a laboratory setting [8] in which the average eating rate was slo wer (n=49, seconds per bite = 19.1 ± 6.4) compared to what was observed in the cafeteria setting (n=271, seconds per bite = 14.7 ± 5.6). W e therefore experimented with shortening the parameter controlling the minimum time between detections of bites to 6 seconds. With this value the algorithm produced 81% sensitivity with a positi ve predictive value of 83%. I V . D I S C U S S I O N The primary goal of this study was to assess the accu- racy of the bite counting method across a wide variety of demographics and food types. While minor v ariations occurred across most v ariables, the method sho wed robustness to this challenging data set. The original laboratory test found 81% sensitivity with 86% positi ve predictiv e v alue [8]. After tuning the algorithm to the f aster eating pace observed in the cafeteria, the same sensitivity was achieved with only a 3% decrease in positiv e predicti ve v alue. This experiment provides the most comprehensiv e evidence to date that the method is reliable during normal unscripted eating. 7 The experiment identified two areas where the algorithm could be improv ed. First, variations in eating pace affect the sensitivity . The bite detection algorithm includes a parameter (T4) that defines the minimum time between bites. It is intended to reduce false positiv es that may be caused by non- eating wrist motions. In our previous experiment in a labora- tory (49 people), we found that tuning T4 to 8 seconds pro- vided the best av erage results [8]. In the cafeteria experiment reported in this paper (271 people), we found that tuning T4 to 6 seconds provided the best average results. W e also found that there were some differences in average eating rate across demographic variables (age, gender , ethnicity) that trended with bite detection sensitivity . In future work we intend to use those demographic variables to try to automatically adjust T4. W e also intend to try to detect eating rate from the wrist motion tracking signals to automatically adjust to the individual. This would be similar to how a pedometer learns the stride duration of a person while running or walking and adjusts its step detection parameters accordingly . Second, variations in the amount of wrist motion versus the amount of head-towards- plate motion affect the sensitivity . T wo parameters of the algorithm are designed to detect the typical amount of motion. Again it may be possible to adjust these parameters in real- time to learn the typical amount of wrist motion of a person during a meal. This w ork provides the data set necessary to explore these ideas. One limitation of the bite counting algorithm is that it requires a user to turn the method on/off at the beginning/end of a meal. Howe ver , in a previous study we analyzed data from 77 participants consuming 2,975 meals over a 2 week period [28]. This demonstrated good compliance with remembering to use the device. Another potential limitation of the bite counting algorithm is its susceptibility to false positi ves caused by wrist motions unrelated to eating. Howe ver , in this experiment we did not script the eating activity or restrict the types of motions of the participants. People were instructed to eat as naturally as possible and thus the amount of non-eating wrist motions can be expected to be typical. In our previously published laboratory experiment, we manually revie wed the videos and counted non-eating wrist motions such as those caused by using a napkin, phone, or engaging in con versation, and found that they occurred between 67% of bites. Collectiv ely our experiments demonstrate rob ustness to typical non-eating wrist motions during normal eating. A strength of the experiment reported in this paper is that the eating recorded took place in an en vironment that was as natural as possible, and eating behaviors were completely unscripted and unrestricted. A weakness of this approach is that it requires a tremendous ef fort in labeling ground truth. In total over 1,000 man hours were inv ested in revie wing the videos and labeling the bites. W e recruited 22 revie wers because of the large effort needed to complete the ground truthing process. Studies have shown that participants change their eating behavior in clinical settings [6], [19]. As this method is intended to be used in free-li ving scenarios, a naturalistic e v aluation of its accurac y is important. Ho we ver , although we tried to make the cafeteria setting as natural as possible, it is still possible that behaviors in free-living en vironments could affect the accuracy of the method in ways that could not be captured with this study (e.g. grazing, other types of distraction). Future studies should examine the algorithm’ s accuracy in these types of situations. V . A C K N O W L E D G M E N T S W e gratefully acknowledge the support of the NIH via grants 1R41DK091141-A1 and 2R42DK091141-02. W e also wish to thank the 22 v olunteers who manually labeled the bite database for their hundreds of hours of work. R E F E R E N C E S [1] O. Amft and G. Troster , “Methods for detection and classification of normal swallo wing from muscle activ ation and sound”, in the proc. of IEEE P ervasive Health Confer ence and W orkshops , 2006. [2] O. Amft and G. Tr ¨ oster , “On-body sensing solutions for automatic dietary monitoring”, in IEEE P ervasive Computing , vol. 8 no. 2, pp. 62-70, 2009. [3] M. Anthimopoulos, et. al., “Computer V ision-Based Carbohydrate Esti- mation for T ype 1 Patients With Diabetes Using Smartphones”, in J. of Diabetes Science and T echnolo gy , v ol. 9 no. 3, 2015, pp. 507-515. [4] M. Coons, A. DeMott, J. Buscemi, et. al., “T echnology interventions to curb obesity: a systematic review of the current literature”, in Curr ent car diovascular risk r eports , v ol. 6(2), 2012, pp. 120-134. [5] N. Day , N. McKeown, M. W ong, A. W elch and S. Bingham, “Epidemi- ological assessment of diet: a comparison of a 7-day diary with a food frequency questionnaire using urinary markers of nitrogen, potassium and sodium”, in Int’l Journal of Epidemiology , vol. 30 no. 2, pp. 309- 317, 2001. [6] J. de Castro, “Eating behavior: lessons from the real world of humans”, in Nutrition , vol. 16(10), 2000, pp. 800-813. [7] Y . Dong, A. Hoover and E. Muth, “ A device for detecting and counting bites of food taken by a person during eating”, in IEEE Int’l Conf on Bioinformatics and Biomedicine , 2009, pp. 265-268. [8] Y . Dong, A. Hoover , J. Scisco and E. Muth, “ A new method for measuring meal intake in humans via automated wrist motion tracking”, in Applied Psychophysiol Biofeedback , vol. 37 no. 3, pp. 205-215, 2012. [9] Y . Dong, J. Scisco, M. Wilson, E. Muth and A. Hoo ver , “Detecting Periods of Eating During Free-Living by T racking Wrist Motion”, in IEEE Journal of Biomedical and Health Informatics , vol. 18 no. 4, 2014, pp. 1253-1260. [10] H. He, F . K ong and J. T an, “DietCam: Multi-V iew Food Recognition Using a Multi-Kernel SVM”, in IEEE J. of Biomedical and Health Informatics , in press. [11] Z. Huang, “ An Assessment of the Accuracy of an Automated Bite Counting Method in a Cafeteria Setting”, master’ s thesis, Electrical and Computer Engineering Department, Clemson University , 2013. [12] S. Kumar , W . Nilsen, M. Pa vel and M. Sriv astav a, “Mobile Health: Rev olutionizing Healthcare Through T ransdisciplinary Research”, in IEEE Computer , vol. 46 no. 1, 2013, pp. 28-35. [13] S. Malnick and H. Knobler, “The medical complications of obesity”, in Quarterly J ournal of Medicine , vol. 99, pp. 565-579, 2006. [14] B. McCabe-Sellers, “ Advancing the art and science of dietary assessment through technology”, in Journal of the American Dietetic Association , vol. 110 no. 1, pp. 52-54, 2010. [15] A. Mokdad, J. Marks, D. Stroup and J. Gerberding, “ Actual causes of death in the united states”, in The Journal of the American Medical Association , v ol. 291 no. 10, pp. 1238-1245, 2004. [16] National Institutes of Health, http://grants1.nih.go v/grants/guide/pa- files/ P AR- 09- 224.html, accessed March 28, 2016. [17] S. P ¨ aßler and W .-J. Fischer, “F ood intake acti vity detection using a wear- able microphone system”, in 2011 7th Int’l Confer ence on Intelligent En vir onments , Jul. 2011, pp. 298-301. [18] S. P ¨ aßler and W .-J. Fischer , “Food intake monitoring: Automated che w ev ent detection in chewing sounds”, in IEEE Journal of Biomedical and Health Informatics , vol. 18 no. 1, pp. 278-289, 2014. [19] A. Petty , K. Melanson and G. Greene, “Self-reported eating rate aligns with laboratory measured eating rate but not with free-living meals”, in Appetite , v ol. 63, 2013, pp. 36-41. [20] P . Pouladzadeh, S. Shirmohammadi and R. Al-Maghrabi, “Measuring calorie and nutrition from food image”, in IEEE T rans. on Instrumen- tation and Measur ement , v ol. 63 no. 8, pp. 1947-1956, 2014. 8 [21] R Ramos, E. Muth, J. Gowdy and A. Hoover , “Improving the Recogni- tion of Eating Gestures Using Inter-Gesture Sequential Dependencies”, in IEEE Journal of Biomedical and Health Informatics , vol. 19 no. 3, 2015, pp. 825-831. [22] J. Salley , A. Hoover , M. Wilson and E. Muth, “ A Comparison Between Human and Bite-Based Methods of Estimating Caloric Intake”, in Journal of the Academy of Nutrition and Dietetics , in press. [23] E. Sazonov , S. Schuckers, P . Lopez-Me yer, O. Makeyev , N. Sazonov a, E. L. Melanson and M. Neuman, “Non-in v asiv e monitoring of che wing and swallo wing for objective quantification of ingestiv e behavior”, in Physiological Measurement , vol. 29 no. 5, p. 525, 2008. [24] E. Sazonov , O. Makeye v , S. Schuckers, P . Lopez-Meyer, E. Melanson and M. Neuman, “ Automatic detection of swallowing events by acous- tical means for applications of monitoring of ingestive behavior”, IEEE T rans. on Biomedical Engineering , vol. 57 no. 3, pp. 626-633, March 2010. [25] E. Sazonov and S. Schuckers, “The ener getics of obesity: A review: Monitoring energy intake and ener gy e xpenditure in humans”, in IEEE Engineering in Medicine and Biology Magazine , vol. 29 no. 1, pp. 31-35, 2010. [26] E. Sazonov and J. Fontana, “ A sensor system for automatic detection of food intake through non-inv asi ve monitoring of chewing”, in IEEE Sensors Journal , vol. 12 no. 5, pp. 1340-1348, May 2012. [27] D. Schoeller, et. al., “Self-report-based estimates of ener gy intake of fer inadequate basis for scientific conclusions”, in The American Journal of Clinical Nutrition , vol. 97 no. 6, pp. 1413-1415, June 2013. [28] J. Scisco, E. Muth and A. Hoover , “Examining the utility of a bite- count based measure of eating activity in free-li ving human beings”, in Journal of the Academy of Nutrition and Dietetic , vol. 114 no. 3, pp. 464-469, 2014. [29] A. Subar, S. Kirkpatrick, B. Mittl, et. al., “The Automated Self- Administered 24-hour dietary recall (ASA24): a resource for researchers, clinicians, and educators from the National Cancer Institute”, in J Acad Nutr Diet , vol. 112 no. 8, 2012, pp. 1134-1137. [30] F . Thompson and A. Subar , Dietary Assessment Methodology , 2nd ed. Academic Press/Else vier , 2008. [31] F . Thompson, A. Subar, C. Loria, J. Reedy and T . Barano wski, “Need for technological innov ation in dietary assessment”, in Journal of the American Dietetic Association , v ol. 110 no. 1, pp. 48-51, 2010. [32] W orld Health Organization, http://www .who.int/mediacentre/factsheets/ fs311/en/, accessed March 30, 2016. [33] K. W esterterp and G. Plasqui, “Physical Activity Assessment with Accelerometers: An Evaluation against Doubly Labeled W ater”, in Obesity , v ol. 15, 2007, pp. 2371-2379. [34] K. W esterterp, “ Assessment of physical activity: a critical appraisal”, in European J ournal of Applied Physiology , vol. 105 no. 6, 2009, pp. 823-828. [35] F . Zhu, M. Bosch, N. Khanna, C. Boushey and E. Delp, “Multiple Hypotheses Image Segmentation and Classification with Application to Dietary Assessment”, in IEEE J. of Biomedical and Health Informatics , vol. 19 no. 1, 2015, pp. 377-388.
Original Paper
Loading high-quality paper...
Comments & Academic Discussion
Loading comments...
Leave a Comment