Coverage Enhancement for mmWave Communications using Passive Reflectors
Millimeter wave (mmWave) technology is expected to dominate the future 5G networks mainly due to large spectrum available at these frequencies. However, coverage deteriorates significantly at mmWave frequencies due to higher path loss, especially for…
Authors: Wahab Khawaja, Ozgur Ozdemir, Yavuz Yapici
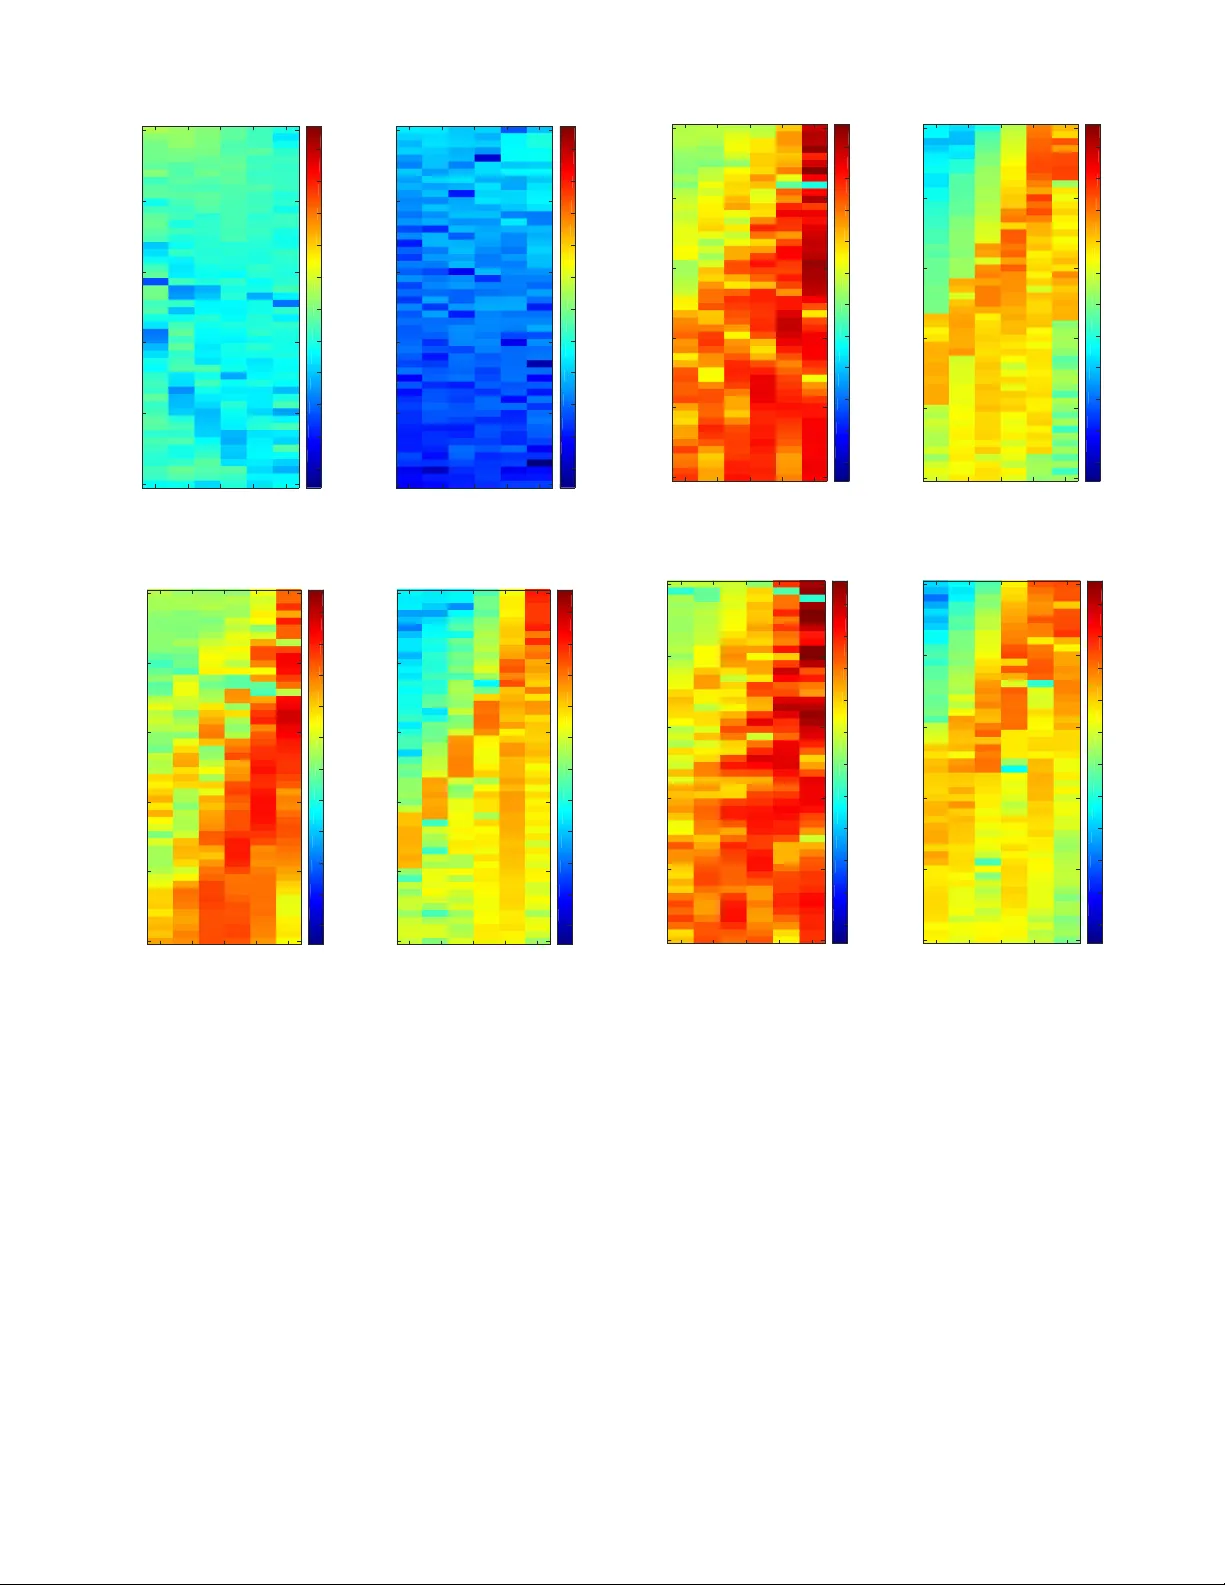
Co v erage Enhancement for mmW a v e Communications using P assi v e Reflectors W ahab Khaw aja ∗ , Ozgur Ozdemir ∗ , Y a vuz Y apici ∗ , Ismail Guvenc ∗ , and Y uichi Kakishima † ∗ Department of Electrical and Computer Engineering, North Carolina State Univ ersity , Raleigh, NC † DOCOMO Innov ations, Inc., Palo Alto, CA Email: { wkhawaj, oozdemi, yyapici, iguv enc } @ncsu.edu, kakishima@docomoinnov ations.com Abstract —Millimeter wa ve (mmW av e) technology is expected to dominate the future 5G netw orks mainly due to large spectrum av ailable at these fr equencies. Howev er , coverage deteriorates significantly at mmW a ve fr equencies due to higher path loss, es- pecially f or the non-line-of-sight (NLOS) scenarios. In this work, we explore the use of passive reflectors for improving mmW ave signal coverage in NLOS indoor areas. Measurements are carried out using the PXI-based mmW a ve transcei ver platforms fr om National Instruments operating at 28 GHz, and the results are compared with the outcomes of ray tracing (R T) simulations in a similar envir onment. For both the measurements and ray tracing simulations, different shapes of metallic passive reflectors are used to observe the coverage (signal strength) statistics on a receiv er grid in an NLOS area. F or a square metallic sheet reflector of size 24 × 24 in 2 and 33 × 33 in 2 , we observe a significant increase in the received power in the NLOS region, with a median gain of 20 dB when compared to no reflector case. The cylindrical reflector shows mor e uniform co verage on the receiver grid as compared to flat reflectors that are more directional. Index T erms —Coverage, electr omagnetic waves, mmW av e, non-line-of-sight (NLOS), PXI, ray tracing, r eflector . I . I N T RO D U C T I O N There is an ev er increasing demand for higher communica- tion data rates with newer applications requiring higher data bandwidths. The sub- 6 GHz spectrum is reaching its limits due to spectrum congestion. With the opening of mmW a ve spectrum by FCC [1], researchers hav e been exploring the realization of 5 G communication networks at mmW ave fre- quencies. A major bottleneck for mmW ave propagation in the free space is high attenuation that makes radio frequency planning in the non-line-of-sight (NLOS) very difficult [2], [3]. Solutions to this problem may include use of high transmit power , high sensitivity recei vers, and deployment of multiple access points or repeaters to improv e link quality . Howe ver , increasing the transmit power and recei ver sensiti vity beyond a given limit may not be practical due to sophisticated and expensi ve equipment required. Similarly , introducing multiple access points and repeaters is not economically feasible. A practical solution for impro ving mmW ave propagation in NLOS areas can be the use of passi ve metallic reflectors. The reflection properties are especially better at higher frequencies due to smaller skin depth [4]. This solution can be attractiv e due to large life span, low maintenance cost, ease in inter- operability , and low initial in vestment costs when compared This work has been supported in part by N ASA under the Federal A w ard ID number NNX17AJ94A and by DOCOMO Innovations, Inc. Fig. 1: Measurement scenario in the basement corridor of Engineering Building II at North Carolina State Univ ersity for flat square sheet aluminum reflector of size 24 × 24 in 2 , at an azimuth angle θ = 45 ◦ . to repeaters, consisting of acti ve elements. Passi ve metallic reflectors have been used in the past for microwa ve links for long distance communications such as satellite commu- nications [5]–[7], and base station to base station microwa ve links [8]. Howe v er , there are limited studies av ailable in the literature on the use of passiv e reflectors for communication with user equipment (see e.g. [9], [10]), primarily due to their lower efficiency as compared to acti ve repeaters. Passi ve reflectors can prove to be more useful for improving cov erage at mmW av e frequencies (see Fig. 1), due to better reflection properties in those frequencies. Ho wev er , similar to low frequency microw av e communications, there are limited studies av ailable to date in the literature on the use of passi v e reflectors for mmW a ve communications. In [11], a parabolic reflector is introduced behind a patch antenna for a hand held device operating at 60 GHz. The introduction of parabolic reflector helps to counter the shadowing introduced by finger while operating the device. Simulations were carried out indicating a gain of 19 dB - 25 dB. In [12], wideband channel sounding measurements at 60 GHz were carried out to ev aluate the reflecting properties of different building materials in indoor and outdoor en vironments. In [13], a parabolic passi ve reflector is used in outdoors at mmW ave frequencies to reflect the low energy signal of NLOS path to shadowed zones. Fig. 2: Geometrical model in the azimuth plane with a reflect- ing surface deployed at the corner of a corridor . Numerical results were used to indicate that there is significant increase in the cov erage area by using multiple reflectors. In this work, as illustrated in Fig. 1, we have performed indoor measurements using different size and shape passive aluminum reflectors at 28 GHz in an NLOS scenario using National Instruments (NI) mmW ave PXI platform with di- rectional horn antennas. The receiv ed power is observed to improv e for all the reflector shapes when compared to no re- flector case. The received power for flat square sheet reflectors is observed to be higher when compared to cylindrical and spherical shaped reflectors. W ith 24 × 24 in 2 and 33 × 33 in 2 flat square sheet reflectors, we observe a median power gain of approximately 20 dB along with better overall cov erage on the receiv er grid. Whereas for cylindrical reflector , we observ e more uniform power distribution ov er the receiver grid. The measurement results are compared with the outcomes of ray tracing (R T) simulations incorporating the diffuse scattering phenomenon. I I . P RO PAG A T I O N M E A S U R E M E N T S A T 2 8 G H Z Measurements were carried out in the basement corridor of Engineering Building II at North Carolina State University as illustrated in Fig. 1. A more detailed geometrical sketch of the measurement en vironment is illustrated in Fig. 2. The receiv er is mov ed at dif ferent positions in the ( x, y ) plane of the corridor to form a recei ver grid. A similar geometry is generated using the Remcom W ireless InSite ray tracing software to compare with the measurement outcomes, as shown in Fig. 4 and will be explained in Section III. The measurements were performed using hardware based on NI mmW av e transcei ver system at 28 GHz [14] as shown in Fig. 3. The system contains tw o PXI platforms: one transmitter Mm w a v e TX Radi o H ead Sla v e Rubi dium Cl oc k P o w er Sen sor TX H or n An t en na TX P XI Mas t er R ubidi um Cl oc k Mm w a v e RX Radi o H ead RX P XI RX H orn An t en na Coup l er Fig. 3: 28 GHz channel sounder based on NI mmwav e transceiv er system. T ABLE I: Dimensions of reflectors used in the experiment. Reflector T ype Dimensions of reflectors Sphere r = 13 in Cylinder r = 4 . 5 in, h = 18 in Flat square sheet w = h = 33 in, 24 in, 12 in platform and one recei ver platform. T wo rubidium (Rb) clocks, one master and one slav e provides 10 MHz and PPS signals to the PXI timing and synchronization modules at the transmitter and the receiv er . The master Rb clock trains the slav e Rb clock so that clock signals are synchronized. 1 The coupler at the transmitter provides 30 dB attenuated signal for the po wer sensor to make power calibration. W ith power calibration we can con vert the channel impulse response measurements from dB to dBm. A separate power calibration is performed at the receiv er side as well. The digital to analog conv erter at the transmitter PXI and the analog to digital con verter at the recei ver PXI ha ve a high sampling rate of 3.072 GS/s. The channel sounder supports 1 GHz and 2 GHz modes of operation. The measurements for this paper are performed using the 2 GHz mode where the sounding signal duration is 1.33 µ s, which also is the maximum measurable excess delay of the sounder . This mode provides a 0.65 ns delay resolution in the delay domain, corresponding to 20 cm distance resolution. The analog to digital con verter has around 60 dB dynamic range and this system can measure path loss up to 185 dB. In order get accurate channel measurements, we need to characterize the non-flat frequency response of the measure- ment hardware itself, and subsequently do a calibration to compensate for the impulse response due to the hardware. F or calibration purposes a cable with fixed attenuators connects the transmitter to the recei ver . Assuming the cable and the attenua- tors hav e flat response, the channel response of the hardware is measured. During actual measurements, the hardware response is equalized assuming hardware response does not vary over time. After this equalization we obtain the response of the actual ov er the air channel. T o improve the co verage area in NLOS receiv er region, we use reflectors of different shapes and sizes as illustrated in 1 The training needs to be performed before each measurement by con- necting two Rb clocks by a coaxial cable. Once the trining is done then the cable can be disconnected and the systems can be separated without any cable connecting them. Fig. 4: Indoor NLOS path scenario in the basement corridor of Engineering Building II of North Carolina State Univ ersity simulated in Wireless InSite for flat square sheet reflector 24 × 24 in 2 at an azimuth angle, θ = 45 ◦ . T able I, where r represents the radius, while w , h represent the width and height of the reflectors, respectiv ely . The gain of a reflector at a given propagation path is dependent on the shape and cross-sectional area of the reflector , and can be represented in terms of radar cross section (RCS) that incorporates the shape and cross-sectional area [15]. The coverage can be improv ed in a gi ven direction by changing the orientation of the reflector . If we want to steer the incident beam at an azimuth angle 2 θ to provide coverage to a particular area at a giv en azimuth angle, we need to tilt the reflector sheet in the azimuth plane by an angle θ as shown in Fig 4, where ˆ u is the surface normal of the reflector sheet. I I I . R A Y T R AC I N G S I M U L A T I O N S A T 2 8 G H Z Simulations for the passi ve metallic reflectors at mmW av e frequencies are performed using Remcom W ireless InSite ray tracing software, considering a similar indoor en vironment as shown in Fig. 4. A sinusoidal sounding signal at 28 GHz is used, and the transmit power is set to 0 dBm. Horn antennas [16] are used at both transmitter and the receiv er grid. The antennas are vertically polarized with a gain of 17 dBi. The antenna has 26 ◦ and 24 ◦ of half power beamwidth in the E- plane and H-plane, respectively . The simulation environment is similar to the actual en vironment with the inclusion of respectiv e objects and their properties. The selection of wall, floor , ceiling, door and reflector materials are are made upon observing the real world materials in the measurement en vi- ronment. ITU thr ee layer ed drywall is used for walls, ITU T ABLE II: Diffuse scattering parameters. Material Diffuse scattering coefficient Perfect conductor 0.1 Concrete 0.2 Ceiling board 0.25 Layered dry wall 0.3 ceiling boar d is used for ceilings, concrete is used for floor , and a perfect conductor is used for the door and the metallic reflector . All the materials are frequency sensitive at 28 GHz. The dimensions of the simulation setup are same as in Fig. 2. In addition to specular reflection at mmW av e frequencies, diffuse scattering also occurs dominantly due to comparable size of wavelength of the transmitted wav e and the dimensions of the irregularities of the surfaces that it encounters. In the simulations, diffuse scattering feature has been used to take into account this factor . The dif fuse scattering model used in the simulations is directi ve model. Only the diffuse scattering coefficient is changed for dif ferent materials, whereas the other model parameters remain the same. Diffuse scattering coeffi- cient of different materials used in the simulations are provided in T able II, where the materials with higher roughness have higher diffuse scattering coef ficient. The receiv ed power is obtained and summed coherently from the recei ved MPCs at a giv en receiv er location. This in volves the phase of each MPC to be considered in the receiv ed power calculation. I V . E M P I R I C A L A N D S I M U L A T I O N R E S U LT S In this section, empirical and simulation results are analyzed for the indoor NLOS measurements with and without metallic reflectors. The receiv ed power is analyzed over a grid of dimensions 1 . 5m × 15m . A. Covera ge with No Reflector In Fig. 5(a) (left), receiv ed po wer on the recei ve grid is shown using measurements when no reflector is utilized. On the other hand, Fig. 5(a) (right) shows the mmW ave signal cov erage using ray tracing simulations, again considering no reflector . W e observe higher receiv ed power in case of measurements; possible effects contributing to this behavior can include the additional scatterers in the real en vironment, and the specific values of diffuse scattering coefficients and associated model parameters for simulations. B. Covera ge with Squar e Metal Reflectors The received po wer in case of 12 × 12 in 2 square sheet reflector oriented at an azimuth angle of θ = 45 ◦ is shown in Fig. 5(b). W e can observe a distinct directional pattern that enlarges with the distance over the grid. This directional pattern is perpendicular to the reflector , as the reflector is oriented at 45 ◦ . Moreo ver , we also observ e second order reflections from the wall near the end of y-grid. In case of simulations, we observe lo wer reflected po wer as compared to measurements with similar power distribution ov er the grid. For the 24 × 24 in 2 square sheet reflector oriented at 45 ◦ , the receiv ed po wer falling on the grid is shown in Fig. 6(a), where we observe the highest receiv ed power and large co verage in the azimuth plane on the receiver grid. The received Measurements 0.3 0.6 0.9 1.2 1.5 x [m] 0 3 6 9 12 15 y [m] -95 -90 -85 -80 -75 -70 -65 -60 -55 -50 -45 Ray Tracing 0.3 0.6 0.9 1.2 1.5 x [m] 0 3 6 9 12 15 y [m] -95 -90 -85 -80 -75 -70 -65 -60 -55 -50 -45 dBm dBm (a) Measurements 0.3 0.6 0.9 1.2 1.5 x [m] 0 3 6 9 12 15 y [m] -95 -90 -85 -80 -75 -70 -65 -60 -55 -50 -45 Ray Tracing 0.3 0.6 0.9 1.2 1.5 x [m] 0 3 6 9 12 15 y [m] -95 -90 -85 -80 -75 -70 -65 -60 -55 -50 -45 dBm dBm (b) Fig. 5: Receiv ed power results for (a) no reflector , obtained using (left) measurements, and (right) ray tracing simulations; (b) 12 × 12 in 2 flat square aluminum sheet at θ = 45 ◦ , obtained using (left) measurements, and (right) ray tracing simulations. power distribution ov er the grid is similar to as observed for 12 × 12 in 2 square sheet reflector . Ho wev er , compared to the 12 × 12 in 2 reflector , we observe high power beam at larger azimuth angles on the grid, providing more coverage mainly due to large cross-section area of the reflector . The measurement/simulation results show close resemblance of power distribution, though in case of simulations the recei ved power is small and more directed towards the wall. The receiv ed power obtained o ver the grid for 33 × 33 in 2 reflector oriented at 45 ◦ is shown in Fig. 6(b). It can be observed that we ha ve similar po wer distribution as observed Measurements 0.3 0.6 0.9 1.2 1.5 x [m] 0 3 6 9 12 15 y [m] -95 -90 -85 -80 -75 -70 -65 -60 -55 -50 -45 Ray Tracing 0.3 0.6 0.9 1.2 1.5 x [m] 0 3 6 9 12 15 y [m] -95 -90 -85 -80 -75 -70 -65 -60 -55 -50 -45 dBm dBm (a) Measurements 0.3 0.6 0.9 1.2 1.5 x [m] 0 3 6 9 12 15 y [m] -95 -90 -85 -80 -75 -70 -65 -60 -55 -50 -45 Ray Tracing 0.3 0.6 0.9 1.2 1.5 x [m] 0 3 6 9 12 15 y [m] -95 -90 -85 -80 -75 -70 -65 -60 -55 -50 -45 dBm dBm (b) Fig. 6: Recei ved po wer results for (a) 24 × 24 in 2 flat square aluminum sheet at θ = 45 ◦ , obtained using (left) measure- ments, and (right) ray tracing simulations; (b) 33 × 33 in 2 flat square aluminum sheet at θ = 45 ◦ , obtained using (left) measurements, and (right) ray tracing simulations. for 24 × 24 in 2 square sheet reflector . Ho wev er , in comparison to 24 × 24 in 2 square sheet reflector , we observe large po wer at the start of the grid, but weakens slightly near the end of y-grid. T wo reasons can be gi ven for this behavior . First, at a giv en distance of transmitter from reflector, the intensity of the electric field is such that changing the size of the reflector will not play a significant role. Secondly , as the reflector and the receiv er grid are at the same height, we may observe strong reflections from lo wer part of the reflector to wards the ground and causing more destructiv e and constructive interference. Measurements 0.3 0.6 0.9 1.2 1.5 x [m] 0 3 6 9 12 15 y [m] -95 -90 -85 -80 -75 -70 -65 -60 -55 -50 -45 Ray Tracing 0.3 0.6 0.9 1.2 1.5 x [m] 0 3 6 9 12 15 y [m] -95 -90 -85 -80 -75 -70 -65 -60 -55 -50 -45 dBm dBm (a) Measurements 0.3 0.6 0.9 1.2 1.5 x [m] 0 3 6 9 12 15 y [m] -95 -90 -85 -80 -75 -70 -65 -60 -55 -50 -45 Ray Tracing 0.3 0.6 0.9 1.2 1.5 x [m] 0 3 6 9 12 15 y [m] -95 -90 -85 -80 -75 -70 -65 -60 -55 -50 -45 dBm dBm (b) Fig. 7: Recei ved power results for (a) metallic sphere obtained using (left) measurements, and (right) ray tracing simulations; (b) metallic cylinder obtained using (left) measurements, and (right) ray tracing simulations. C. Covera ge with Spherical and Cylindrical Metal Reflectors For the sphere reflector of radius 13 in, the receiv ed po wer on the grid is approximately uniformly distributed at shorter distances as shown in Fig. 7(a), proving that the gain of the spherical reflector is omni-directional. Similarly , for the cylindrical reflector of radius 4 . 5 in and height 18 in shown in Fig. 7(b), the receiv ed power is more uniformly concentrated at shorter distance around the reflector similar to sphere due to circular curved shape of the reflector , div erging the incident beam in different directions. The received power with -90 -80 -70 -60 -50 -40 Received power (dBm) 0 0.1 0.2 0.3 0.4 0.5 0.6 0.7 0.8 0.9 1 CDF Meas. no reflector Meas. 12"x12" reflector Meas. 24"x24" reflector Meas. 33"x33" reflector (a) -90 -80 -70 -60 -50 -40 Received power (dBm) 0 0.1 0.2 0.3 0.4 0.5 0.6 0.7 0.8 0.9 1 CDF Siml. no reflector Siml. 12"x12" reflector Siml. 24"x24" reflector Siml. 33"x33" reflector (b) Fig. 8: CDF of receiv ed power for no reflector , 12 × 12 in 2 , 24 × 24 in 2 , and 33 × 33 in 2 flat square sheet reflectors from (a) measurements, (b) simulations. cylindrical case is higher as compared to sphere due to larger effecti ve area e xposed to the incident beam. This can be validated from the simulation results in Fig. 7 (right). In all e xperiments, the total cross-sectional area of the 24 × 24 in 2 flat sheet reflector, the sphere, and the cylinder were the same. Ho we ver , we observed higher receiv ed po wer in case of 24 × 24 in 2 square flat sheet, due to the larger cross section area exposed to the incident beam when compared to cylinder and sphere. D. CDF of Received P ower with/without Reflector The cumulative distribution function (CDF) plots of re- ceiv ed power for flat sheet reflectors and no reflector are sho wn in Fig. 8. F or no reflector, we ha ve lower received power and lower variance of the received power over the recei ver grid. The 24 × 24 in 2 and 33 × 33 in 2 flat square sheet reflectors hav e similar received po wer and higher as compared to the 12 × 12 in 2 flat square sheet reflector . Moreover , we get a median gain of 20 dB in case of 24 × 24 in 2 and 33 × 33 in 2 square sheet reflectors as compared to no reflector . Simulation results also follow a similar trend as in the empirical results. The receiv ed power CDFs for measurements with sphere and cylinder reflectors are shown in Fig. 9. It can be observed that cylindrical reflector has much larger received power as compared to sphere in case of measurements. On the other hand, ray tracing simulations show larger receiv ed power for the sphere when compared to those that are obtained from measurements. One of the reasons for this beha vior can be due to structural construction of the sphere that are used in experiments, where an aluminum sheet is wrapped on a spherical mirror ball as compared to other reflectors, and solid aluminum sheets are used rather than thicker metal sheets as in other experiments. W e also observe larger variance in the received power in case of simulations as compared to measurements. V . C O N C L U S I O N S In this work, channel measurements at 28 GHz are carried in an NLOS indoor scenario. Passi ve metallic reflectors of different shapes and sizes are used to enhance the receiv ed power , yielding a better signal coverage in the NLOS region. Results sho w that the flat square sheet reflector provides more fa vorable cov erage in NLOS region compared to sphere and cylindrical shaped reflectors, where the latter ones scatter the energy more uniformly at shorter distances. For a giv en rectangular receiver grid, the maximum power is obtained at an azimuth angle of 45 ◦ for flat square sheet reflectors. The measurement results were compared with ray tracing simulations which tend to result in more optimistic coverage. Building on this initial study , our future work includes a more comprehensive measurement campaign in indoor and outdoor en vironments and dev eloping insights on ho w to better characterize measurements using ray tracing simulations. R E F E R E N C E S [1] Federal Communications Commission, “FCC rules for next generation wireless technologies, ” accessed: 1- 12-2018. [Online]. A vailable: https://www .fcc.gov/document/ fcc- adopts- rules- facilitate- next- generation- wireless- technologies [2] K. Haneda, J. Zhang, L. T an, G. Liu, Y . Zheng, H. Asplund, J. Li, Y . W ang, D. Steer, C. Li et al. , “5G 3GPP-like channel models for outdoor urban microcellular and macrocellular en vironments, ” in Pr oc. IEEE V ehic. T echnol. Conf. (VTC) , 2016, pp. 1–7. [3] N. Rupasinghe, Y . Kakishima, and I. G ¨ uvenc ¸ , “System-level perfor- mance of mmwav e cellular networks for urban micro en vironments, ” in Proc. Int. URSI Symposium , Montreal, Canada, Aug. 2017. [4] Electromagnetism Lecture, “W aves in conductors, ” accessed: 1-25-2018. [Online]. A vailable: https://www2.ph.ed.ac.uk/ ∼ playfer/EMlect15.pdf [5] NASA, “Satellites as communication relays, ” accessed: 1-12-2018. [Online]. A vailable: https://history .nasa.gov/conghand/commsat.htm [6] J. L. Ryerson, “Passi ve satellite communication, ” Pr oceedings of the IRE , vol. 48, no. 4, pp. 613–619, Apr. 1960. [7] Y . E. Stahler, “Corner reflectors as elements passiv e communication satellites, ” IEEE T rans. Aer ospace , vol. 1, no. 2, pp. 161–172, Aug. 1963. [8] R. D. Thro wer, “Radio mirrors for communications, ” accessed: 1- 12-2018. [Online]. A vailable: http://www .long- lines.net/places- routes/ Thurmont repeater/EW0569- 27.html [9] J. L. D. L. T . Barreiro and F . L. E. Azpiroz, “Passi ve reflector for a mobile communication de vice, ” US Patent 7,084,819, Aug. 2006. -90 -80 -70 -60 -50 Received power (dBm) 0 0.1 0.2 0.3 0.4 0.5 0.6 0.7 0.8 0.9 1 CDF Meas. no reflector Meas. cylinder Meas. sphere (a) -90 -80 -70 -60 -50 Received power (dBm) 0 0.1 0.2 0.3 0.4 0.5 0.6 0.7 0.8 0.9 1 CDF Siml. no reflector Siml. cylinder Siml. sphere (b) Fig. 9: CDF of receiv ed power for cylinder and sphere reflectors obtained using (a) measurements, (b) simulations. [10] G. Kizer , Digital microwave communication: engineering point-to-point micr owave systems . John W iley & Sons, 2013. [11] M. Heino, C. Icheln, and K. Haneda, “Reflector design to mitigate finger effect on 60 GHz user devices, ” in Proc. Eur opean Conf. Antennas Pr opag. (EUCAP) , March 2017, pp. 151–155. [12] A. A. Goulianos, T . H. Barratt, W . Y uan, S. Zhang, M. A. Beach, A. R. Nix, E. Mellios, P . Cain, M. Rumney , and T . Masson, “T ime- domain sounder validation and reflecti vity measurements for mm-W ave applications, ” in Pr oc. IEEE W ireless Commun. Netw . Conf. (WCNC) , Apr . 2016, pp. 1–5. [13] Z. Peng, L. Li, M. W ang, Z. Zhang, Q. Liu, Y . Liu, and R. Liu, “ An effecti ve cov erage scheme with passive-reflectors for urban millimeter- wav e communication, ” IEEE Ant. W ireless Propag . Lett. , vol. 15, pp. 398–401, 2016. [14] National Instruments, “mmW ave transceiver system, ” accessed: 1-15- 2018. [Online]. A vailable: http://www .ni.com/sdr/mmwav e/ [15] Radartutorial.eu, “Radar basics, ” accessed: 1-16-2018. [Online]. A vail- able: http://www .radartutorial.eu/01.basics/Radar%20Cross%20Section. en.html [16] Sage Millimeter , Inc , “WR-34 pyramidal horn antenna, ” accessed: 1- 10-2018. [Online]. A vailable: https://www .sagemillimeter .com/content/ datasheets/SAR- 1725- 34KF- E2.pdf
Original Paper
Loading high-quality paper...
Comments & Academic Discussion
Loading comments...
Leave a Comment