Enhancing performance of coherent OTDR systems with polarization diversity complementary codes
Monitoring the optical phase change in a fiber enables a wide range of applications where fast phase variations are induced by acoustic signals or vibrations in general. However, the quality of the estimated fiber response strongly depends on the met…
Authors: Christian Dorize, Elie Awwad
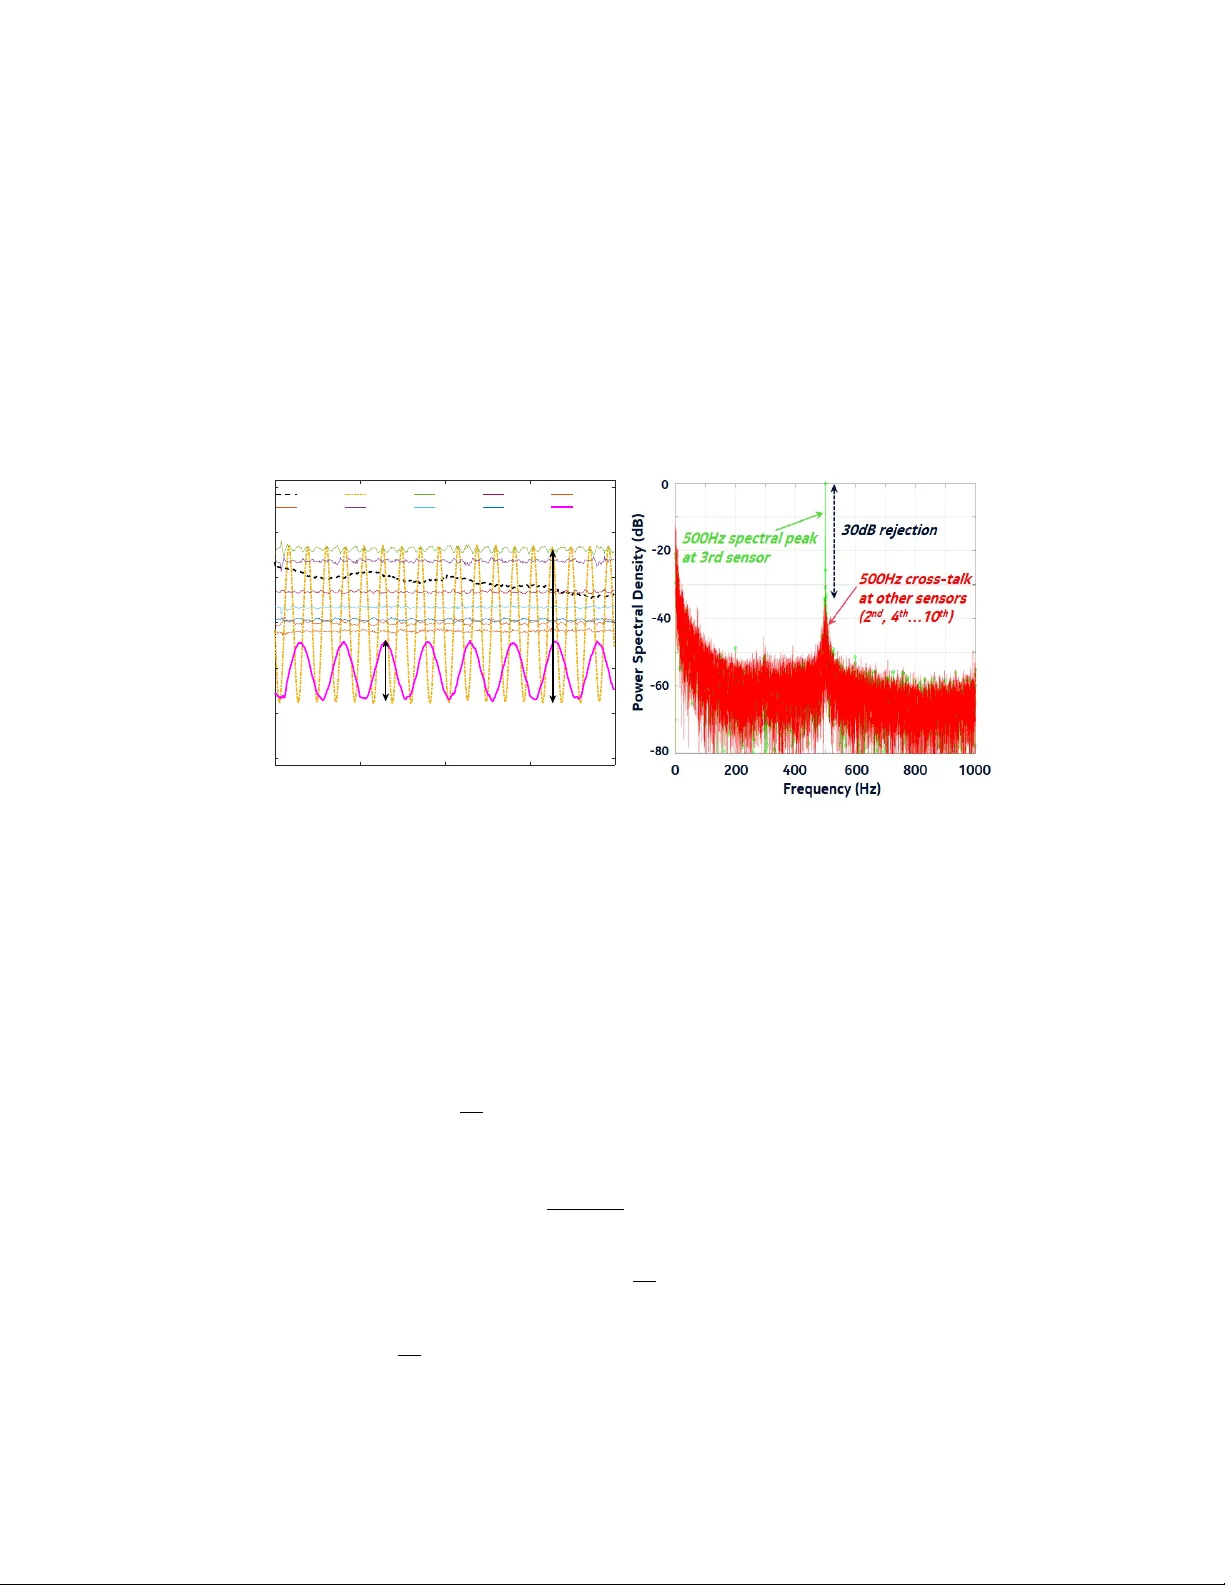
E n h a n c i n g p e r f o r m a n c e o f co he re nt O T D R s y s t e m s w i t h p o l a r i z a t i o n d i v e r s i t y c o m p l e m e n t a r y c od es C H R I S T I A N D O R I Z E 1 , 2 A N D E L I E A W W A D 1 , 3 1 Nokia Bell Labs P aris-Saclay, 1 route de V illejust, 91620 N ozay, FRANCE 2 c hristian.dorize@nokia-bell-labs.com 3 elie.awwad@nokia-bell-labs.com Abstract : Monitoring the optical phase change in a fiber enables a wide rang e of applications where fas t phase variations are induced by acoustic signals or vibrations in general. Ho w e v er , the quality of the estimated fiber response strongl y depends on the method used to modulate the light sent to the fiber and capture the variations of the optical field. In this paper , w e show that distributed optical fiber sensing sys tems can advantag eously e xploit techniq ues from the telecommunication domain, as those used in coherent optical transmission, to enhance their performance in detecting mechanical e v ents, while jointly offering a simpler setup than widespread pulse-cloning or spectral-sweep based schemes with acous to-optic modulators. W e per iodicall y capture an ov erall fiber Jones matr ix estimate thanks to a nov el probing technique using tw o mutuall y orthogonal complementar y (Golay) pairs of binary sequences applied simultaneously in phase and quadrature on two or thogonal polarization states. A per f ect channel response estimation of the sensor ar ra y is achie v ed, subject to conditions detailed in the paper, thus enhancing the sensitivity and bandwidth of coherent φ -OTDR sys tems. High sensitivity , linear response, and bandwidth cov erage up to 18 kHz are demonstrated with a sensor array composed of 10 fiber Bragg gratings (FBGs). © 2021 Optical Society of Amer ica under the terms of the OS A Open A ccess Publishing Agreement OCIS codes: (060.2370) Fiber optics sensors; (280.4788) Optical sensing and sensors. References and links 1. A. Masoudi and T . P . New son, “Contr ibuted Re view: Distributed optical fibre dynamic strain sensing, ” Revie w of Scientific Instr uments 87 (1), 011501 (2016). 2. L. P almieri and L. Schenato, “Distributed optical fiber sensing based on Ray leigh scattering, ” The Open Optics Journal 7 (1), 104–127 (2013). 3. Y . Shi, H. Feng and Z. Zeng, “ A long distance phase-sensitiv e optical time domain reflectometer with simple structure and high locating accuracy , ” Sensors 15 (9), 21957–21970 (2015). 4. G. Y ang, X. Fan, S. W ang, B. W ang, Q. Liu and Z. He, “Long-Range Distributed Vibration Sensing Based on Phase Extraction From Phase-Sensitive OTDR, ” IEEE Photonics Jour nal 8 (3), 1–12 (2016). 5. X. F an, G. Y ang, S. W ang, Q. Liu and Z. He, “Distr ibuted Fiber -Optic Vibration Sensing Based on Phase Extraction From Optical Reflectometry , ” J. Lightw . T echnol. 35 (16), 3281–3288 (2017). 6. D. Chen, Q. Liu, X. Fan, Z. He, “Distributed fiber -optic acoustic sensor with enhanced response bandwidth and high signal-to-noise ratio,” J. Lightw . T echnol. 35 (10), 2037–2043 (2017). 7. H. F . Mar tins, K. Shi, B. C. Thomsen, S. M.-Lopez, M. G.-Herraez and S. J. Sav or y , “R eal time dynamic strain monitoring of optical links using the backreflection of live PSK data,” Opt. Express 24 (19), 22303–22318 (2016). 8. Q. Y an, M. Tian, X. Li, Q. Y ang and Y . Xu, “Coherent φ -OTDR based on polarization-diversity integrated coherent receiv er and heterodyne detection, ” in IEEE 25th Optical Fiber Sensors Conf erence (OFS), 1–4 (2017). 9. K. Kik uc hi, “Fundamentals of coherent optical fiber communications, ” J. Lightw . T echnol. 34 (1), 157–179 (2016). 10. F . Zhu, Y . Zhang, L. Xia, X. Wu and X. Zhang, “Improv ed φ -OTDR sensing system for high-precision dynamic strain measurement based on ultra-weak fiber Bragg g rating array , ” J. Lightw . T echnol. 33 (23), 4775–4780 (2015). 11. F .A.Q. Sun, W . Zhang, T . Liu, Z. Y an and D. Liu, “Wideband fully -distributed vibration sensing by using UWFBG based coherent OTDR, ” in IEEE/OSA Optical Fiber Communications Conference and Exhibition (OFC), 1–3 (2017). 12. M. Golay , “Complementar y series,” in IRE Transactions on Information Theory 7 (2), 82–87 (1961). 13. M. Nazarath y , S.A. Ne wton, R.P . Giffard, D.S. Moberl y , F . Sischka, W .R. Trutna and S. Foster , “Real-time long range complementary cor relation optical time domain reflectometer, ” J. Lightw . T echnol. 7 (1), 24–38 (1989). 14. X. Huang, “Complementar y Properties of Hadamard Matrices,” in Inter national Conference on Communications, Circuits and Systems, 588–592 (2006). 15. R. Posey , G. A. Johnson and S. T . V ohra, “Strain sensing based on coherent Ray leigh scatter ing in an optical fibre,” Electronics Letters 36 (20), 1688–1689 (2000). 1. Introduction Fiber optic sensors, being intr insicall y immune to electromagnetic interference and f air ly resistant in harsh environments, meet a g ro wing interest in monitor ing applications (structural health monitoring, railwa y surveillance, pipeline monitor ing...). Distributed fiber optic sensors based on optical reflectometry make use of a variety of light scatter ing effects occur ring in the fiber such as Raman, Brillouin, and Ra y leigh backscattering to measure temperature (with an y of the three effects) or mechanical variations such as strains (onl y with the two latter) [1]. Optical fiber sensors may also be customized or enhanced b y per iodicall y inscr ibing fiber Bragg gratings (FBGs) to amplify the backscattered optical field [1] resulting in a quasi-distributed system with a resolution fix ed b y the distance betw een gratings. The main character is tics of a distr ibuted sensor are its sensitivity , spatial resolution and maximum reach. Another impor tant f eature f or dynamic phenomena distributed sensing is the bandwidth of the mechanical ev ents that the sensor is able to detect, which is closel y related to the targ eted sensitivity and the sensor length. Det ecting and quantifying sound wa ves and vibrations, kno wn as distributed acoustic sensing (D AS) or distributed vibration sensing (D V S) is cr itical in areas of geoph ysical sciences and surveillance of sensitiv e sites or infrastructures. Phase and coherent optical-time-domain (resp. optical-frequency -domain) reflectometr y (OTDR, resp. OFDR) sys tems are usually based on an inter rog ator sending one or more shor t light pulses or frequency sw eeps [2 – 5]. The detector consists of a simple photodiode if, for instance, two pulses at slightl y different frequencies are separately launched in the sensing fiber [1]. In case single pulses are sent, an imbalanced Mach-Zehnder interf erometer and a phase detector , or a balanced coherent detector that mix es the backscattered pulse with a local oscillator are used at the receiver side to detect relativ e phase chang es in the Ray leigh backscattered optical field [1, 3 – 5]. The main limitations of these phase-OTDR sys tems are firstl y a trade-off betw een the spatial resolution and the maximum reach, giv en that a high spatial resolution f orces the use of short pulses resulting in a lo w signal-to-noise ratio, secondly a trade-off betw een maximum reach and the co vered mec hanical bandwidth, the latter being equal to half of the scanning rate of the pulses. A reflectometry scheme based on the injection of se v eral linear -frequency-modulated probe pulses was sugg ested in [6] to relax these tw o trade-offs, show casing a 9 kHz bandwidth with a 10 m resolution o v er a 24 . 7 km -long fiber . Ho w e v er, the inter rog ators in these schemes all rel y on individual probing pulses generated b y acousto-optic modulators or e v en more complex structures. The y are also vulnerable to polarization fading effects giv en that the Ray leigh backscattered light is polar ization dependent. A dual-polar ization coherent receiver allowing to detect all the backscattered inf ormation by projecting the received optical field o ver tw o orthogonal polar ization states can fix this problem as sho wn in recent w orks [7, 8]. In order to fur ther relax the reach-spatial resolution trade-off, our approach in this paper consists in continuously probing the sensor using a training sequence that modulates the optical carr ier injected in the fiber , as done in [7]. While random binar y sequences modulate tw o polarization states to probe a 500 m -long sensor and detect a sinusoidal strain of 500 Hz in [7], a perf ect optical channel es timation can onl y be reached asymptoticall y f or very larg e sequences. Hence, w e design in this w ork optimized probing sequences of finite length allo wing to extend the cov ered bandwidth. The proposed D AS scheme consis ts in transmitting polar ization- multiple x ed coded sequences designed from complementar y Golay pairs, and detecting the backscattered optical signal using a polarization-diversity coherent receiv er typically used in optical fiber transmission systems [9] f ollow ed by a cor relation-based pos t-processing to extract the channel response. As is w ell known, Ra y leigh bac kscattering is randomly distributed along the fiber and the distributed scatterers reflect different amounts of ener gy . For this reason, in order to concentrate on the performance of the proposed interrogator , the experimental par t of this paper f ocuses on a fiber sensor with explicit and deterministic bac k -reflectors using per iodicall y inserted FBGs that tur n the fiber into a sensor array , as in [10, 11], with a resolution of 10 m . W e sho w that the proposed D AS solution is capable of spatially resolving up to 18 kHz dynamic strains e v en after displacing the sensor ar ra y by 25 km of SMF . The paper is organized as f ollo ws: in section 2, we introduce the theor y under pinning the coded sequences designed to scan the sensor ar ra y through polarization multiple xing; in section 3, w e describe the e xper imental setup built to test the D AS sys tem; the results are given in section 4 in static mode first to quantify the noise limits, f ollow ed by a dynamic mode anal ysis during which the sensor array is perturbed at two different locations b y tw o independent vibrations. 2. Theory 2.1. Notation In the f ollo wing, ∗ and ⊗ operators denote the con v olution and the cor relation operators respectiv el y ; δ ( t ) stands f or the delta function. The cor relation and con v olution between signals a ( n ) and b ( n ) are related since a ( n ) ⊗ b ( n ) = a ( n ) ∗ b ∗ (− n ) , b ∗ standing f or the conjugated complex of b and n being a time index. E t x and E t y (resp. E r x and E r y ) denote the two polarization tributar ies of the optical field at the transmitter side (resp. receiv er side). The optical field v ector generated at the transmitter side is giv en b y: − → E t ( n ) = A t x ( n ) e xp ( i φ t x ( n )) A t y ( n ) e xp ( i φ t y ( n )) e xp ( i 2 π ν 0 n T S + φ 0 ( n )) , n = [ 1 . . . N ] (1) where A t x , A t y are the modulated amplitudes of the x- and y- polar ization tr ibutaries, φ t x , φ t y are the modulated phases of the x- and y- polarization tr ibutaries, ν 0 is the optical car rier frequency , φ 0 is the phase noise generated b y the laser and T S the symbol duration. The impulse response of a fiber section is represented by a 2 × 2 Jones matrix: H = h x x h x y h y x h y y (2) where h x x , x y , y x , y y are comple x numbers descr ibing the relation between the polarization tributar ies at the input and output of a fiber section. The location and characterization of any mec hanical e x citation impacting the sensor ar ra y is e xtracted from the space-time table of impulse responses periodically estimated at eac h fiber ar ra y section. 2.2. Design of polarization-diversity coded sequences Our objectiv e is tw of old: achie ving a perfect es timate of the Jones matr ix impulse response and maximizing the number of estimates per time unit to enhance the co v ered mechanical bandwidth. Let us consider two real binary sequences of size N G each that f or m a complementar y , or Gola y , pair [12] such as: G a 1 ( n ) ⊗ G a 1 ( n ) + G b 1 ( n ) ⊗ G b 1 ( n ) = δ ( n ) (3) Thanks to the abo ve complementar y proper ty , probing a channel with such a sequence pair allo w s f or a perf ect impulse response estimation in case of a basic single-in put-single-output channel. Practically , the transmission of the two complementary sequences is applied successivel y in time and the response estimation is e xtracted after a cor relation-based pos t-processing at the receiver side [13]. Notice that perf ect estimation requires that the c hannel remains stationary dur ing the o v erall probing time. A natural e xtension of the single-input-single-output channel case to the 2 × 2 Jones matrix impulse response consists in successiv ely probing each of the two polar ization tr ibutaries by means of the abov e procedure. How ev er , it still extends the probing time, thus reducing the number of impulse response estimations per second and impacting the sys tem bandwidth. T oda y’ s optical transmission sys tems, based on coherent technology , use a polar ization div ersity transmitter and receiver to jointl y propagate independent signals onto each of the tw o or thogonal polarization axes. This polarization degree of freedom is generall y underused in the fiber sensing domain. T o the authors know ledge, the sole work that considered polarization div ersity at the transmitter and at the receiver side is [7]. Our purpose is to study , for complementar y codes, the conditions to achiev e a per f ect Jones matr ix estimation with a simultaneous probing of the two polar ization axes, thus keeping the channel stationarity constraint the same as f or a single-input-single-output c hannel. During a per iod of N symbol times, we modulate the x (resp. y ) polar ization of the optical signal at the transmitter side b y N G -long sequences G x ( n ) = G x I ( n ) + i G x Q ( n ) (resp. G y ( n ) = G y I ( n ) + i G y Q ( n ) ) at a given symbol-rate F S = 1 / T S , and send zeros dur ing the remaining N − N G slots. Hence: E t x , t y ( n + k N ) = ( G x I , y I ( n ) + i G x Q , y Q ( n ) if n mod N ≤ N G 0 else where (4) Let E r x ( n ) and E r y ( n ) be the sampled outputs of a coherent polarization diversity receiver at a rate of one sample per symbol. They are giv en by the con v olution of the transmitted signal and the impulse response of the sensor ar ra y : E r x ( n ) = h x x ( n ) ∗ E t x ( n ) + h x y ( n ) ∗ E t y ( n ) E r y ( n ) = h y x ( n ) ∗ E t x ( n ) + h y y ( n ) ∗ E t y ( n ) (5) In the f ollo wing, w e only de velop E r x ( n ) f or sak e of simplicity since a similar procedure can be applied to E r y ( n ) . At the receiver side, a correlation is per f or med betw een the received signal E r x ( n ) and the code sent o v er E t x ( n ) to extract h 0 x x ( n ) the estimate of h x x ( n ) : h 0 x x ( n ) = E r x ( n ) ⊗ G x I ( n ) + i G x Q ( n ) = h x x ∗ ( G x I + i G x Q ) + h x y ∗ ( G y I + i G y Q ) ⊗ G x I + i G x Q = h x x ∗ ( G x I + i G x Q ) ⊗ ( G x I + i G x Q ) + h x y ∗ ( G y I + i G y Q ) ⊗ ( G x I + i G x Q ) = h x x ∗ ( G x I ⊗ G x I + G x Q ⊗ G x Q + i ( G x Q ⊗ G x I − G x I ⊗ G x Q )) + h x y ∗ ( G y I ⊗ G x I + G y Q ⊗ G x Q + i ( G y Q ⊗ G x I − G y I ⊗ G x Q )) = h x x ( n ) ∗ ( g 0 x ( n ) + i g 1 x ( n )) + h x y ( n ) ∗ ( g 2 x ( n ) + i g 3 x ( n )) (6) where w e par tiall y dropped the n index for clarity and define the follo wing sequences: g 0 x ( n ) = G x I ( n ) ⊗ G x I ( n ) + G x Q ( n ) ⊗ G x Q ( n ) g 1 x ( n ) = G x Q ( n ) ⊗ G x I ( n ) − G x I ( n ) ⊗ G x Q ( n ) g 2 x ( n ) = G y I ( n ) ⊗ G x I ( n ) + G y Q ( n ) ⊗ G x Q ( n ) g 3 x ( n ) = G y Q ( n ) ⊗ G x I ( n ) − G y I ( n ) ⊗ G x Q ( n ) (7) Hence, the conditions f or perfect es timation of h x x ( n ) , i.e. E h 0 x x ( n ) = h x x ( n ) are: g 0 x ( n ) = δ ( n ) , g 1 x ( n ) = g 2 x ( n ) = g 3 x ( n ) = 0 (8) Similarl y , E r x ( n ) is cor related with the code sent o v er E t y ( n ) to extract h 0 x y ( n ) : h 0 x y ( n ) = E r x ( n ) ⊗ G y I ( n ) + i G y Q ( n ) = h x x ∗ ( G x I ⊗ G y I + G x Q ⊗ G y Q + i ( G x Q ⊗ G y I − G x I ⊗ G y Q )) + h x y ∗ ( G y I ⊗ G y I + G y Q ⊗ G y Q + i ( G y Q ⊗ G y I − G y I ⊗ G y Q )) = h x x ( n ) ∗ ( g 2 y ( n ) + i g 3 y ( n )) + h x y ( n ) ∗ ( g 0 y ( n ) + i g 1 y ( n )) (9) Ag ain, the conditions f or perfect es timation of h x y ( n ) come down to: g 0 y ( n ) = δ ( n ) , g 1 y ( n ) = g 2 y ( n ) = g 3 y ( n ) = 0 (10) De v eloping the cor relation equations with E r y instead of E r x to estimate h y x ( n ) and h y y ( n ) yields the same conditions as those in Eqs. (8) and (10) . T o build polar ization-multiple x ed training sequences satisfying these conditions, let us consider tw o mutually orthogonal complementar y pairs of Golay sequences { G a 1 , G b 1 } and { G a 2 , G b 2 } : G a 1 ( n ) ⊗ G a 2 ( n ) + G b 1 ( n ) ⊗ G b 2 ( n ) = 0 G a 1 ( n ) ⊗ G b 1 ( n ) + G a 2 ( n ) ⊗ G b 2 ( n ) = 0 (11) The proof of e xistence of mutuall y orthogonal pairs of complementar y sequences can be f ound in [14]. One basic e xample set of sequences of size N G = 4 satisfying these properties is: G 4 a 1 = [ 1 , − 1 , − 1 , − 1 ] , G 4 b 1 = [ − 1 , 1 , − 1 , − 1 ] , G 4 a 2 = [ − 1 , − 1 , 1 , − 1 ] , G 4 b 2 = [ 1 , 1 , 1 , − 1 ] . Larg er sequences of length N G = 2 p + 2 , p ≥ 1 are derived recursiv ely : G N G a 1 = h G N G / 2 a 1 , G N G / 2 b 1 i G N G b 1 = h G N G / 2 a 1 , − G N G / 2 b 1 i G N G a 2 = h G N G / 2 a 2 , G N G / 2 b 2 i G N G b 2 = h G N G / 2 a 2 , − G N G / 2 b 2 i (12) W e now study the feasibility of polar ization-multiple xed transmission of training sequences jointly satisfying proper ties (3) and (11) to achiev e perfect impulse response estimation of the Jones matrix, then we define the mapping of these sequences ov er binar y modulation f ormats. First, w e modulate one polarization channel and set the other polarization to zero. T o measure h x x ( n ) and h y x ( n ) , the two sequences of a single Golay pair { G a 1 , G b 1 } are transmitted successivel y through a binary phase shift ke ying (BPSK) modulation (one coded bit per symbol {− 1 , 1 } ) on G x I ( n ) while G x Q ( n ) = G y I ( n ) = G y Q ( n ) = 0 resulting in g 1 x ( n ) = g 2 x ( n ) = g 3 x ( n ) = 0 and g 0 x ( n ) = G x I ( n ) ⊗ G x I ( n ) . The transmitted signal can be expressed as: E t x ( n + k N ) = G a 1 ( n ) 0 ≤ n < N G 0 N G ≤ n < N G + N s e p G b 1 ( n − N G − N s e p ) N G + N s e p ≤ n < 2 N G + N s e p 0 2 N G + N s e p ≤ n < N (13) The code is defined as the tw o complementary sequences sent successivel y with a guard interval of length N s e p f ollo wing each sequence, as shown in the upper par t of Fig. 1(a). The code per iodicity is then N = 2 ( N G + N s e p ) symbols. The upper par t of Fig. 1(b) show s the periodic auto-cor relation of this code highlighting a zero-auto-cor relation zone in the range −( N G / 2 + N s e p ) < n < ( N G / 2 + N s e p ) . This finite zero-correlation zone translates into a constraint on the impulse response of the sensor ar ra y: to achie v e per f ect estimation of h x x and h x y , the sensor ar ra y channel response must spread o v er a time T I R < ( N G / 2 + N s e p ) T S . Moreo v er , N s e p can be set to 0 yielding N = 2 N G , consequently maximizing the duty cy cle. Hence, the sensor array can be continuously inter rog ated with a per iodic code made of two complementary sequences sent successivel y such that T c od e = N T S > 4 T I R . 0 10 20 30 40 50 60 70 -1 -0.5 0 0.5 1 G xI 0 10 20 30 40 50 60 70 -1 -0.5 0 0.5 1 G yI N sep N G G b1 G a1 N G b2 G a2 (a) -60 -40 -20 0 20 40 60 -5 0 5 10 15 g 0x =G xI G xI -60 -40 -20 0 20 40 60 Delay offset / s -5 0 5 10 15 g 2x =G yI G xI -(N G /2+N sep ) T I R . 2.3. Optical phase e xtraction from Jones matrix Ev en though w e estimated the full Jones matr ix of each fiber segment, we f ocus in this work only on the optical phase φ that can be computed as half the phase of the deter minant of the dual-pass Jones matrix of each segment at the subsequent FBG reflector: φ = 0 . 5 ∠ ( h 0 x x h 0 y y − h 0 x y h 0 y x ) (15) The phase is periodically estimated to capture its ev olution at each sensor and at consecutiv e times, achie ving a spatio-temporal map of the mechanical/acoustic e v ents sur rounding the sensor array with a spatial resolution of d s and an estimate computed each T c od e seconds. Being interested in the phase ev olution in each fiber segment, the differential phase can be computed with the first reflected phase selected as a reference. 3. Experimental setup The e xperimental test-bed consists of a coherent transmitter and receiv er - similar to the ones used in long-haul optical communication sys tems - f or ming the interrogator , and connected to the sensor array through an optical circulator as sho wn in F ig. 3. The light from a RIO TM laser with a linewidth of 600 Hz emitting a pow er of 10 dBm at λ 0 = 1549 . 1 nm is split into two to be used as a carr ier at the transmitter and a local oscillator at the receiver (self-homodyne configuration). The sensor ar ra y consists of 10 FBGs with a reflectivity of 10 − 3 separated b y 10 m of fiber . The dual path optical dela y betw een two d s -spaced FBG reflectors is τ s = 2 n g d s / c . The symbol duration T S has to be selected to fulfil T S = τ s / K where K ≥ 1 is an integer . For d s = 10 m , the symbol rate 1 / T S has to be chosen as a multiple of 40 MHz. At the transmitter side, the carr ier is modulated using a dual-polarization I/Q Mach-Zehnder modulator . Four RF signals accounting for the in-phase and quadrature components of each polarization are generated at various symbol rates (multiples of 40 MHz ) and amplified bef ore reaching the modulator . The probing sequences are continuously g enerated without an y guard band. The modulated optical signal is then injected in the sensor array through a circulator . Hig h c ohe re nc e L a se r sourc e Dua l - pol c ohe re nt mi x e r D ig ital post - proc e ssi ng P ulse Patt e rn Ge ne ra tor C i r cul at or S c ope P robing S e que nc e Ge ne ra ti on O pti cal phase v er sus t i m e r es ponse per se nsor I/ Q m o d I/ Q m o d LO Sig nal P I N P I N P I N P I N Pol H Pol V RIO TM , LW <1kH z, 11dBm pow er Sensor ar r ay ( i nsi de i nsul at i o n box) ( 10 FB G s wit h 10 - 3 re f l ec t i vi t y at 1549.1nm , and 10m s epar at i on) 2 nd lo w fre q . g e n e ra to r 2 nd P E A 1 st lo w fre q . g e n e ra to r 1 st P E A F B G1 F B G3 F B G1 0 Fig. 3. Experimental Setup (PEA: piezoelectric actuator). The reflected light from the FBGs goes through a circulator to wards a dual-polarization coherent mix er used to detect the in-phase and in-quadrature components ov er two polarization states. The different interfering optical signals are detected by balanced photodiodes of 1 . 6 GHz bandwidth and the f our RF signals I X , Q X , I Y , Q Y are sampled at 500 MSa/s b y an oscilloscope during a measurement windo w T a cq . The sensor ar ra y is inser ted in a mechanicall y -insulated box to isolate it from the lab environment (acoustic and mechanical vibrations from lab occupants, fans of various instruments, ...). T o accurately quantify the per f or mance of our sensing sy stem, tw o independent mechanical s timuli are applied at two different locations: one between the second and third FBG (approximatel y at 25 m from the circulator) and another between the ninth and tenth FBG (around 95 m from the circulator). At these locations, 1 . 5 m of fiber is coiled around a cylindrical piezoelectric actuator having an outer diameter of 5 cm . The actuators are ex cited b y frequency generators with sinusoidal tones with peak -to-peak amplitude V p p 1 , p p 2 and frequencies f e 1 , e 2 . 4. Experimental results 4.1. Static regime As a first s tep, w e chec k the phase stability as a function of time at eac h FBG reflector without appl ying an y mechanical e x citation. The sensing ar ra y , placed in its insulated box, is continuousl y probed at a symbol rate of 160 MSymbol / s . Figure 4(a) show s the signal intensity captured at the receiv er side after a correlation process f or one transmitted code. The peaks correspond to the reflections on each of the 10 FBG separated by 10 m of fiber (cor responding to 0 . 1 µ s round trip delay). The optical phase of the signal reflected at each FBG is e xtracted from the Jones matrix at each peak location and the procedure is per iodicall y repeated f or eac h receiv ed code. T o quantify the phase stability in static mode, w e measure the standard deviation (std) of the phase at each FBG ov er a time frame of 20 ms . A capture of the estimated phases in static mode is 1000 1200 1400 1600 1800 Time index 0 0.1 0.2 0.3 0.4 0.5 Normalized received power (a) 0 5 10 15 Time (ms) -3 -2 -1 0 1 2 3 Estimated phase (rad) FBG 1 FBG 2 FBG 3 FBG 4 FBG 5 FBG 6 FBG 7 FBG 8 FBG 9 FBG 10 (b) Fig. 4. (a) Measured intensities at the receiver side. (b) Estimated phases in static mode. sho wn in Fig. 4(b) f or the ten FBGs. Note that the first FBG ser v es as the optical phase ref erence from which the differential phase at the next FBGs is extracted; the phase of the first FBG is thus ignored in the follo wing analy ses. For eac h measurement, we record an a v erage standard deviation b y av eraging the std v alues at the nine FBGs. The receiv ed signal po w er at the input of the coherent mixer is measured at − 27 dBm . Ne xt, we measure this a verag e std for v arious lengths of the probing code. The choice of the code length is dr iv en by the trade-off betw een the measurement noise and the coherence length of the laser source: when probing the sensor ar ra y with a very shor t code, the collected ener gy o v er a single code is lo w which makes us vulnerable to the receiv er noise; conv ersely , a very long code spreads o v er a duration that ex ceeds the coherence time of the laser source which in v alidates the phase ref erence and the relative phases computed subsequentl y . This is illustrated in Fig. 5(a) where the phase standard deviation increases on the left edge (f or codes shor ter than 3 µ s and on the right edge (f or codes long er than 3 ms ) because of the cor relation noise and of the coherence loss respectivel y . The used laser source - dedicated to sensing applications - has a 600 Hz line width, corresponding to a coherence time of 0 . 5 ms . Betw een these tw o limits, the standard de viation of the phase is relativ el y constant around 10 mrad . 0.00 0.02 0.04 0.06 0.08 0.10 1 10 100 1000 10000 Phase s td d e v ( r ad ) Tc o d e ( µ s) (a) 0.00 0.05 0.10 0.15 0.20 0.25 0.30 0.35 0.40 -52 -47 -42 -37 -32 -27 Ph ase std d ev ( r ad ) Rx po w e r l e v e l (d Bm ) (b) Fig. 5. (a) Standard deviation of estimated phases as a function of code length. (b) Standard deviation of estimated phases as a function of signal po wer at the receiver input. Later on, we tes t the dependence of this result to the optical pow er of the signal at the input of the coherent receiver b y fixing the code length to 3 . 2 µ s and varying the signal pow er lev el from − 27 dBm do wn to − 52 dBm . The local oscillator po wer was fixed to 7 dBm . In a dual-polar ization coherent receiver used in a homodyne configuration, the detected in-phase and in-quadrature photocur rents at the outputs of the balanced photodiodes I I and I Q f or the tw o polar ization states X and Y are giv en b y : I I , X / Y ∝ p P S , X / Y P L O , X / Y cos ( φ X , Y + φ L O ) + η I , X / Y I Q , X / Y ∝ p P S , X / Y P L O , X / Y sin ( φ X , Y + φ L O ) + η Q , X / Y (16) where P S , X / Y is the optical po w er of the signal projected on the X (resp. on the Y ) polarization ax es of the receiver , P L O , X / Y is the optical pow er of the local oscillator projected on the X (resp. on the Y ) polarization, φ X , Y stands for the optical phase of the signal projected on the X (resp. on the Y ) polar ization, φ L O is the laser phase noise, and η I / Q , X / Y is an additiv e white Gaussian noise added at the receiver side (a combination of shot noise and ther mal noise). Figure 5(b) sho ws that the phase stability slo w l y deteriorates when reducing the signal pow er down to − 48 dBm at the receiv er input. This slo w decrease was in v estig ated through numerical simulations to study the noise sources at the receiv er side and was f ound to be mainl y due to a limitation imposed b y relativ e intensity noise (RIN) of the laser and shot noise at the photodiodes rather than thermal noise. The swift r ise of the std belo w − 48 dBm is due to a phase unwrapping problem when phase variations become too high. 0 0.02 0.04 0.06 0.08 0.1 0.12 0 10 20 30 Phase v ar i an c e ( r ad 2 ) D i stan c e ( km) Fig. 6. S tandard deviation of estimated phases as a function of reac h. Another impor tant feature of an optical fiber sensing sys tem is its reach or the maximum distance that can be co v ered. In our scheme, the reach limit is giv en by the increase in phase noise f or increased round-trip distances. T o assess the reach, fiber spools of increasing lengths were added betw een the interrogator and the sensor array , and the av erage standard deviation of the estimated phases w ere computed f or each length. Figure 6 sho w s the obtained results. The used code length was 82 µ s , and the obser v ation windo w fix ed to 40 ms . A tenf old degradation of the standard deviation is obser v ed when moving from 0 to a one-w a y distance of 25 km . Fur thermore, be y ond 34 km , the estimated phases are cor rupted by a phase noise with much larg er phase variance resulting from phase unwrapping errors (round-tr ip dis tance of 68 km approaching the coherence length of the laser source (around l c = c f /( π ∆ ν ) = 100 km for ∆ ν = 600 Hz ). 4.2. Dynamic regime The sensor ar ra y is no w tested in dynamic mode by means of tw o identical piezoelectric actuators placed at 25m and 95m from the sensor input. The used actuator is a 5 cm -outer -diameter r ing with a radial efficiency of 400 pm / V . 1 . 5 m of fiber is wound around each piezo, leading to 25 nm of fiber e xtension per one volt of ex citation v oltage. W e measured a phase shift of 1 radian f or a 75 nm fiber e xtension obtained b y applying an e x citation of 3 V olts. As a first test, we simultaneousl y apply a 500 Hz (resp. 200 Hz ) sine wa ve with a 10 Vpp (resp. 4 Vpp ) magnitude on the first (resp. second) actuator . The sensor array is probed with a 82 µ s -long PDM-QPSK code. Figure 7(a) show s the phase measured as a function of time at each of the 10 FBGs. The black dotted curve represents the absolute phase measured at the first FBG. More interesting are the phase ev olutions captured at the third and tenth FBGs: both sine wa ves are easil y identified and their magnitudes are simply scaled b y the radial efficiency of the actuator . Fur thermore, phases measured at the other FBG locations are stable as a function of time, pro ving the absence of crosstalk betw een sensors. W e per f ormed additional measurements with a single activ e actuator e xcited b y a 500 Hz sine w a v e to quantify the minimum rejection o v er all the remaining unex cited segments and measured a crosstalk rejection lev el of − 30 dB as sho wn in Fig. 7(b). 0 10 20 30 40 Time (ms) -3 -2 -1 0 1 2 3 Estimated phase (rad) FBG 1 FBG 2 FBG 3 FBG 4 FBG 5 FBG 6 FBG 7 FBG 8 FBG 9 FBG 10 10 th sensor 200 Hz 1.3 rad pp 3 rd sensor 500 Hz 3.3 rad pp (a) (b) Fig. 7. (a) Distr ibuted sensing capability showing lo w crosstalk between sensors. (b) Crosstalk lev el at other sensors when onl y a single one is ex cited. Later on, the ev olution of the phase magnitude as a function of the e x citation v oltag e has also been quantified and is shown in Fig. 8(a) f or a 1 kHz sine wa v e. The probing code length is 82 µ s and the obser v ation windo w is 40 ms long. W e obser v e a linear behavior ( 20 dB dynamic range) f or v oltages between 0 . 1 Vpp and 20 Vpp . W e could not fur ther increase the voltag e with our low -frequency signal generator . Below 0 . 1 V , the noise floor induced b y the phase noise of the laser will become prominent. The dynamics of the sensing sys tem can be enhanced with a laser ha ving a narrow er line width. Ho we v er , this demonstrated dynamic range is already acceptable to anal yze a wide rang e of mechanical signals. Next, we measure the sensitivity of our sy stem or the smalles t detectable chang e in the sensed variable at a giv en frequency , often e xpressed in terms of rad / √ Hz . For that, one piezoelectr ic actuator is e xcited with a pure tone of constant amplitude producing a 2 π peak -to-peak phase variation. The phase is captured o v er an obser v ation windo w of 8 ms and the probing code length is fixed to 20 . 48 µ s . Sensitivity is computed from the nor malized po w er spectral density of the estimated phase at the FBG f ollo wing the sine wa ve stimulus as p N B / F m a x where N B is the noise po w er in a frequency resolution of B = 125 Hz corr esponding to the 8 ms observation window and F m a x = 1 /( 2 T c od e ) is the maximum mechanical bandwidth of the used code ( 24 . 4 kHz in this case) [15]. The measured sensitivity betw een 10 and 20 µ rad / √ Hz is sho wn in F ig. 8(b) f or frequencies in the range of [ 100 : 18000 ] Hz . Fur thermore, w e measured the sensitivity after displacing the sensor ar ra y b y adding 25 km of SMF and noticed a tenf old deterioration in sensitivity (between 100 and 200 µ rad / √ Hz ). Fixing the probing code length at 26 µ s , which cor responds to a mechanical bandwidth of 0.01 0.1 1 10 0.01 0.1 1 10 100 Phase mag n i tu d e ( r ad pp ) Pi e zo i n p u t v o l tag e ( V pp ) (a) 1E - 6 1E - 5 1E - 4 1E - 3 10 100 1000 10000 100000 S e n si ti v i ty ( r ad / sqrt( H z)) F r e q u e n c y ( H z) (b) Fig. 8. (a) Dynamic range: peak -to-peak phase magnitude v ersus peak -to-peak voltag e for a 1 kHz sine wa v e. (b) Sensitivity in rad / √ Hz for sine w a v es between [ 100 : 18000 ] Hz . 19 kHz , the pow er spectral response is now measured by applying on the actuator a 1 s -long chirp ex citation that linearly explores the audio bandwidth from 20 Hz to 18 kHz . The obtained po w er spectral density of the phase response from the stimulated sensor is sho wn in Fig. 9. The disturbances visible on the left par t of the figure are induced by the limited measurement windo w , they disappear when measur ing the low frequency part dur ing a larger windo w . The rise in the response obser v ed abo ve 10 kHz comes from the actuator , and is induced b y its first resonance peak located at 20 kHz (pro vided b y the manuf acturer of the piezoelectric actuator). This resonance peak can be digitall y compensated, and the pow er spectral response w ould be flat within [ 20 : 18000 ] Hz . This linear ity , added to the previousl y show cased dynamic range and sensitivity , demonstrates the ability of the sy stem to reliabl y capture distr ibuted audio/mechanical signals ov er a wide spectral range, as larg e as the human hearing sys tem. Although the demonstrated rang e is bounded by 18 kHz in this w ork, the use of shor ter probing codes generated at higher symbol rates will allo w us to explore ev en higher frequencies. Fig. 9. P o w er spectral response of the system measured ov er the audio bandwidth. 5. Conclusion W e introduced no v el polar ization-multiple xed codes deriv ed from Gola y sequences pro viding a perfect optical channel estimation for phase and polar ization sensing applications - while co v ering only the former in this paper - with a code length flexibility that adjusts the sys tem mechanical bandwidth to the application requirement. The underl ying setup is derived from the one used in coherent optical telecommunication sy s tems with the requirement of a low -phase- noise laser source used in a self-homodyne configuration. T o generate the probing e x citation at the transmitter side, there is no need f or any acousto-optic modulators, nor digital-to-analog con v erters (D A Cs) thanks to the binary nature of the proposed sequences. In addition, the sensor array can be continuously probed by periodic codes maximizing the signal-to-noise ratio and the co v ered bandwidth. The main limiting parameter is the laser coherence: the duration of probing code w ords and the round-trip dela y in the sensor ar ra y should be within the coherence time of the laser source to guarantee a targ eted sensitivity value. An FBG based sensor array ex cited with piezoelectric actuators was used e xperimentally to accuratel y quantify the sy stem perf ormance. With a 600 Hz line width laser source modulated b y our proposed PDM-QPSK code, a sensitivity of 10 µ rad / √ Hz was measured for mec hanical perturbations up to 18000 Hz , thus co v ering the entire spectral range of the human hearing sys tem. Ackno wledgments W e warml y thank Ole Henrik W aagaard from Alcatel Submarine Netw orks Norwa y AS for his help in the dev elopment of the theoretical section.
Original Paper
Loading high-quality paper...
Comments & Academic Discussion
Loading comments...
Leave a Comment