Forecasting the magnitude and onset of El Nino based on climate network
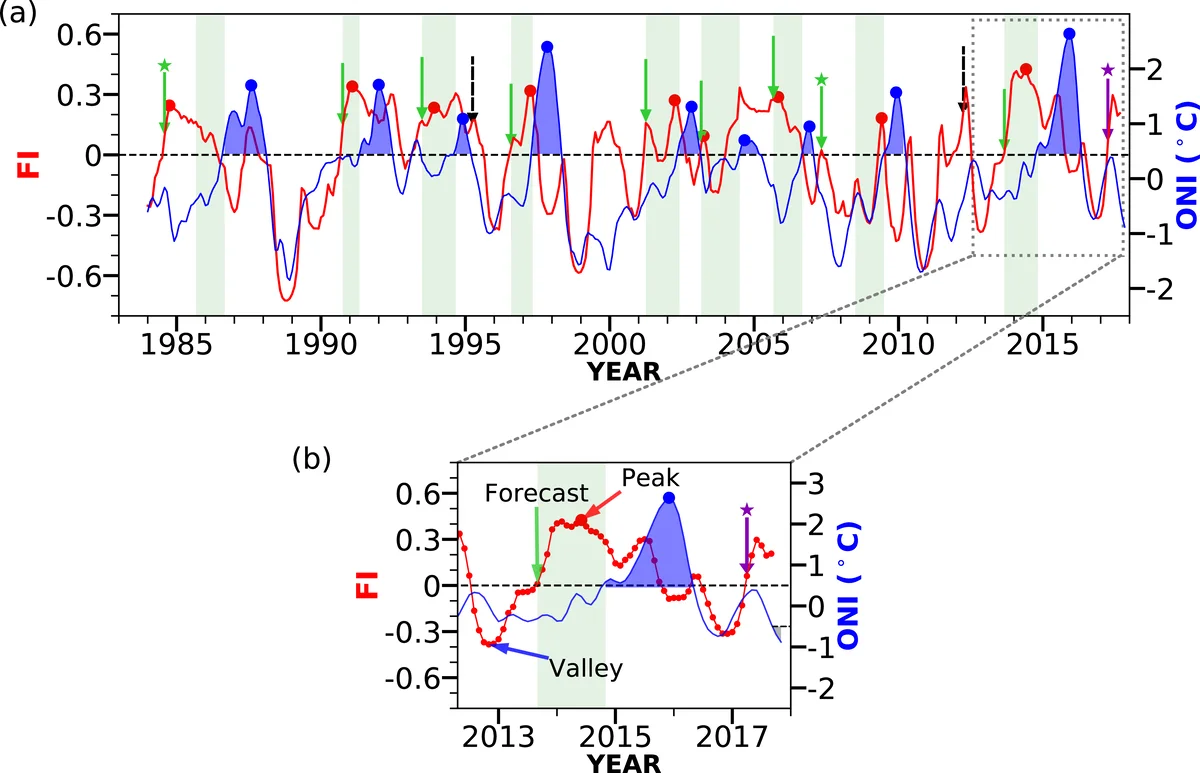
El Nino is probably the most influential climate phenomenon on interannual time scales. It affects the global climate system and is associated with natural disasters and serious consequences in many aspects of human life. However, the forecasting of the onset and in particular the magnitude of El Nino are still not accurate, at least more than half a year in advance. Here, we introduce a new forecasting index based on network links representing the similarity of low frequency temporal temperature anomaly variations between different sites in the El Nino 3.4 region. We find that significant upward trends and peaks in this index forecast with high accuracy both the onset and magnitude of El Nino approximately 1 year ahead. The forecasting procedure we developed improves in particular the prediction of the magnitude of El Nino and is validated based on several, up to more than a century long, datasets.
💡 Research Summary
This paper presents a novel forecasting approach for the El Niño–Southern Oscillation (ENSO) that simultaneously predicts the onset and the magnitude of El Niño events with a lead time of roughly one year. The authors construct a climate network over the canonical Niño 3.4 region (5° S–5° N, 120° W–170° W) by discretising it into 105 grid points (2.5° × 2.5° resolution) and treating each grid point as a node. For each node they compute daily near‑surface (1000 hPa) temperature anomalies, normalised by the long‑term mean and standard deviation, using only data available up to the prediction date.
Link weights are derived from the time‑delayed cross‑correlation function between pairs of nodes. For daily datasets the lag τ is scanned over 0–200 days; for monthly datasets (PCMDI‑AMIP, ERSST) τ spans 0–6 months. The maximum of the cross‑correlation, C_i,j(θ), is taken as the similarity measure for the link (i,j). The average of all link maxima at a given month defines a global coherence metric C(t). When C(t) is high the network is coherent; when C(t) drops the network becomes disordered.
To capture the temporal evolution of disorder, the authors introduce the Forecasting Index (FI):
FI(t) = –
Comments & Academic Discussion
Loading comments...
Leave a Comment