On the Regimes in Millimeter wave Networks: Noise-limited or Interference-limited?
Given the overcrowding in the 300 MHz-3 GHz spectrum, millimeter wave (mmWave) spectrum is a promising candidate for the future generations of wireless networks. With the unique propagation characteristics at mmWave frequencies, one of the fundamenta…
Authors: Solmaz Niknam, Balasubramaniam Natarajan
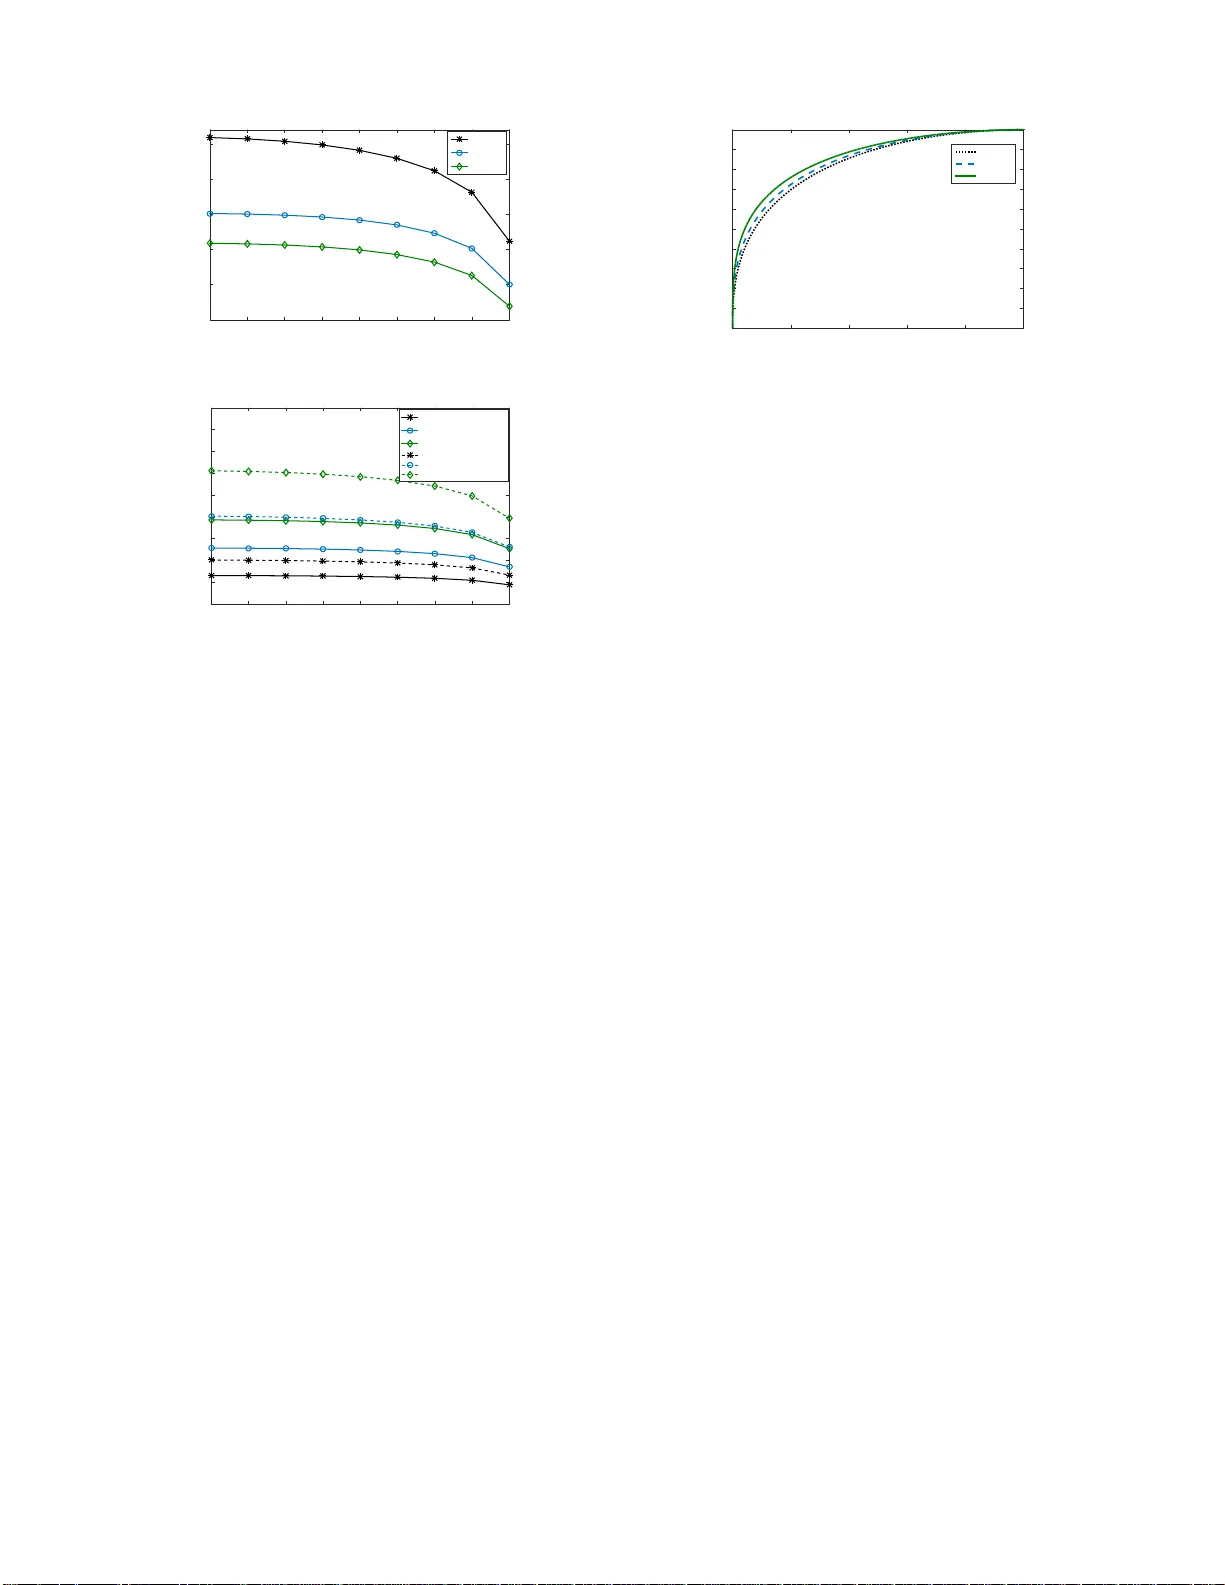
On the Re gimes in Millimete r wa v e Networks: Noise-limite d or Interfer ence-limite d? Solmaz Niknam ∗ and Balasubrama niam Natarajan † ∗ † Departmen t of Electrical and Computer Engineering, Kansas State Un i versity , Kansas, USA Email: { ∗ slmzniknam , † bala } @ksu.ed u Abstract —Giv en the ov ercro wding in the 300 MHz–3 GHz spectrum, millimeter wav e (mmW a ve) spectrum is a p romising candidate for the fu ture generations of wireless networks. With the uniqu e propagation ch aracteristics at mmW a ve frequencies, one of the fundamental questions to addr ess is whether mmW ave networks ar e noise or interference-limited. The regime in which the netwo rk operates significantly impacts the MA C layer design, resour ce allocation procedur e and also interference management techniques. In this paper , we first derive the statistical charac- teristic of the cumulative interference in finite-sized mmW a ve networks considering configuration randomness across spatial and spectral domains while includ ing the effect of blockages. Subsequen tly , u sing th e d eriv ed in terference model we set up a likelihood ratio test (LRT) (that is dependen t on various network parameters) in order to detect th e regime of the network from an arbitrarily located user stan d point. Unlike traditi on al n etworks, in mmW a ve netwo rks, different likelihood of experiencing an interference-limited regime can be observed at different locations. I . I N T RO D U C T I O N The av ailability of a large p ortion of millimeter w ave (mmW av e) spectr um has giv en r ise to th e idea that utilizing this chunk of spectrum m ay become a viable option in the next g eneration of wireless networks, e.g., 5G [1]. Howe ver , due to its c h allenging pro pagation characteristics inclu ding se vere pathloss and stron g atmosp heric ab sorption, mmW a ve spectrum has been und erutilized in mobile communic a tion. Thanks to large antenna array s that co herently d irect the beam en ergy , high ly directional sign a ling can help overcom e the adverse mmW av e p ropaga tio n characteristics. Howe ver, utilization of directional beams changes ma ny aspects of the wireless system design [2]. In fact, directional links ar e susceptible to blockage s and ob stacles [3]. Highly narrow beams, large av ailable b andwidth and hig h signal attenu ation in mmW ave spectru m may lead us to the conclusion that mmW a ve network perfo r mance is limited o nly by ther mal noise (no ise-limited r egime ) . Howe ver , dep ending on the den- sity of A Ps, de nsity of the obstacles, tra n smission probab ility , and op erating beamwidth, mmW ave network perform a n ce may degrade d ue to interfere n ce ( interferen ce-limited regime). Unlike traditional wireless n etworks, mmW av e networks may transit from a noise-limited regime to an in terferenc e -limited regime o r exhibit interm ediate behavior in which both r egimes can be observed [4]. Th e regime in which the network is operating highly affects the MAC layer design and resou rce allocation strate gies [5]. Mor eover , determin in g the network regime is critical in terms of id entifying the mo st appro priate interferen ce coordin ation technique tha t is effecti ve in an interferen ce-limited regime. Ho wever , when the network is in a noise-limited regime, we may n ot need any interfer ence managem ent mechanism or only a simple one may suffice. Therefo re, one of the fundam ental questions of interest in mmW a ve de nse networks is whether the pe r forman ce is lim- ited by the interf erence or just by th ermal noise. There have been a few prior efforts foc u sed o n determin in g network regime s. [6], [7] have prop osed co nditions under which th e network is noise or interfe rence-limited . Howe ver, the den sity of th e interf ering APs ar e assumed to be fixed which m ay not be suitable for 5 G m mW a ve network s that may exhibit u ncertain spatial configuration s due to factors like unplanned user-installed APs [8] and sensitivity to o b- stacles. In [4], the network regime is determined , modeling the tran smitter location as a Poisson point pro cess (PPP). Howe ver , mmW a ve spe c ifications such as severe pathloss an d beam sensiti vity to small-sized obstacles are n ot taken into consideratio n. The fact that in te r ference power can chan ge du e to the p resence of obstacles [9] lim its the applicab ility of [4]. In [5], the transition p robability from a noise-limited to an interferen ce-limited regime is calculated in a PPP mmW a ve network with rand o m blockag es. Howe ver , con sidering the spatial locatio n s of the in terfering APs as a PPP is not an approp riate choice fo r mod eling fin ite- sized n etworks with fixed num ber o f APs whe r e performan c e beco mes locatio n depend ent, as shown in [10]. Moreover, the blo ckage model used in [5] is based on the u nrealistic assumption of having a complete link outag e with on ly one obstacle. Howe ver , in many p ractical mmW a ve applica tions such as in door mmW ave en viro nments, outdoo r mmW av e sma ll cells where coverage range is limited o r even cases wher e terminals a r e equ ipped with larger num ber of anten nas with wid er beamwid ths, more than on e obstacle is need ed to impact the power level, causing link blo ckage [1 1]. In th is paper, we take a system atic ap proach to determine the network regime in mmW av e networks. I n or der to overcome the limitation of prior efforts, we co nsider a mo r e realistic and appr opriate network an d blockag e models upon which the regime id entification is formu lated as a hy pothesis te sting problem . Specifically , we detec t wh ether an arbitrarily located user experie n ces a n oise o r inter f erence-limited regime ba sed on the r eceived signal power distribution in the presence of arbitrary - sized b lockages. W e calculate the distributions of the signal-plus-n oise and signal-plus-in terference powers which serve as the n ull and alternate hyp otheses, respectiv ely . I n order to calcu late the interfe r ence power , a 2D Binomial point process (BPP) [ 12] is assum e d to accoun t for the rando mness of inter fering APs c o nfiguratio n in b oth spatial and spe c tr al domains in a finite area 1 . In fact, we co nsider a grid structure of space-freq uency locatio ns wher e interf ering APs are placed random ly based on a BPP . W e also account f o r beam direc- tionality by in cluding the effect of presence of arbitrary- sized blockag e s in the e n viron ment using a mor e r ealistic blocka ge model. It is notable that, unlike [5] and other works on blockag e mod eling [14]–[18], in this blo ckage model the net effect of partial blockag e caused by each individual o bstacle is calculated. Since, m ore than only on e o bstacle may cau se complete link blockag e. M oreover , d ue to th e inhe r ent com- plexity in evaluating the exact distribution, an approxim ation of th e distribution under the alternate hypoth esis (signal-plus- interferen ce power) is calculated using the max imum entropy (ME) techniqu e 2 . Subsequently , using the standard likelihood ratio test (L R T) based on a N eyma n-Pearson (NP) framework, we determine the regime of the network. It is imp ortant to note tha t determin ing the regime of the network is high ly impacted by the interfere nce mod e l that app ropriately reflects the network specifications. The refore, th e p urpose of th is paper is to leverage the detailed statistical interference mo d el and its relation to various key deployment parameters including access p o int density , b lockage den sity , tran smit power , ba n d- width and an tenna p attern to p rovide an accurate assessment of the regime of the mmW ave networks. It is also shown that the likelihood of experien cing an interferen ce-limited regime depend s on th e interf erer and blockag e den sities an d varies at different spatial lo cations. I I . S Y S T E M M O D E L W e consider a circular area of radius R in 2D p la n e ( I R 2 ) centered at the or igin, with N number o f interfering APs operating in frequ e ncy band [ f s , f e ] . W e a lso assum e that a reference re ceiv er, located at an arbitrary location v 0 ∈ B ( O ; R ) = x ∈ I R 2 k x k 2 < R with arbitrary freq uency f 0 ∈ [ f s , f e ] , is communicating with a refe r ence tr ansmit- ter over an intended communicatio n link. This assumption giv es th e f reedom of ev aluatin g the ne twork regime for users at different locations enabling more efficient resource man- agement (e.g., in terferenc e co ordinatio n/cancellation only for those users whose perform ances are limited by interf erence). Interfer in g APs ar e distributed based on BPP in the space- frequen cy domain with succ e ss pro bability p . In othe r words, we co nsider a gr id structure where the total N interferers are randomly located at space-frequen cy location s based on a BPP 3 . The overall received interfer ence signal is the sum o f the recei ved signa l from each interferer at a random sp ace- frequen cy locatio n. W e also assume a ran dom number of 1 BPP is an appropri ate choice in order to model the node locations in finite-siz ed networks with a gi ven number of nodes [13]. 2 Based on the principle of ME [19], ME distrib ution is the least informati ve distrib ution subject to specified properti es or measures. Intuiti vel y speaking, it has the minimum amount of prior informati on built into the distributi on. 3 Referen ce transmitter -recei ver pair is not a part of the point process. q r 2 d S i i i i ( ) 2 ta n i q ( ) i q 2 t a n i q 2 2 2 2 2 t a n i q i i q B l ockag e Inten ded R eceiver Inter ferin g AP Fig. 1: Radiati on cone and the ef fecti ve shadow of the blockage s on the base of the radiat ion cone. arbitrary - sized block a ges in th e en viro nment distributed based on a PPP [1 4], [16]–[18 ] with parameter ρ . Due to the presence of the ar bitrary blockages in the environment, the transmitted signal of interfering APs may be blocked and not all of the interfe r ing APs con tribute to the total received interferen ce signal. Therefor e, we a r e p rimarily concerned with the interfer ers that ar e in the line - of-sight (LoS) o f the referenc e r eceiv er . In order to calculate th e distribution o f the number of activ e (non -blocked) interfering APs, we con sid er the blo ckage model presented in our pr ior work [12]. In [12], the blockag e effect is modeled by considering th e net ef fect of partial blockag e th at eac h ind ividual obstacle cau ses by intersecting the interferers' b eam. I n this mod el, ob stacles ar e assumed to be modeled as circles with un iformly distributed radius d in [ d s , d e ] . Assuming a r a diation c o ne (see Fig. 1) for the i th ∈ { 1 , 2 , ..., N } interfering AP (wh ere the e d ges are determined by the be amwidth of the signal, 2 θ ) we show that the average p robability of each interf ering AP being bloc ked correspo n ds to p b = 1 E [ d ] 2 tan( θ ) p b1 + 1 E [ ℓ ] − E [ d ] 2 tan ( θ ) p b2 . (1) Here, p b1 and p b2 are obtained using p b1 = 1 − q π tan( θ ) ρ ( d e − d s ) " erf ( d e r ρ 4 tan( θ ) ) − erf ( d s r ρ 4 tan( θ ) ) # , (2) and p b2 = (1 + ∆) l ∆ e ρ E [ S ] − 1 m e − (1+∆) l ∆ e ρ E [ S ] − 1 m ! , (3) where ∆ = 2 ρ E [ ℓ ] tan ( θ ) . Here, E [ ℓ ] an d E [ S ] denote the av erag e distance from the interfe r ing APs to the r eference receiver and the average partial blockag e caused by ind ividual interfering APs, respecti vely . Given the BPP assumptio n of interfering nodes, the d istribution o f ℓ cor r esponds to f L ( ℓ ) = 2 ℓ R 2 0 < ℓ ≤ R − k v 0 k 2 ℓ cos − 1 k v 0 k 2 − R 2 + ℓ 2 2 ℓ k v 0 k π R 2 R − k v 0 k < ℓ ≤ R + k v 0 k . (4) In ad dition, the average partial blo ckage can be expressed as E [ S ] = E 2 dℓ r | d, r , ℓ = d e Z d s R + k v 0 k Z d 2 tan( θ ) ℓ Z d 2 tan( θ ) 2 dℓ r f D ( d ) f ( r, ℓ ) d d d r d ℓ. (5) Detailed der iv ation of the blo ckage model is provid e d in our prior work [12]. Giv en the b lockage probab ility in (1), th e distribution of the total nu mber of n on-blo cked interfering APs is calculated using th e f ollowing lemma: Lemma 1. Th e total number of no n-blocked interfering APs, denoted as K , is a Bino mial random variable with success pr obability p (1 − p b ) . Pr oof. Let K = K 1 + K 2 + ... + K N , wh ere K i is a Bernoulli random variable and equ als 1 , if the i th interfering AP is not b lo cked, and 0 , o th erwise. Therefor e, the p r obability generating function (PGF) of K is g iv en by G K = (1 − p b )z + p b . (6) Subsequen tly , we have G K (z) = E h z N P i =1 K i i = X k ≥ 0 E z K k p ( N = k ) = G N ( G K i ( z )) = [(1 − p ) + p ((1 − p b )z + p b )] N = [1 − p (1 − p b ) + p (1 − p b ) z] N , (7) which is the PGF of a Binomial rando m variable with suc cess probab ility p (1 − p b ) . Now , having the d istribution of the nu mber of active inter- ferers, in lemma 1, we set up a hypo thesis test in order to determine th e r egime of the ne twork . I I I . R E G I M E C L A S S I FI C A T I O N In this section, we formulate a b inary hypothe sis test whe re regime dete c tio n de cision is based o n the re c e i ved power at an arbitrary located receiv er . This h ypothe sis test is f ormally defined as: H 0 : Y = ϕ + N (Noise-limited regime) H 1 : Y = ϕ + I (Interfe r ence-limited regime), (8) where ϕ , I and N den ote the average r eceiv ed power of the desired signa l, aggregated interfer ence and noise p owers, respectively . W e assume that th e signal p ower is kn own and noise is characterized b y a Gaussian random variable with mean 0 and variance σ n 2 . Here, u n der H 0 hypoth esis, the referenc e r e ceiv er experien ces a no ise-limited environment. This c ase may ha p pen wh en mo st of the interfer ing APs are blocked by the b lockages in the environmen t and the r eceiv ed interferen ce power is low enou g h that the thermal no ise is dominan t. Alternately , under hypo thesis H 1 , th e p erform ance is limited by the received interfer ence power . The distributions of the r e ceiv ed power un der both hyp otheses need to be identified in ord er to derive the test. A. Distrib ution un d er H 0 In this subsection, g i ven the av erag e rece ived power of the desired signal, ϕ , we calcu late the pro bability d ensity func tion (PDF) of th e received p ower u nder the null hypoth esis. Lemma 2. The statistical distribution o f the r eceived power under H 0 is H 0 : Y ∼ e − y − ϕ 2 σ 2 2 σ 2 Γ 1 2 q y − ϕ 2 σ 2 (9) Pr oof. Since no ise is assumed to be Gaussian with mean 0 and variance σ n 2 , the distrib ution of the noise power is N ∼ σ n 2 χ 2 1 , wher e χ 2 1 denotes a chi-squared distribution with 1 degree of freedo m . Consequen tly , th e c u mulative density function ( CDF) of the power is g iv en by F Y ( Y ≤ y ) = F Y ( N ≤ y − ϕ ) = 1 Γ 1 2 γ 1 2 , y − ϕ 2 σ 2 . (10) Then, by taking deriv ative of the CDF , the PDF o f the p ower under th e null hy pothesis is determined as f Y ( y ) | H 0 = d d y ( 1 Γ 1 2 γ 1 2 , y − ϕ 2 σ 2 ) = d d y 1 Γ 1 2 y − ϕ 2 σ 2 Z 0 t 1 2 − 1 e − t d t = e − y − ϕ 2 σ 2 2 σ 2 Γ 1 2 q y − ϕ 2 σ 2 . (11 ) B. Distrib ution un d er H 1 In this sub section, we calculate the distribution o f the received power in the interfe rence-limited regime where the power of the no ise is negligible. Ther efore, the p ower received by an arbitr arily-located refer ence receiver is Y = ϕ + K X i =1 P I i , (12) where P I i is the e ffecti ve received interf erence power from the i th interfering AP at th e output o f the matched filter which correspo n ds to [2 0], P I i = q i h i k ℓ i k − α Υ ( ω i ) . (13) Here, h i and k . k − α model the Nakag ami- m small scale fading and pathlo ss effects, respec ti vely . ℓ i = v 0 − v i and ω i = f i − f 0 denote the sp atial and spectral distance between the i th interfering A P and the refe rence receiver , respectively . q i is the transmitted power of th e i th interfering AP . More over , Υ ( ω i ) is defin ed as Υ( ω i ) = f 0 + W 2 Z f 0 − W 2 Φ ( f − f i ) | H ( f − f 0 ) | 2 d f , (14) where H ( f − f 0 ) is the tran sfe r f unction of the match ed filter at the reference receiver with arbitrary frequ ency f 0 , and Φ( f − f i ) is th e p ower sp e c tral d ensity of the baseban d equiv alent of the interferers signals. Consider ing (13), as k ℓ i k − α captures th e impact of spatial distances (and thereby random spatial configuration), Υ( ω i ) acco unts for the effect of frequ ency separ ation (an d ther eby r andom spe c tr al co nfig- uration) in the interference p ower . The statistical distribution of th e r eceived signal power in the alternate h ypothesis H 1 , in terms of MGF , is obtained using th e following theor em: Theorem 1. The mo ment generating fun ction (MGF) of Y , under a lternate h ypothesis H 1 , is given by M Y (s) = e ϕ s 1 − p (1 − p b ) + p (1 − p b ) M P I i (s) N , ( 1 5) wher e, M P I i (s) = ∞ X n =0 ( q s) n n ! m − n Γ ( n + m ) Γ ( m ) 2 γ n ( f s , f e ) κ n ( R, v 0 ) R 2 ( f e − f s ) . (16) Her e, M P I i (s) is th e MGF of the i th interfer er’ s power an d γ n ( f s , f e ) = min( | ω e | , | ω s | ) Z 0 Υ( ω ) n d ω + max( | ω e | , | ω s | ) Z 0 Υ( ω ) n d ω , (17) and κ n ( R, v 0 ) = R −k v 0 k Z 0 ℓ − nα +1 d ℓ + R + k v 0 k Z R −k v 0 k ℓ − nα +1 π cos − 1 k v 0 k 2 − R 2 + ℓ 2 2 ℓ k v 0 k ! d ℓ. (18) Pr oof. In o rder to calcu late the MGF of the rece i ved signal power u n der alternate hyp othesis, we have M Y (s) = E e s ϕ + K P i =1 P I i = E e s ϕ +s K P i =1 P I i =e ϕ s E e s K P i =1 P I i = e ϕ s X k ≥ 0 E e s P I i k p ( K = k ) = e ϕ s G K M P I i (s) = e ϕ s 1 − p (1 − p b ) + p (1 − p b ) M P I i (s) N . (19) where M P I i (s) is the MGF of the i th interferer ’ s power . The MGF o f the power o f the ind ividual interfer e is calcula ted as M P I i (s) = E h e s q h ℓ − α Υ( ω ) i = ∞ Z 0 R + k v 0 k Z 0 max( | ω e | , | ω s | ) Z 0 e s q h ℓ − α Υ( ω ) × f Ω ( ω ) f L ( ℓ ) f ( h ) d ω d ℓ d h. (20) Giv en the BPP assump tion of th e location o f interfe rer in space-freq uency d omain, th e distributions of spectra l d istance is given b y [12] f Ω ( ω ) = 2 f e − f s 0 < ω ≤ min ( | ω e | , | ω s | ) 1 f e − f s min ( | ω e | , | ω s | ) < ω ≤ max ( | ω s | , | ω s | ) , (21) where ω e = f e − f 0 and ω s = f s − f 0 . Having the spatial and spectral distance distributions given in (4) an d ( 21), Nakagami- m assum ption of the small scale fading, i. e., h and using the polyno mial expa nsion of the exponential fu nction, th e integral in (19) is derived as in ( 16). Su bsequently , by sub stituting (16) in (19), th e result in (15) is o btained. Calculating the inverse Laplace transf o rm o f the MGF in (15) to find the distribution is a tedio us task a n d compu ta- tionally complex. A mor e straightforward method might be to approx imate the giv en distribution with k nown distributions. Therefo re, in or d er to make the prob lem tractable, we use the ME method. Specifically , the ME technique [1 9] is used to approx imate the distribution of the re ceiv ed power und er the alternate hypo th esis with a tractable and simpler for m . Basi- cally , ME estimate is an estimate with maximal inform ation entropy (least-inf ormative) subject to the given mom ents. All the inform ation about the in terference power distribution is provided by the MGF in ( 15). There f ore, we can use as many moments as needed (as the prio r info rmation or con straints) to make the estimation m ore precise. Howe ver , considering higher n umber of moments leads to the calculation of sets of non-linea r equ a tio ns w h ich itself adds complexity to the problem . Here, fo r simplicity , we use the first mo ment o f the recei ved power (mean recei ved power) as the co nstraint while maximizing the entr opy of the d istribution. W e believe that this is a reasonable an d log ical starting point as the difference in mean power of interference an d no ise should offer the greatest d iscriminatory effect between H 0 and H 1 . Later , Section IV, we show the p erform ance of the resulting test using receiver o perating characteristic (R OC) cu rve and it can been con sid e red as the lower bou nd on the p erform ance of the ideal test with th e true distribution u nder H 1 . In fact, the test perfor mance can be im proved by including the high er order moments as part of the ME estimation constrain ts at the cost of increa sin g model co mplexity . This will b e explored as part o f our futu re work. Lemma 3 . The a p pr oximated P DF of the r eceived signal power under alterna te hypo thesis H 1 is given by H 1 : Y ∼ λ e − λ ( y − ϕ ) , (22) wher e λ is derived by solving ( λϕ + 1) e − λϕ − E [ y ] λ 2 = 0 and E [ y ] is the first mo ment of the r eceived signal power under th e alterna te hypo thesis. Pr oof. Considering the first mom ent as the constrain t in the ME meth od, the PDF of the r eceiv ed signal power can be calculated by solv ing max − f Y ( y ) ln ( f Y ( y )) s . t . ∞ R ϕ y f Y ( y ) = E [ y ] . (23) Here, E [ y ] = ∂ ∂ s M Y (s) s=0 . The ME probability is found using th e d ual Lag rangian metho d [19], ∂ ∂ f Y ( y ) L ( f Y ( y ) , λ ) = 0 , (24) where, L ( f Y ( y ) , λ ) = − f Y ( y ) ln ( f Y ( y )) + λ ∞ Z ϕ y f Y ( y ) − E [ y ] , (2 5) is the Lagran gian of the optimization p roblem (23). By solv- ing (24) using the Karush-Kuhn-Tucker (KKT) c o nditions, the distribution f Y ( y ) is der iv ed as in (22), wher e λ is calculated by solv ing ( λϕ + 1 ) e − λϕ − E [ y ] λ 2 = 0 . C. Likelihood Ratio T est W ith the knowledge of distribution of Y under bo th H 0 and H 1 , we ca n write down the likelihood ra tio as LR T( y ) = f Y ( y ) | H 1 f Y ( y ) | H 0 = λ e − λ ( y − ϕ ) e − y − ϕ 2 σ 2 2 σ 2 Γ ( 1 2 ) q y − ϕ 2 σ 2 = 2Γ 1 2 σ 2 λ e ( − λ + 1 2 σ 2 ) y + λϕ − ϕ 2 σ 2 r y − ϕ 2 σ 2 . (2 6) Considering the well-known Neyman-P ea rson (NP) criterion, the decision rule , i.e., δ NP is δ NP = 1 LR T ( y ) ≥ η ⇒ y ≥ LRT − 1 ( η ) = η ′ 0 LR T ( y ) < η ⇒ y < LRT − 1 ( η ) = η ′ . (27) It is notab le th a t, th e NP framework is cho sen in order to prevent the imposition of a specific cost to the decision made and p riors on the h ypoth e ses. In order to calculate the threshold η ′ , we h av e P F ( δ N P ) = β th ⇒ ∞ Z η ′ e − y − ϕ 2 σ 2 2 σ 2 Γ 1 2 q y − ϕ 2 σ 2 d y = β th ⇒ η ′ = 2 σ 2 erf − 1 (1 − β th ) 2 + ϕ, (28) where β th denotes the significance level o f the test. Having the thre sh old η ′ in (28), the detection pro b ability is o btained as P D ( δ N P ) = ∞ Z η ′ λ e − λ ( y − ϕ ) d y = e − λ ( η ′ − ϕ ) . (29) I V . N U M E R I C A L R E S U L T S In this section , we p resent nume r ical results to d e termine the perfo r mance of th e test given the various key deploym ent parameters. A circular area of radius R = 10 m is co nsidered. The re f erence receiver is located at spe c tr al lo cation f 0 = 62 GHz. Moreover , f s and f s are set to 58 GHz and 64 GHz, respectively . The p athloss exponen t, α , an d the shape factor of Nakagami distribution, m , are set to 2 .5 and 3 , respe c ti vely . Here, the transmitted power of a ll interfe r ing APs are assum ed to be th e same and set to 27 dBm. Th e beamwidth of th e mmW ave sign als, 2 θ , is set to 20 degrees. W e assume Gaussian PSD for interf ering APs and an RC-0 fo r the matched filter at the ref erence receiver side. It is worth mention ing that the propo sed model and the h ypothesis test are no t limited to specific power sp ectral densities or pulse shape ch oices of the desired a n d inter ferers' signals. In Fig. 2, the a r ea under the LR T curve is shown as a func- tion of distance fro m the or igin (f or fixed nu mber of interferin g APs). Sinc e, (9) is indep endent of th e refer ence receiver’ s location; therefo re, hig her values in Fig . 2 represent the hig her values in (22) which means the hig her likeliho o d of being in the interferen ce-limited regime. When the d ensity of blocka ges increase, more interferin g APs are bloc ked. Therefo re, there is less n umber of interfer ing APs that introdu ce in terferenc e to the referen ce rece iver and the probability of be in g in the interferen ce regime decreases. In a ddition, it can be seen that the p r obability of expe r iencing the interferen c e-limited regime decreases as the reference r eceiv er moves from the center of the area to its perip hery . T he same trend c a n be obser ved as the number of in terfering APs chang es (with the fixed blocka ge density), as shown in Fig. 3. The scenarios in wh ich the effect of the pr esence of blockage s is no t considered is also p r ovided in Fig. 3. Her e, w e ca n see how igno ring the blo c kage effect results in a n overestimation in th e likelihoo d of obser v ing an interferen ce-limited regime. In Fig. 4, ROC curve is shown for different n umber of interfering APs and b lockage de nsity ρ set to 1 . Here, the detection p robability represents the prob a b ility of detecting an v 0 [m] (distance to the Origin) 1 2 3 4 5 6 7 8 9 Area under LRT 170 175 180 185 190 195 ρ =0.01 ρ =0.5 ρ =1 Fig. 2: LR T versus reference recei ver location for diffe rent ρ , N =200 . v 0 [m] (distance to the Origin) 1 2 3 4 5 6 7 8 9 Area under LRT 155 160 165 170 175 180 185 190 195 200 N=50, ρ =1 N=100, ρ =1 N=150, ρ =1 N=50,No blockage N=100,No blockage N=150, No blockage Fig. 3: LR T versus reference recei ver locati on for diffe rent N v alues. interferen ce-limited regime for a specific set of dep loyment parameters. As we can see in the results, the d e riv ed distributions are function s of various ke y deploymen t param eters including access p o int density , b lockage den sity , tran smit power , ba n d- width and antenn a b eamwidth. Using the binar y hypothesis test in (27) we can decide, giv en a specific set of deploymen t parameters fo r the network, which regime is more p robable for receivers located at dif ferent locations in the finite-sized network. V . C O N C L U S I O N In this paper, we set up a bin ary hy pothesis test based on the recei ved signal power in ord er to detect the regime of the mmW ave networks in the p resence o f the b lockages. W e derive the distributions of th e signal-p lus-noise and sign al- plus-interf e rence powers, i.e., th e power distributions in the case of null an d alternate hy potheses of th e binary test, respectively . Due to the com p lexity of the derived distribution under altern ate hy p othesis and in or der to make th e problem tractable, we leverage the method of max imum entropy to approx imate the distrib ution . Using the appr oximated distri- bution and d eploying the Neyma n-Pearson criterion, we cal- culate the proba bility of experien cing an interf erence-limited regime. It is worth r eiterating th at th e detailed statistical interferen ce model and its relation to various key deploymen t parameters including acc ess point density , block age d ensity , transmit power , ban dwidth and anten n a patter n help s provide an accurate assessment of th e network regimes at d ifferent locations in th e network. P FA ,False alarm probability 0 0.2 0.4 0.6 0.8 1 P D , Detection probability 0 0.1 0.2 0.3 0.4 0.5 0.6 0.7 0.8 0.9 1 N=50 N=300 N=800 Fig. 4: R OC curv e for diff erent N v alues, ρ =1 . R E F E R E N C E S [1] T . S. Rappaport et al. , “Mill imeter wav e mobile communicati ons for 5G cellu lar: It will work!” IE EE Access , vol . 1, pp. 335–349, 2013. [2] J. G. Andre ws et al. , “What will 5G be?” IE E E J. Sel. Area s Commun. , vol. 32, no. 6, June 2014. [3] G. R. MacCartne y et al. , “Millimete r-wa ve human blockage at 73 GHz with a simple double knife-edge dif fraction model and extension for direct ional antennas, ” in Proc . IEEE V eh. T ech. Conf. , Sept 2016, pp. 1–6. [4] M. Rebato et al. , “Understandi ng noise and interfe rence regimes in 5G millimet er-wa ve cellular networks, ” in P r oc. Europe an W ire less Conf. , May 2016, pp. 1–5. [5] H. Shokri-Ghadik olaei and C. Fischi one, “Millime ter wav e ad hoc netw orks: Noise-li mited or interferenc e-limited?” in Pr oc. IE EE Global Commun. W orkshop , Dec 2015, pp. 1–7. [6] M. Ebrahimi, M. Maddah-Ali, and A. Khandani , “Interfe rence-limit ed versus noise-limit ed communication ove r dense wireless netwo rks, ” in Pr oc. Canadian W orkshop on Inform. Theory , J une 2007, pp. 172–175. [7] N. Jindal, J. G. Andrews, and S. W eber , “Ener gy-limited vs. interference - limited ad hoc netwo rk capacit y , ” in Pr oc. Asilomar Conf. on Signals, Syst. and Comput. , Nov 2007, pp. 148–152. [8] J. G. Andrews et al. , “ A primer on spatia l modeling and analysis in wireless netwo rks, ” IEEE Communicatio ns Magazine , vol. 48, no. 11, pp. 156–163, Nov ember 2010. [9] S. Niknam, B. Nataraj an, and H. Mehrpo uyan, “ A spatial-spe ctral interfe rence model for millimeter wave 5G applica tions, ” in P r oc. IEEE V eh. T ech . Conf. , Sept. 2017, pp. 1–5. [10] M. Haenggi, Stoc hastic Geometry for W irel ess Networks . Cambri dge, U.K: Cambridge Uni v . Press, 2012. [11] Y . Niu et al. , “ A survey of millimete r wa ve communications (mmwav e) for 5G: opportunitie s and challeng es, ” W ir eless Network s , vol. 21, no. 8, pp. 2657–2676, Nov 2015. [12] S. Niknam, B. Natarajan, and R. Barazide h, “Interfere nce analysis for finite-a rea 5G mmWave networks consideri ng blockage effec t, ” IEE E Access , submitted for publicat ion. [13] M. H aenggi, Stochast ic geomet ry for wirele ss networks . Cambridge Uni versity P ress, 2012. [14] T . Bai, R. V aze, and R. W . Heath, “ Analysis of blockage effect s on urban cellu lar networks, ” IEEE T rans. W irele ss Commun. , vol. 13, no. 9, pp. 5070–5083, Sept. 2014. [15] A. K. Gupta, J. G. Andrews, and R. W . Heath Jr , “Macro di- versi ty in cellula r networks with random blockage s, ” arXiv preprint arXiv:1701.02044 , 2017. [16] M. K. M ¨ uller , M. T arane tz, and M. Rupp, “ Analyzing wireless indoor communicat ions by blockage models, ” IEE E Access , vol. 5, pp. 2172– 2186, 2017. [17] K. V enugopal and R. W . Heath, “Millimeter wav e network ed wearables in dense indoor en vironments, ” IEEE Access , vol. 4, pp. 1205–1221, 2016. [18] A. Thornb urg, T . Bai, and R. W . Heath, “Performa nce analysis of outdoor mmwav e ad hoc net works, ” IEEE T rans. Signa l Proce ss. , vol. 64, no. 15, pp. 4065–4079, 2016. [19] T . M. Cov er and J . A. Thomas, Element s of information theory . John W iley & Sons, 2012. [20] Y . M. Shobo wale and K. A. Hamdi, “ A unified model for interferen ce analysi s in unlic ensed frequency band s, ” IEE E T rans. W ire less Commun. , vol. 8, no. 8, pp. 4004–4013, August 2009.
Original Paper
Loading high-quality paper...
Comments & Academic Discussion
Loading comments...
Leave a Comment