Community-Empowered Air Quality Monitoring System
Developing information technology to democratize scientific knowledge and support citizen empowerment is a challenging task. In our case, a local community suffered from air pollution caused by industrial activity. The residents lacked the technological fluency to gather and curate diverse scientific data to advocate for regulatory change. We collaborated with the community in developing an air quality monitoring system which integrated heterogeneous data over a large spatial and temporal scale. The system afforded strong scientific evidence by using animated smoke images, air quality data, crowdsourced smell reports, and wind data. In our evaluation, we report patterns of sharing smoke images among stakeholders. Our survey study shows that the scientific knowledge provided by the system encourages agonistic discussions with regulators, empowers the community to support policy making, and rebalances the power relationship between stakeholders.
💡 Research Summary
This paper presents a community‑empowered air‑quality monitoring system designed to help residents of the Pittsburgh area confront chronic air pollution from a nearby coke (fuel) plant. The authors partnered with the local advocacy group ACCAN (Allegheny County Clean Air Now) to co‑design and deploy a web‑based platform that integrates heterogeneous data sources—low‑cost PM2.5 sensors, high‑resolution timelapse cameras, crowdsourced smell reports, and wind information—over a large spatial and temporal scale.
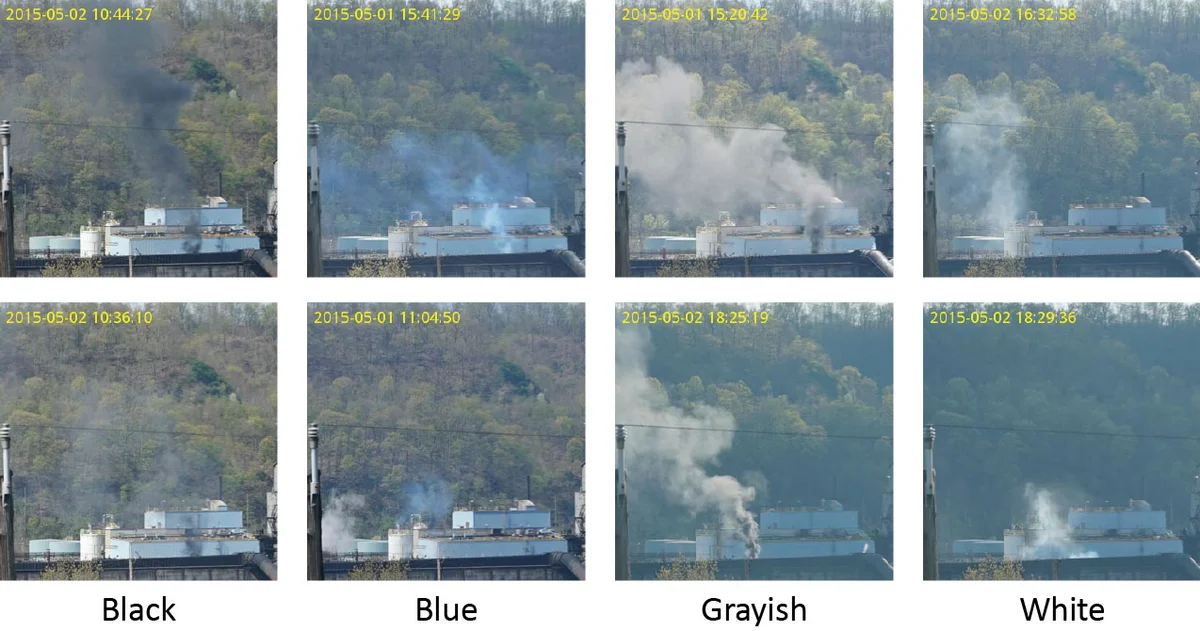
The system architecture consists of four data streams. Six community‑installed sensors continuously record particulate matter concentrations at one‑minute intervals and are visualized alongside a public sensor operated by the health department. Fixed cameras capture the coke oven’s plume, storing the footage as daily timelapse videos. Users can pan, zoom, and scrub the video; an automatic smoke‑detection algorithm (a convolutional‑neural‑network‑style model trained on color and shape features) flags likely emission periods and overlays these detections on line charts. A mobile/web form lets residents submit subjective odor reports (intensity, timestamp), which are plotted together with sensor and detection data. Wind speed and direction are fetched from a public API and rendered on a map as arrows, with sensor locations shown as bar‑charts, enabling users to infer the transport path of emissions.
The user interface is organized into three panels: (1) a zoomable video viewer, (2) a lower‑left panel displaying synchronized line charts for sensor readings, smoke detections, and smell reports, and (3) a lower‑right map visualizing wind vectors and sensor locations. Users can select any time window, generate thumbnail frames, and automatically compose animated GIFs that illustrate the plume’s evolution. These visual artifacts serve as “scientific evidence” that community members embed in social‑media posts, emails, or PDF reports when communicating with regulators, the EPA, or the health department.
To evaluate impact, the authors analyzed server logs from August 2015 to July 2016, focusing on HTTP requests for generated thumbnails (i.e., animated smoke images). The logs reveal an average of 1,200 thumbnail requests per month, with spikes coinciding with reported emission events, indicating sustained engagement. In parallel, a pre‑post survey of 84 residents measured three dependent variables: awareness of the air‑quality problem, self‑efficacy regarding collective action, and sense of community. All three showed statistically significant increases after system use (p < 0.01). Qualitative interview excerpts further suggest that the availability of concrete visual evidence encouraged “agonistic discussions”—critical, confrontational dialogues with regulators—rather than merely consensus‑building conversations.
The design process was guided by an “adversarial design” philosophy, deliberately fostering critical debate and power‑rebalancing between citizens and authorities. The team employed a community‑based participatory design approach, iteratively refining features based on feedback from monthly meetings, field tests, and usability sessions. Key challenges included integrating disparate data modalities, achieving reliable smoke detection, ensuring residents’ technological fluency, and navigating privacy/legal concerns related to continuous video surveillance.
Contributions of the work are fourfold: (1) a documented, real‑world example of a hybrid data system that enables citizens to generate, curate, and share scientific evidence for environmental advocacy; (2) longitudinal analysis of user behavior and its correlation with increased empowerment metrics; (3) empirical support for the efficacy of adversarial design in promoting environmental justice; and (4) a set of design guidelines for future community‑driven monitoring platforms. Limitations are acknowledged—particularly the false‑positive rate of the smoke detector, sensor calibration needs, and the lack of direct causal links to policy outcomes. Future work will focus on improving detection algorithms, expanding sensor networks, and establishing tighter feedback loops with policymakers to translate citizen‑generated evidence into concrete regulatory action.
Comments & Academic Discussion
Loading comments...
Leave a Comment