Topic Modeling Based Multi-modal Depression Detection
Major depressive disorder is a common mental disorder that affects almost 7% of the adult U.S. population. The 2017 Audio/Visual Emotion Challenge (AVEC) asks participants to build a model to predict depression levels based on the audio, video, and t…
Authors: Yuan Gong, Christian Poellabauer
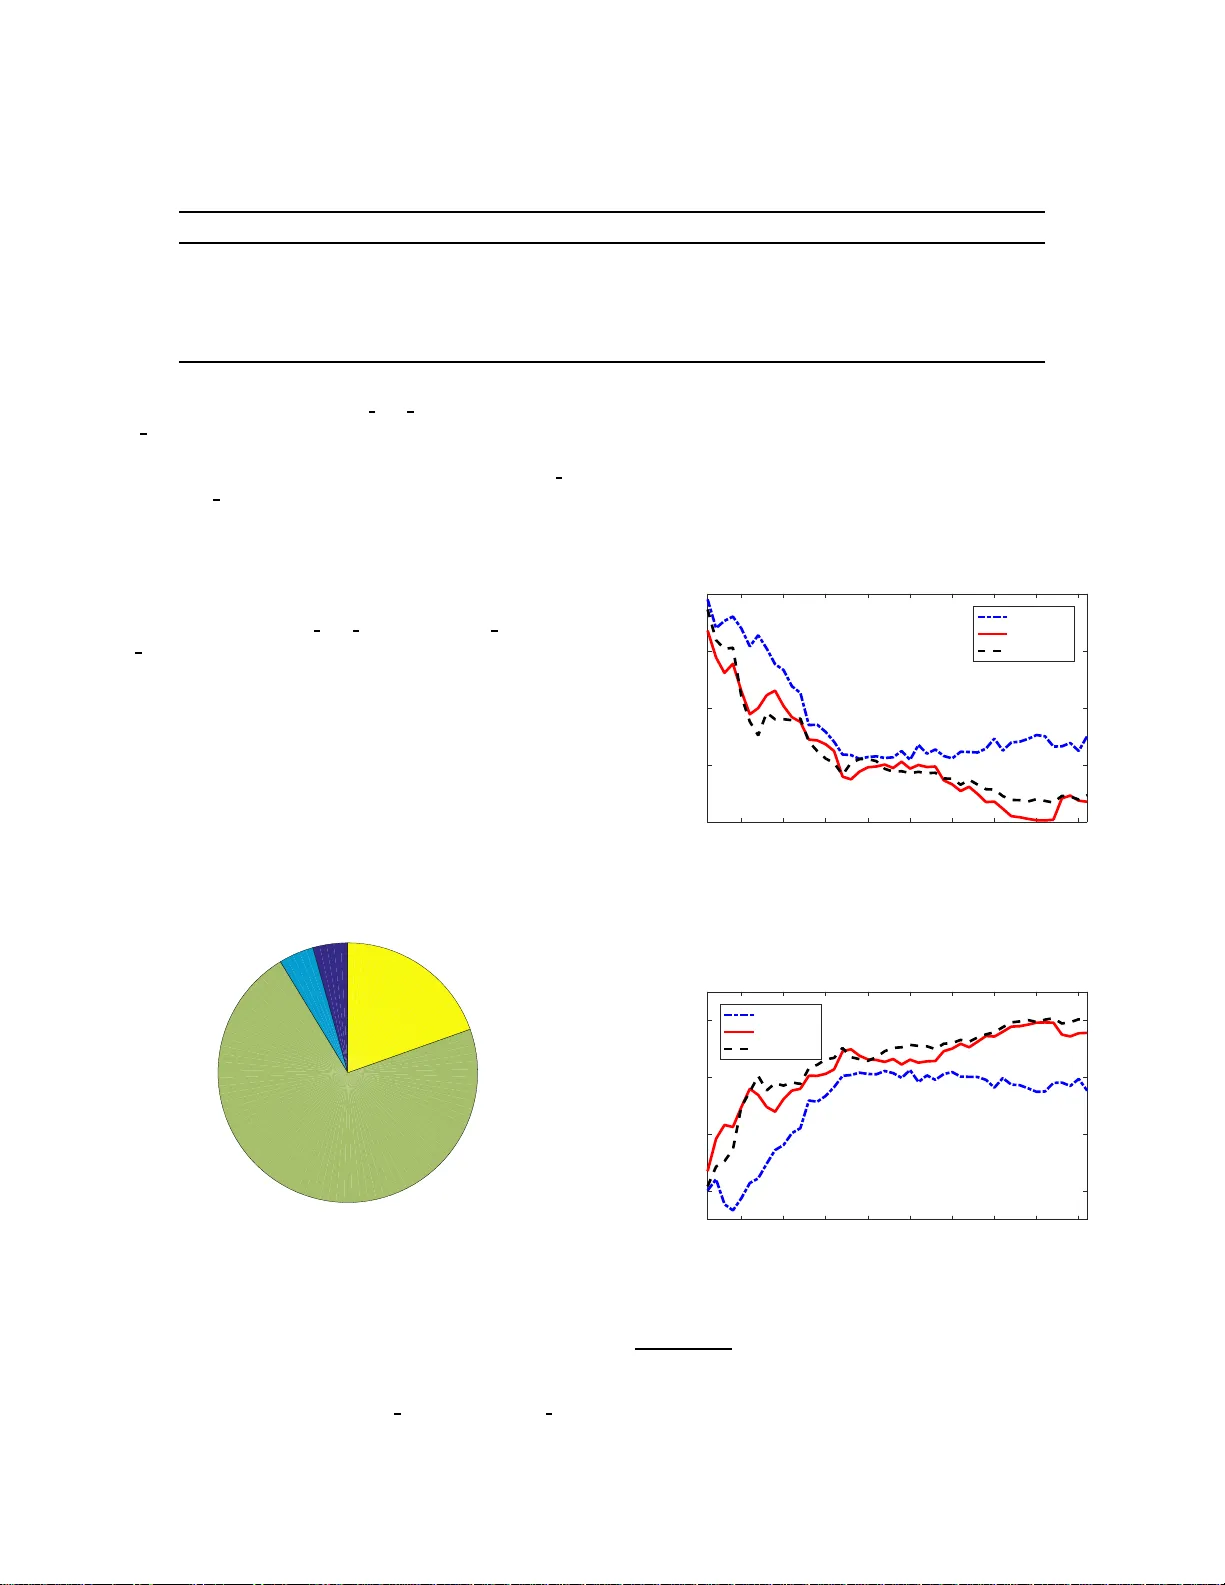
T opic Modeling Base d Multi-mo dal Depression Detection Y uan Gong Universi ty of Notre Dame ygong1@nd.e du Christian Poellabauer Universi ty of Notre Dame cpo ellab@cse.nd.edu ABSTRA CT Major depressiv e disorder is a common mental disorder that affects almost 7% of the adult U .S. po pulation. e 2017 A ud io /Visual Emo- tion Challenge (A VEC) asks participants to build a model to predict depression le vels based on the audio, video, and text of an inter- view r angin g between 7-33 minutes. Since averaging features over the entire interview will lose most t emporal information, how to discove r, cap t ure , and preserve useful t emporal details for such a long inter vie w are significant challenges. erefor e, we propose a novel topic modeling base d approach to perform co nte xt-aware analysis of the recording. Our experiments show t hat t he pro- posed approach outp erforms context-unaware methods and the challenge baselines for all metrics. KEYWORDS T opic modeling; depression detection; multi-mo d al; emotion r e cog- nition; natural language processing 1 IN TRODUCTION 1.1 Backgrou nd Major depressive disorder (MDD ), also usually called depression, is one of the most common moo d disorders, which is characterized by a p ersistent low moo d. e st udy in [6] showed that men have a risk of 10-20% and women have a risk of 5-12% to develop MDD in their lifetime. Earl y and accurat e detection o f MDD will ensure that appropriate treatment and intervention opt ions can be con- sidered. erefor e, there is a strong need for a simple method to detect depression. In the 2 017 A u dio/Visual Emotion Challenge ( A VEC) [17], the depression sub-challenge task requires partici- pants to predict the depression level (i.e. , the PHQ-8 score [ 1 0]) using audio, video, and te xt analysis. e database used in this chal- lenge is the distress analysis inter view corpu s (D AIC- WO Z) [7], [5], which includes dat a from 1 89 subjects. For each subject, the data- base includes t he audio/video features as well as the transcript of an interview ranging b etween 7-33 minutes, which is conducted by an animated virtual interviewer call e d Ellie, controlled by a human interview er in another room. Permission to make digital or hard copies of all or part of this work for personal or classroom use is gr anted without fee provided that copies are not made or distrib uted for profit or commercial advantage and that copies bear this no tice and the full cita- tion on the first page. Copyrights for components of this work owned by others than A C M must be honored. Abstracting with credit is permied. T o copy otherwise, or re- publish, to post on ser vers or to redistrib ute to lists, requir es prior specifi c permission and /or a fee. Request permi ssions from permis sions@acm.org. A VEC’17, Mountain View , CA, USA. © 2017 A CM. 978-1-4503-5502-5/17/10. . . $15.00 DOI: 10.1145/3133944.3133945 Ellie Do you feel down ? Par!cipant ˖ xxxxxxxxxxxxxxxxxxx Ellie What are you ? Par!cipant ˖ xxxxxxxxxxxxxxxxxxx Ellie: Do you travel ? Par!cipant ˖ xxxxxxxxxxxxxxxxxxx Audio Feature Frame 700 ... Frame 1000 Frame 1300 … Frame 1700 Frame 2100 … Frame 2700 Video Feature Frame 210 ... Frame 300 Frame 390 … Frame 510 Frame 630 … Frame 810 7(s)... 10(s) 13(s)... 17(s) 21(s)... 27(s) Transcript Timestamp Topic1 Topic2 Topic3 Subject 1 Ellie Do you trav el? Par!cipant ˖ xxxxxxxxxxxxxxxxxxx Ellie Do you feel do wn? Par!cipant ˖ xxxxxxxxxxxxxxxxxxx Ellie: What are you? Par!cipant ˖ xxxxxxxxxxxxxxxxxxx Frame 800 …. Frame 1100 Frame 2300 … Frame 2600 Frame 3000 … Frame 3200 8(s)... 11(s) 23(s)... 26(s) 30(s)... 32(s) Topic3 Topic1 Topic2 Subject 2 Lexical Feature Topic1 Feature Topic2 Feature Topic3 Feature ĂĂ Subject 1 Subject 2 Frame 240 …. Frame 330 Frame 690 … Frame 780 Frame 900 … Frame 960 Figure 1: Illustration of the pro p osed topic mode ling base d multi-mod al feature vector building scheme. 1.2 Challenges and Contribution A big differ ence b etween the depressi o n detection task and a tra- ditional emotion dete ction task is the decision unit. Since human emotion can change rather quickly , traditional emotion detection typically requires second-level prediction. erefore , popular emo- tion recognition databases usuall y provide labels for short-term recordings, e.g., the IEM OCAP dat abase [ 3] provides labels for each uerance, while t he SEW A database prov ides labels for each seg- ment of 100ms. In contrast, depression is expressed through a p er- sistently low mo od, which is very d iffer ent from short-term sad- ness. e stud y in [18] shows that t he me dian d uration of depres- sion is three months and consequently , predictio n of the depres- sion lev el of an individual should b e based on much longer obser- vation p eriods. is differen ce b etween depression and emotion detection leads to two main challenges: (1) Large de cision unit. In the DAIZ - W OZ database, each data sample is the audio and video recording of an inter- view of a spe cific subject, where the interview ranges from 7 to 33 minutes. Here, only o ne decision needs t o be made for t he entire interview . e length o f the decision unit is much longer than for typical emotion r e cognition tasks, e.g ., the 2017 A VEC emotion sub-challenge requires mak- ing de cisions for each 100ms segment. While a large data volume is typically beneficial for the accur acy , processing large amounts of data can b e challengin g. When analyz- ing very lo ng audio/video data, applying statistical func- tions (e .g., max, min, mean, q uartiles) t o short-term fea- tures over the entir e interview will lead to lo ss of detailed temporal information such as shor t-term sighs in despair , laughing, or anger . Howe ver , these short-term details within the interview can be u seful when determining the depres- sion level of the su b ject, especially w hen analyzed together with co ntextual inf ormation (e .g., sighing in despair when being asked ab out sleep quality , laughing when talking about a journey , and anger when remembering unhappy experiences). erefor e, it is important to map the whole interview to a feature vector such that short-term details and context are maintained. (2) Limite d number of samples. Since each subject has one sample (the entire audio/video recording), the number of samples is significantly lower than in t he case when each recording consists of many small samples (e.g ., each uer- ance b eing a sample). In the 2017 A VEC depression sub- challenge , the number of samples in the training set is only 107. In add ition, the database is unev enly distributed, i.e., the number o f depression samples in the training set is 30. With such a small sample size, the numb er of features should also be small to avoid the p roblems of dimension- ality and overfiin g. Howe ver , the dimensions of audio and video features are very large and therefore , generat- ing and selecting an appropriate number of discriminative features is essential. In order to overcome these two chall enges, we propose a to pic modeling b ased multi-mo dal feature vector build ing scheme as shown in Figure 1 to provide the basis for context-aware analysis. e in- terview is first segmented according to to pics. en, au d io, video, and semantic features are generated for each t opic segment sep- arately and further place d into a separate slot o f the topic in the feature vector . Aer the features for all topics have been placed, a two-step feature selection algorithm is executed to shrink the fea- ture vector and only keep the most discriminative features. e proposed algorithm is inspired by the obser vation that all inter- views contain not a fixe d, but a l imited range of topics. Further , we assume t hat each question by Ell ie triggers a response on a new topic, which makes “topic tracking” feasible . W e expe ct the following advantages from the propose d scheme: (1) Logically organize short-term details based on con- text. When retaining the short-term details of the inter- view , we need t o d o it in a fashion that keeps t he fea- ture v e ctor space relatively small and also makes it logical. Extracting details acco rding to uerances is not context- organizable and will lead t o a dimension explosion since each interview contains hundreds of uerances. For ex- ample, b oth subject 1 and su b ject 2 smile at uerance 10, but their smiling migh t conve y differ ent information since their 10th uerance is in differe nt contexts. In contrast, the proposed scheme tracks the topic and pl ace feature of uerances, no maer where it is in the interview , into the slot of t he t opic it belongs to in the feature vector . In addition, o ne topic can cover multiple uerances, which makes the feature d imension much smaller . (2) More flexible and precise discovery of use ful features. In t r aditional feature building schemes, o ne feature can only be kept or discarded as a whole. H owe ver , it is co m- mon that o ne feature is o nly useful in some specific con- texts and u seless in others. Further , same features in dif- feren t co ntexts might convey different information and should b e regarded as separate features. For example, smil- ing in the context of discussing family can b e more dis- criminative than smiling in the context of greeting so me- one, b ecause the laer might only b e due to etiquee. ere- fore, we would like t o o nly keep the feature when it is in a useful context. e prop o sed feature building scheme provides any combination of features and contexts such as smiling (family) and smiling (gr e eting). us, the fea- ture selection algorithm can p erform a more fle x ible and accurate filtering. In summar y , the proposed scheme al- lows us to perform a finer analysis of the su bject’s reac- tion to a sp ecific topic, such as a lower voice when dis- cussing family , irritation when discussing an unhappy sit- uation, and t he expressions used when describing recent emotions. W e believ e t hat this finer-grained analysis can improv e the perfor mance of depression detection. 1.3 Related W ork In the 2 0 16 A VEC depression classification sub-challenge [19], a few propose d t echniques adopt e d text analysis for their mo del build- ing. In [14] and [13], the text is analyzed on a subject level and au- dio/video features are separately e xt r acted and then fused with se- mantic features, i.e., topic modeling is not used in t hese approaches. In [21], the authors conduct a question/answ er e x traction (which is similar to topic extraction) before text analysis. Howev er , the question/answer extraction is only applied to t ext analysis. Audio and video analysis is still conducted separately . In [22], the au- thors also conduct t opic extraction, but merely use the semantic features of very few topics (3 topics for women and 4 t opics for men) to build a simple de cision t ree. is approach achiev e d the best performance in the 2016 A VEC, which demonstrates the ef- fectiveness of simple mod el and key to pic analysis. Howev er , its performance on the test set is much worse than that on the dev el- opment set. Its limited ability to generalize is p robably du e to the very small number of features. Further , aud io and vide o features are not u se d in this work. On the other hand, t o pic modeling, which is a te chnique to dis- cove r topics from documents, has be en widely adopted in applica- tions such as text mining [9] and recommendation systems [20]. It recently has also been use d for depression and neuroticism assess- ment [16]. In [16], the aut hors demonstrate that taking automati- cally derived to pics into accou nt impro ves prediction p erformance. Howe ver , audio and video analysis are again not involved in this work. In summar y , the work in [21], [22], and [ 16] use t o pic mo del- ing, but o nly for text analysis. W e further extend the application of to pic mod eling by using it for context-aware audio and video analysis. T o the b est of our knowledge, t he prop o sed work is the first effort t o combine topic mo deling with mult i-mo dal text, au dio, and video analysis. 2 TOPIC MODELLI NG BASED MULTI-MOD AL DEPRESSION DETECTION 2.1 T opic Mo deling T opic modeling typically requires a sophisticated algor it hm such as lat ent Dirichlet allo cation (LD A) [2] and network regulariza- tion [ 12]. How ever , for the t r anscription of clinical interviews (such as provided by t he DAIC- WO Z database), to pic mo deling can be do ne much simpler for mult ipl e re asons. First, in t he interview , only Ellie determines the t opic by asking a qu estion and the subje ct does not initiate a topic proactively . Second, the number of topics in clinical interviews is limite d . And third, Ell ie is an animated interview er controlled by human command and, therefore , has a relative l y fixed way to start a topic. W e observed that when start- ing a sp ecific topic, Ell ie chooses one sentence from the libr ar y , which typically consists of o nly 1-3 fixed sentences p er topic. Based on the above-m entioned obser vations, we perform sim- ple topic modeling on the text of interviews. First, we bu ild a preliminary sentence dictionary by traversing all o f Ell ie ’s spee ch and record all non-redundant sentences. en, we perform man- ual cleaning of the preliminary dictionary , where sentences that do not start new topics (e.g. , “that’s goo d”) are discarded. Aer that, we perfor m cl ustering of the dictionary , w here the senten ces that start t he same topic are group ed together . is is do ne in two steps. First, very similar sentences with up to 3 characters differ- ence are cl ustered au tomatically . Seco nd, further manual clu ster- ing and checks are p erformed. en, w e revie w each sentence clus- ter , link each clu st er to the corresponding t opic, and put it into the topic dictionary . e refore, the t opic dictionary is formaed as [ topic name, corresponding Ellie sentences]. e complete list with 83 extracted topics is shown in T able 1. Note t hat only a few top ics are discussed in most interviews, e.g., only 1 4 topics cover ov er 80% of the inter vie ws. In o ther words, topics are sparsely distributed in the interviews. e histogram of the t o pic cover rate is shown in Figure 2. Figure 2: Histogram of topic cover rate. 2.2 Feature s In this work, we use audio, video, and semantic features to bu ild a multi-modal mo del. Audio and video features are provided by the 2017 A VEC organizers while semantic features are extracted by ou rselve s. Al l features are compute d in a topic-wise fashion. 2.2.1 A udio Features. W e use the audio features extracted by the CO V AREP tool kit [4] and formant features. e CO V ARE P tool kit generates a 74-dimensional feature vector that includes com- mon features such as fundamental frequency and p eak slope. For- mant features contain the first 5 formants, i.e. , the vocal tract res- onance frequencies. Bo th CO V AREP and formant features are ex- tracted ev er y 10ms. For each topic, we further apply three st at istic functions (mean, max, and min) to each feature over t ime to re- duce t he dimension. at is, for each topic, ( 74 + 5 ) × 3 = 237 audio features are used . 2.2.2 Video F eatures. W e use the action units (AUs) features extracted by t he Op enFace toolkit [1], which includes the informa- tion of 20 key AUs. For each top ic, we further apply three statistic functions (mean, max , and min) ov er time to each feature to reduce the dimension. us, for each topic, 20 × 3 = 60 video features are used. 2.2.3 Semantic F eatures . For each o f the 83 to pics, we use the Linguistic Inquiry and W ord Count (LIWC) [15] sow are to count the frequency of w o rd presence of the subject’s speech of the topic in 93 categories such as anger , negative emotion, and p ositive emo- tion. at is, the LI W C soware takes the sp eech of a subject and generates a 93-dimensional feature vector . Further , inspired by [22], which demonstrates that some key topics such as sleep quality (topic inde x : 7 8) and PTSD diagnose history (topic index: 82) have a high correlation with depression lev el, we further ex- tract additional semantic features for 8 topics (topic index: 76-83, marked with an asterisk in T able 1) that we b eliev e might b e most discriminativ e. W e use a dictionary based method to classify each topic into 2 or 3 categories according to the content. For example, for the t opic easy sleep (topic inde x : 7 8), the speech of each sub- ject is classified into three categories: easy (when phrases such as ‘no problem’ are p rese nt), fair ( when wor ds such as ‘it depends’ are present), and hard (when words such as ‘ difficult ’ are pre sent). e dictionary is built manually for each key to pic. Topic Presence Topic Presence Key Topic Gender Video Feature Topic 1 Slot Audio Feature LIWC Feature Topic 83 Slot Video Feature Audio Feature LIWC Feature Figure 3: Illustration of the structure of feature ve ctor . 2.3 T opic-wise Feature Mapping In order to conduct context-aware analysis, t he feature vector needs to record t he features of each topic separately . erefore , in t he feature vector , each to pic has a separate slot. W e first find the topics discussed in each interview . For each interview , spe ech sentences of Ell ie are traversed and when t he sentence is found in the topic dictionary , the corresponding t opic T able 1: e list of topics extracte d from the DAIC- W OZ ( potential key topics are marked with an asterisk). Ind. T opic Abbr . Sample Ellie estion Ind. T opic Abbr . Sa mple Ellie estion 1 more can you tell me ab out that 43 best parent what’s the best thing about being a par ent 2 why why 44 are you okay are yo u okay with this 3 l ast happy time tell me about the last time y ou f elt reall y happy 45 mad what are som e things that ma ke you really mad 4 origin where are you from originally 46 they triggered are they triggered by something 5 argue when was the last time yo u argued with some- one and what was it ab out 47 easy parent do you find it easy to b e a parent 6 advice ago what advice would you give to yourself ten or twenty years ago 48 happy did that are yo u happy y ou d id that 7 control temper how are you at controlling your temper 49 therapist affect how has seeing a therapist affected you 8 th ings like la what are s ome things you really like about l a 50 job what are y ou 9 proud what are y ou most proud of in yo ur life 51 symptoms what were your symptoms 10 positive influence who’s someone that’s been a positive influence in your life 52 ideal weekend tell me how you spend your ideal weekend 11 best friend describ e how would your best friend describe you 53 avoid could you hav e done anything to avoid it 12 things dont like la what ar e some things yo u don’t rea lly like about l a 54 do annoyed what do yo u do when y ou are annoyed 13 major what did yo u study at school 55 got in trouble has that goen y ou in trouble 14 regret is there anything you regret 56 your kid tell me about yo ur kids 15 dream job what’s your dream job 57 someone made bad tel l me about a time w hen someone made you feel really badly about y ourself 16 enjoy travel what do yo u enjoy about traveling 58 different parent what are some ways that you ’ re different as a parent than y our parents 17 how hard how hard is that 59 today kid wh at do you think of today’s kids 18 do sleep not well what are you like when y ou d on’t sl eep well 60 down do you feel down 19 experiences what’s one of y our most memorable e xperiences 61 how know them how do you know the m 20 hardest decision tell me about the hardest decision you’ve ever had to make 62 feel oen do you feel th at way oen 21 fun relax what are som e things you like to do for fun 63 problem b efore did you think you had a problem b efore you found out 22 handle differently tell me about a situation that you wish you had handled differently 64 living situation how do you like your living situatio n 23 what decide what made yo u decide to do that 65 why stop why did y ou stop 24 still work are you still doing that 66 how do you do how are you doing today 25 erase memory tell me about an e vent or something that you wish you co uld erase from y our memory 67 roommate do you hav e roomm ates 26 why move la why did yo u mov e to l a 68 hard on you rself do you think that maybe you ’re being a lile hard on y ourself 27 change self what are some things you wish you could change about yourself 69 like l iving with what’s it like f or you living with them 28 b est quality what would you say are s ome of your best qual- ities 70 disturb thought do yo u have disturbing thoug hts 29 oen back how oen do you go back to your home town 71 where live where do you live 30 how long diagnose h ow l ong ago wer e you diagnosed 72 aer millitar y what did y ou do aer the militar y 31 guilty wh at’s something you feel guilty about 73 combat did you ever see combat 32 whe n move la when did you move to l a 74 talk later w hy don’t we talk about that later 33 easy used l a how easy was it f or you to get used to l iving in l a 75 military change how did serving in the military chang e you 34 seek help what got yo u to seek help 76* change beh avior have you noticed any changes in your behavior or thoughts lately 35 whe n last happy when was the last time you felt really happy 77* depression have you b een diagnosed with depression 36 cope how do y ou cope with them 78* easy sleep how easy is it for you to get a goo d night sleep 37 compare la how does it comp are t o l a 79* family close h ow close are you to yo ur family 38 hard parent what’s the hardest th ing about being a par e nt 80* feel ing lately how have you b een feeling lately 39 still therapy do y ou still go to therapy now 81* shy outgoing do you consider y ourself an introvert 40 travel a lot do you trav e l a lot 82* ptsd have yo u ever been diagnosed with p t s d 41 ever served militar y have you ever ser ved in the military 83* ther apy usef ul do you feel l ike therapy is useful 42 whe n last time when was the last time that happened T able 2: Dime nsion of e ach feature cate gory . Feature Name Dime nsion Gender 1 T opic Presence 83 Key T op ic 8 LIWC 7719 Formant 1245 CO V AREP 18426 AUs 4980 Sum 32462 and the subject’s sp eech, together with its timestamps are recorded. e subje ct’s spe ech is used t o generate semantic features while the timestamps are use d to synchronize audio and video features. en, all features are placed into separate sl o ts o f the correspond- ing top ic in the feature vector . A s described in Sect ion 2.2, each topic contains 237 audio features, 60 video features , and 93 LI W C features, and there are 8 3 topics in total, which leads to a 83 ∗ ( 237 + 60 + 93 ) = 32 , 370 d imensi onal feature vecto r . Fur t her , we add the presence of each t opic t o the feature vector , b ecause each inter vie w only covers a few to pics and the topic presence might b e correlated to the subject’s statu s. Finally , gender is also aached to the fea- ture vector similar to the work in [22] and [ 14], where the authors report that gender information can gre at ly improve the classifica- tion performance. Figure 3 illustrates the structu re of the feature vector and T abl e 2 shows the dimension of each feature categor y in the feature vector. Due t o the sparsity of topics, t he feature vector is also sparse, i.e. , the features of topics that are not discussed in an interview are missing. Howev er , the slots for all topics are pre- served in our approach, i.e. , the slot of a topic that is not discussed in the interview is padded wit h -1. 2.4 Feature Selection In Sect ion 2.3, a 32,462-dimensional feature vector is built, w hich maintains audio, video, and text information of each to pic. How- ev er , only a small amount of features are actually useful and we expect the number o f features to be small enough to avoid poten- tial overfiing. eref ore, feature selection is an essen tial step o f the prop osed scheme. W e co nduct feature selection in two steps. First, we conduct a quick mo del-independent feature selection on all features. e algorithm we use in this step is correlation-based feature subset selection (CFS) [ 8], which evaluates t he value of a subset of fea- tures by considering the individual predictive ability of each fea- ture along w ith the degree of redundancy b etween them. Aer this step, a subset o f features is select ed. en, we conduct a fine model-dep endent feature selection to find the o ptimized feature number . In this step, we first rank the features according to their F-value to the corresponding lab el. en we run the regression al- gorithm using a various number o f high-rank features and finally select the b est feature set. is unique t wo-step feature select ion algorithm is designed based on the following consideration. In our feature generation scheme , we observe that more features are correlated to each other than with the context-unaware feature generation scheme, be cause features that belo ng to the same t opic are likely to have high cor- relations. us, if we only conduct feature selection according to the individual feature score, we might get a set o f features with high scores, but that are also clo sely c o rrelated to each other . In other words, many features are redundant and provide lile extra information in this case . T o avoid that, we first conduct a CFS to select a feature subset, where features hav e a high correlation with the label, but low corre lation with each other . Since CFS is a mo del- independent approach, which cannot tell us t he ov erfiing risk for our sp ecific mo del and dataset, we further conduct a model-based selection on our dataset to find the appropriate number of features for our task. 2.5 Regr ession Model Building 2.5.1 Data Balancing. It has be en widely reported that imbal- anced classes o f dat a will greatly affect the performance of ma- chine learning algorithms [11]. Unfortunately , most healthcare related databases, including D AIZ- W OZ, are imbalanced. In the training set of the DAIC- W OZ dat ab ase, only 30 subjects are de- pressed of a t o tal of 107 subjects, which means that there are much more subje cts with low PHQ-8 scores than t hose with high PHQ-8 scores. erefore , we p erform random-oversampling to make t he number of samples for each PHQ-8 score is roughly the same by simply duplicating samples before running the machine learning algorithm. 2.5.2 Regressors. In this w o rk, we p erform a grid search for the following regres sion models: random forest regression (number o f trees: 1, 10, 2 0 , 30, 40, 50, 100 , and 200), sto chastic gradient descent (SGD) regression , and supp ort vector regr ession (SVR) (kernel: lin- ear , p olynomial, and radial basis function (RBF)). 3 EXPERI M ENT AL SET UP 3.1 T est Strategy In the 2017 A VEC challenge, only the tr aining and deve l opment sets of the DAIC- W OZ database are available. H owe ver , perform- ing both optimization and testing on the development set will l ead to significant overfiing on t he dev elopment set. ere fo re , we adopt the following test strategies fo r our experiments: (1) 10-fold stratifie d cross-validation (CV) : In this test strat- egy , the tr ainin g set and development set are concatenated together and then divided into 10 folds in a stratified man- ner . E ach time, one fold is used for testing and another 9 folds are used for training. Note that the random over- sampling and model-dep endent feature select ion are con- ducted aer the dat a spl iing and only o n the training data. Sin ce it is not meaningful to conduct CFS feature selection using cross-validation, the model-independent feature selection is conduc t ed on the entire training and dev elo p ment set, which will lead to an over-optimistic es- timate on the test result, but will not affect other hyper- parameter selections. us, we believe this is the fairest way of testing. All optimizations, including model selec- tion, hyper-parameter t uning, and feature selection, are performed according to the results of CV . (2) T est on the development set (Dev) : In this strategy , we train the model using the official training set and test on the official dev elop ment set. In order to avoid report- ing over-optimistic results on t he dev elop ment set, we do not conduct any o p timization for the deve lopment set. In- stead, we find the b est model, hyper-parameters, and fea- ture numb ers in the CV test and use them to build the model on the training set. (3) T est on the test ing set (T e st) : In this strategy , we train the model using the official training and development set and test on the official test set. is is be cau se we want to use all available data for training to increas e the model ro- bustness. Again, all parameters used in building the model are select ed in the CV test. 3.2 Metrics In this work, we report four metrics fo r each test strategy men- tioned ab ov e: 1) Root mean square error (RMSE) is the chal- lenge t arget; therefore , all optimizations, including mo del selec- tion and feature sele ction, are performed according to this metric. 2) Mean absolute error (MAE) is another metric re port e d by the official baseline [17] and we use it together with RMSE t o analyze the difference b etween ground truth and prediction. 3) Pear son correlation coefficient (CC) is an important metric to evaluate the regr ession performance, which can reflect the linear co rrela- tion between ground truth and prediction. 4) F1-score measures the p erformance of binary depression classification, i.e ., a subject is d epres sed w hen the PHQ-8 score is greater than or equal to 10 and non-depressed other wise. 3.3 Baseline W e compare the proposed metho d with the foll owing baseline meth- ods: (1) Basic Baseline , where the mo del constantly predicts the mean PHQ-8 score o f the t raining set. is is a very basic baseline t hat any workable regress io n algorithm shou l d outp erform. (2) Challenge B aseline , which is the official baseline pro- vided in [17]. is baseline uses a r andom forest regres- sor (numb er of trees = 10) on the audio and video fea- tures extracted by the CO V AREP to olkit [ 4] and OpenFace tool kit [1]. Regress ion is performed on a frame-wise basis and the temp oral fusion ove r the interview is compressed by averaging t he output s over the en t ire interview . Fusion of audio and video mo dalities is perfor me d by averagin g the regression out puts of the unimodal result. In [17], the authors prese nt t he results of aud io unimodal, video uni- modal, and audio/video mult imodal solutions using this baseline approach, where video unimodal has t he best per- formance. erefor e, we use the results of the video uni- modal solution for comparison. (3) Context-una ware Baseline Since the proposed method and the o fficial challenge baseline method have a lot of dif- feren ces in terms of features, regression mo del, and class balancing, it is hard to judge which factor cause any per- formance gap. erefore , we use this baseline to check the effectivene ss o f context-aware analysis. is b aseline method is exactly the same as the proposed method (i.e. , the same aud io, video, and LIWC features are extracted, the same feature sele c t ion algorithms are used, and the regr ession mo del is selecte d from the same grid), except topic mo deling is not used. e differen ces are that fea- tures are extracted and av eraged over the en t ire intervie w (instead of a topic-wise manner) and that topic r elat e d fea- tures (topic presence and key to pic features) are not in- cluded. (4) Proposed Me thod , as described in Section 2 . 4 EV AL U A TION AND DISCUSSION 4.1 Overall Performance rough a grid search in the CV test, we selected the best re gres- sion model (SGD regr essor) and the b est number of features (46). W e then use these seings o n the Dev and T est e x periments. e results of these experiments are shown is T able 3. W e observe that the proposed method achieve s the b est p erformance for all met- rics and test strat egies . Further , we find that the prop osed method performs significantly beer t han the context-unaware baseline, which demonstrates the effectiveness of context-aware analysis. In addition, we obser ve that t he p erformance of the proposed method on the test set is worse than that on the de velopment set and cross validation. is is b ecause the mo del-independent CFS feature se- lection is conducte d not in a cross-validation manner , but instead on the entire training and dev elopment set, since it is meaning- less to conduct CFS in a cross-validation manner . Howe ver , the performance of the prop osed method is still much higher than the challenge baseline on the test data. 4.2 Selected Feature Analysis Figure 4: Distribution of topic s corresponding t o the se - lecte d featu res (count in parentheses). Le: pr opose d fea- ture sele ction algorithm. Right: b a seline featu re select ion algorithm. It is very intere st ing to see which features are actually sele cted and useful in depressi on detection. In our feature building scheme, each feature corresponds to one topic and one feature category . As shown in Figure 4 (l e ), from the p erspective of the topics in- volved, we obser ve that 31 topics out of the t otal 83 topics are in- volved, in which the mo st frequent topics corresponding to the T able 3: Result of the depression regression experiment 1 RMSE MAE CC F1-Score CV Dev T est CV Dev T est CV Dev T est CV Dev T est Basic baseline 5.84 6.57 / 4.81 5.50 / -0.35 0.00 / 0.00 0.00 / Challenge baseline / 7.13 6.97 / 5.88 6.12 / / / / / / Context-unaware baseline 5.55 5.02 / 4 .56 4.42 / 0.45 0.69 / 0.58 0 .67 / Proposed method 3.68 3.54 4.99 2.94 2.77 3.96 0.78 0.87 / 0.80 0.70 0.60 selected features are topic 30: how long diagnose, 31: guilty , 34: seek help, and 77: depre ssion. Further , we observe that our ap- proach u ses a variety of topics that seem not clo sely related to depression from humans’ persp ective such as topic 6: advice ago and 16 : enjoy travel. I n addition, to check t he effectiven ess of the prop o sed two-step feature select ion al gor ithm, we co mpare it with a baseline feature selection algorithm that only consists of step 2 o f the proposed metho d, which only considers the score of each feature individually . As shown in Figure 4 (right), the feature vector selected by the baseline feature selection algorithm only in- cludes three topics: 3 0 : how long diagnose, 34: se ek help, and 39: still therapy . W e conduct an experiment using this feature vector and find that the r esult (RMSE: 5.60) is much worse than t he re su lt of the propose d approach (RMSE: 4.99) on the test set. is demon- strates that the prop osed t wo-step feature selection algorithm is able to discover independent features and t o impro ve the result. While it is p ossible that topics 30, 34, and 39 are the clo sest re- lated topics of depression, taking more topics into consideration can lead to a more p recise prediction. W e b eliev e that it is also an advantage of the proposed metho d over a clinician’s analysis, be- cause for a clinician it is very hard to obser ve and mo del such a large volume of factors in the inter view . Key Topic(2) LIWC(2) COVAREP(33) AUs(9) Figure 5: Dist ribution of fe ature categories corresponding to the selecte d features (count in parentheses). From t he p erspective of feature categories involved, we observe that t he selected feature set involve s LI W C features, key to pic se- mantic fe atures, COV AREP aud io features, and AUs video features. e two key topics involved are 78: easy sleep and 80: feeling lately . e gender feature, topic presence feature, and the formant fea- tures are not involv e d. A co mplete pie chart of the distribu t ion of feature categories corresponding to the select ed feature set is shown in Figure 5. 4.3 Regression Model and Feature Number Analysis 5 10 15 20 25 30 35 40 45 Number of Features 3.5 4 4.5 5 5.5 Root Mean Square Error RF(40) SGD SVR(RBF) Figure 6: e relationship betwee n RMSE and nu mber of fea- tures and regression mode ls. 5 10 15 20 25 30 35 40 45 Number of Features 0.5 0.6 0.7 0.8 Correlation Coefficient RF(40) SGD SVR(RBF) Figure 7: e relationship b etween CC and numb er of fe a- tures and regression mode ls. 1 Due to the limited number of test aempts allowed in the 2017 A VEC, we are not able to provide the resu lts on the test set for the ba seline approaches. e challenge baseline paper [17] does not include test results of CC and F1-score and does a lso not include results tested in CV ma nner . T wo import ant hyperparameters in t he prop osed metho d are the number of features and the regr ession model. us, we per- formed a grid search in cross validation manner for the fo l low- ing reg ression models: random forest regressi on (RF) (number of trees: 1, 10, 20, 3 0, 40, 5 0, 10 0, 200 ), SGD regres sion, and support vector regression (SVR) (kernel: linear , polynomial, and RBF), and the following feature numbers: 1-46 (the total number o f features in the sub set selecte d by the first round CFS feature select ion is 46). e relationship between regres sion performance and hyper- parameters is shown in Figure s 6 and 7. Fo r clarity , we o nly p lot the t o p 3 regression models with the best performance. W e observe that when the feature number is small, the random forest regr essor (tree number = 40), SGD regressor , and SVR (RBF) regr essor perform similarly . Howe ver , with the increase of feature numbers, SGD and SVR mo dels continually improv e t heir p erfor- mance while the random forest mo del stops improving much ear- lier . e SGD and SVR regres sor have close performance, while the SGD regre ssor has a lile bit lower RMSE than SVR. ough the lowest RMSE is achiev ed when the feature numb er is 4 1 , we believe it is more l ikely t o b e a fluctuation in the CV test and there- fore we choose the feature numb er o f 4 6 , because we prefer to use more features to build a more discriminative mo del. e exper- iment shows t hat using 46 features (RMSE: 4.99) yields a beer performance than using 41 features (RMSE:5.22) o n the test set. 5 CONCLUSIONS Major depressive d isorder is a w idespread mental disorder and ac- curate detect ion will be essential for t argeted intervention and treat- ment. In this challenge , part icipants are asked to build a model pre- dicting the depression leve l s based on the audio, video, and text of an interview ranging b etween 7-33 minutes. Since averaging features over the entire interview will lose most temporal details, how to d iscov er , capture, and preserve important temporal details for such long interviews are significant challenges. erefor e, we propose a novel top ic modeling b ased approach to perform context- aware analysis. Our e x periments show t hat the prop osed approach performs significantly b eer t han context-unaware metho d and the challenge baseline for all metrics. In addition, b y analyzing the features sele cted by the machine learning algorithm, we found that o u r approach has the abilit y to discove r a variety of temp o- ral features that have underlying relationshi p with depres sion and further t o bu ild model on them, which is a task t hat is difficult to perform by humans. REFERENCES [1] T adas Baltruˇ saitis, Peter Robinson, a nd Louis-P hilippe Morency. 2016. Open- face: an open s ource facial behavior analysis toolkit. In A pplications of Computer Vision (W ACV), 2016 IEEE Winter Conference on . IEEE, 1–10. [2] David M Blei, Andrew Y Ng, and Michael I Jordan. 2003. Latent dirichlet alloca- tion. Journal of machine Learning r esearch 3, J an (2003), 993–1022. [3] Carlos Bus s o, Mur taza Bulut, Chi-Chun Lee, Abe Kazemzadeh, Emily Mower , Samuel Kim, Jeannee N Chang, Sungbok Lee, and Shrik anth S Nar ayanan. 2008. IEMOCAP: Interactive emotional dyadic motion capture database. Language resources and evaluation 42, 4 (2008), 335. [4] Gilles D egoex, John Kane , omas Drugman, Tuomo Raitio, and Stefan Scherer . 2014. CO V AREP: A collaborative voice analysis repository for speech technologies. In Acoustics, Speech and Signal Processing (ICASSP), 201 4 IEEE In- ternational Conference on . IEEE, 960–964. [5] David DeV ault, Ron Artstein, Gra ce Benn, T eresa Dey, Ed Fast, Alesia Gainer, Kallirroi Georgila, J on Gr atch, Arno Hartholt, Ma r gaux Lhommet, et al. 2014. SimSensei Kiosk : A vi rtual human interviewer for healthcare decis ion support. In Proceedings of the 2014 international c onference on Autonomous agents and multi-agent s ystems . International Foundation for Auton omous Agents a nd M ul- tiagent Systems, 1061–1068. [6] Maurizio Fava a nd Kenneth S Kendler . 2000. Major depressive disorder. Neuron 28, 2 (2000), 335–341. [7] Jonathan Gra tch, Ron Artstein, G ale M Lucas, Giota Stra tou, Stefan Scherer , Angela Naz a rian, Ra chel W ood, J ill Boberg, David DeV ault, Stacy Ma rsella, et al. 2014. e Distre s s Analysis Inter view Corpus of huma n and computer inter- views. In LREC . 3123–3128. [8] MA Hall. 1998. Correlation-based feature subset selection for machine learning. esis subm ied in partial fulfillment of the req uirements of the degree of Doctor of Philosophy at the University of W aikato (1998). [9] Liangjie Hong and Brian D Da vison. 2010. Empirica l study of topic modeling in twier . In Proceedings of the firs t workshop on social m edia analytics . ACM, 80–88. [10] Kurt Kroenke, Tara W Strine, Rober t L Spitzer, Janet BW Williams, J oyce T Berry, and Ali H Mokdad. 2009. e PHQ-8 as a measure of current depress i on in the general population. Journal of affective disorders 114, 1 (2009), 163–173. [11] Xu- Ying Liu, Jianxin Wu, and Zhi-Hua Zhou. 2009. Exploratory u ndersampling for class-i mbalance learning. IE EE Transactions on Systems, Man, and Cyb ernet- ics, Part B (Cybernetics) 39, 2 (2009), 539–550. [12] Qiaozhu Mei, Deng C ai, Duo Zhang, and ChengXiang Zhai . 2008. To pic model- ing with net work regulariz ation. In Pr oceedings of the 17th international confer- ence on Worl d Wide W eb . A CM, 101–110. [13] Md Nasi r, Arindam Jati, Prashanth G urunath Shivakumar, Sandeep Nal- lan Chakravar thula, a nd Panayiotis Georgiou. 2016. Multimodal and multires- olution depression detection from speech and facial landmark features . In Pro- ceedings of the 6th International W orkshop on Au dio/Visual Emotion Challenge . A C M, 43–50. [14] Anastasia Pampouchidou, Olympia Simantiraki, Amir Fazlollahi, Mahew Pedi- aditis, Dimitris Ma nousos, Alexandros Roniotis, Georgios Gi annakakis, Fab rice Meriaudeau, Panagiotis Simos, Kostas Ma rias, et al. 2016. Depress ion Assess- ment by Fusing High a nd Low Level Features from Audio , Video, and T ext. In Proceedings of the 6th International W orkshop on Au dio/Visual E motion Challenge . A C M, 27–34. [15] James W Pennebaker, Ryan L Boyd, Kayla Jordan, and Kate Blackburn. 2015. e develop m ent and psychometric properties of LIWC2015 . Technical Report. [16] Philip Resnik, And erson Garron, and Rebecca Resnik. 2013. Using topic model- ing to improve prediction of neuroticism and depression. In Proceedings of the 2013 Conference on Empirical Methods in Natural . Association for C omputational Linguistics, 1348–1353. [17] Fabien Ringeval, Bj ¨ orn Schuller , M ichel Valstar , Jonathan Gratch, Roddy C owie, Stefan Scherer, Sharon Mozgai, Nicholas Cummins, Maximilian Schmi, and Maja Pantic. 2017. A VEC 2017: Rea l- life Depression, and Affect Recognition W orks hop and Cha llenge. In Proceedings of the 7th International W orks hop on Aud io/V isual Emotion Challenge . A CM, 1–8. [18] JAN Spijker, Ron De Graaf, Rob V Bijl, Aartjan TF Beek m a n, Johan Ormel, and Willem A Nolen. 2002. D uration of major depressive episodes in the general population: results from e N etherlands Mental Health Survey and Incidence Study (NEMESIS). e British journal of psychiatry 181, 3 (2002), 208–213. [19] Michel Valstar , Jonathan Gra tch, Bj ¨ o rn Schuller , Fabien Ringeval, D ennis Lalanne, Mercedes T orres T orr es, Stefan Scherer , Giota Stratou, Roddy Cowie, and Maja Pantic. 2016. A vec 2016: Depr ession, mood, a nd emotion recogni- tion workshop and challenge. In Proceedings of the 6th International W orkshop on Audio/Visual E motion Challenge . ACM, 3–10. [20] Chong Wang and David M Blei. 2011. C ollaborative topic modeling for recom- mending scientific a rticles. In Proceedings of the 17th ACM SIGKDD international conference on Knowledge discovery and data mining . A CM, 448–456. [21] James R Williamson, Elizabeth Godoy , Miriam Cha, Ad r ianne Schwarzentru- ber, Pooya Khorrami, Y oungjune Gwon, Hsiang- Tsung Kung, C harlie Dagli, and omas F atieri. 2016. Detecting Depression using V ocal, Facial a nd Seman- tic Communication Cues. In Proc eedings of the 6th International W orkshop on Aud io/V isual Emotion Challenge . A CM, 11–18. [22] Le Y a ng, Dongmei Jiang, Lang He, Ercheng Pei, Meshia C ´ edric Oveneke, a nd Hichem Sahli. 2016. Decision Tree Based D epression Clas sification fr om Audio Video and Language Information. In Proceedings of the 6th International W ork- shop on Audio/Visual Emot ion Challenge . A CM, 89– 96.
Original Paper
Loading high-quality paper...
Comments & Academic Discussion
Loading comments...
Leave a Comment