First-order bifurcation detection for dynamic complex networks
In this paper, we explore how network centrality and network entropy can be used to identify a bifurcation network event. A bifurcation often occurs when a network undergoes a qualitative change in its structure as a response to internal changes or e…
Authors: Sijia Liu, Pin-Yu Chen, Indika Rajapakse
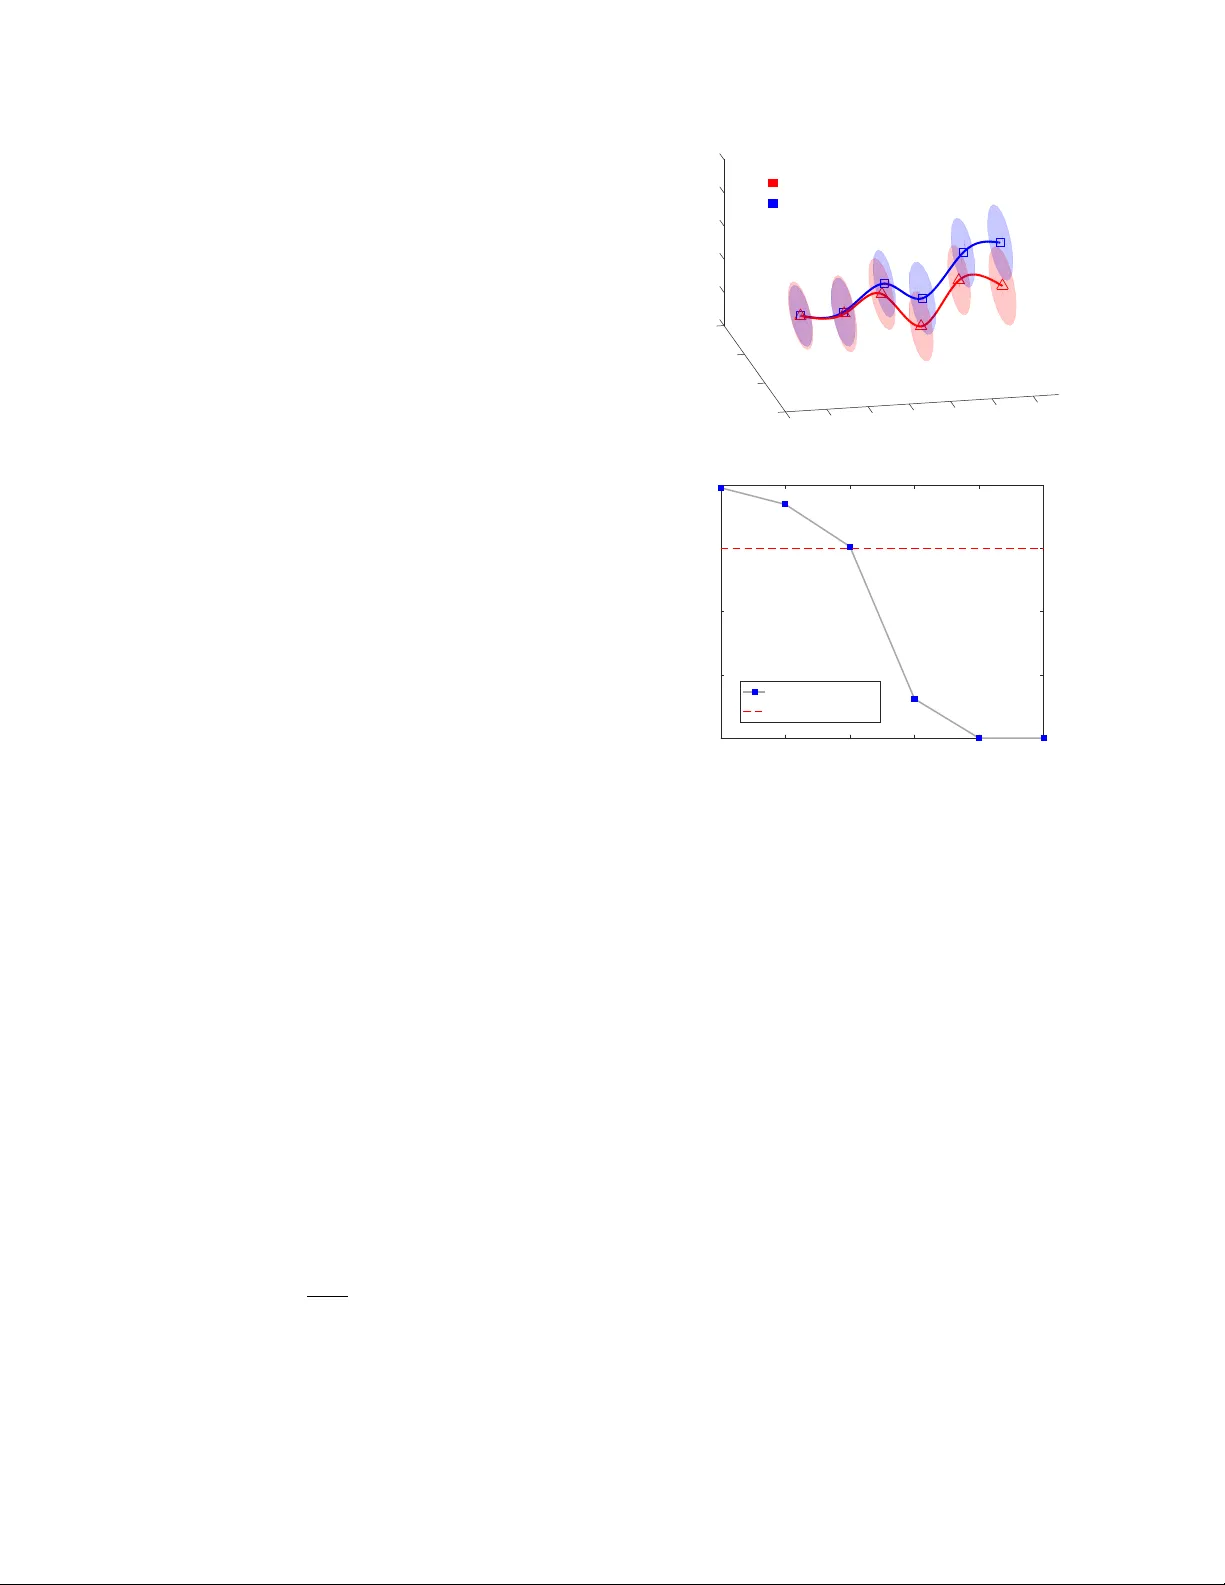
FIRST -ORDER BIFURCA TION DETECTION FOR D YNAMIC COMPLEX NETW ORKS Sijia Liu † , ∗ , Pin-Y u Chen § , Indika Rajapakse ‡ , Alfr ed Her o † † Department of Electrical Engineering and Computer Science ‡ Department of Computational Medicine & Bioinformatics Uni versity of Michigan, Ann Arbor , MI 48109, USA § IBM Research AI, Y orkto wn Heights, NY 10598, USA ∗ MIT -IBM W atson AI Lab, IBM Research, Cambridge, MA 02142, USA ∗ , § { sijia.liu, pin-yu.chen } @ibm.com † , ‡ { indikar , hero } @umich.edu ABSTRA CT In this paper , we explore how network centrality and netw ork entropy can be used to identify a bifurcation network ev ent. A bifurcation often occurs when a network undergoes a quali- tativ e change in its structure as a response to internal changes or e xternal signals. In this paper , we show that network cen- trality allows us to capture important topological properties of dynamic networks. By extracting multiple centrality fea- tures from a network for dimensionality reduction, we are able to track the network dynamics underlying an intrinsic low-dimensional manifold. Moreo ver , we employ von Neu- mann graph entrop y (VNGE) to measure the information di- ver gence between networks over time. In particular , we pro- pose an asymptotically consistent estimator of VNGE so that the cubic comple xity of VNGE is reduced to quadratic com- plexity that scales more gracefully with netw ork size. Finally , the ef fectiv eness of our approaches is demonstrated through a real-life application of cyber intrusion detection. Index T erms — Bifurcation, centrality , graph Laplacian, von Neumann graph entrop y , temporal network 1. INTR ODUCTION Many real-world comple x systems ranging from physical systems, social media, financial markets and ecosystems to chemical reaction mechanisms are often represented as net- works (or graphs) that possibly change over time [1 – 4]. In a network representation, a set of elementary units, such as human, gene, sensor , or other types of ‘nodes’, are connected by ‘edges’ that describe relationships between nodes such as physical link, spatial vicinity , or friendship. Network repre- sentations allow us to explore structural properties of dynamic systems, and thus to study their beha viors, e.g., anomaly de- tection in c yber networks and community detection in social networks [5, 6]. In a dynamic system, there often exists a This work is supported, in part, by DOE grant de-na0002534, the D ARP A Biochronicity Program and the D ARP A Deep-Purple and FunCC Program. critical time instant at which the system shifts abruptly from one state to another . This critical threshold is associated with a first-order bifurcation [7] that occurs when a small change made to the system results in a sudden change of the system’s behavior . For example, a bifurcation of biological system was detected in the process of cell dev elopment when cells choose between tw o dif ferent fates [8 – 11]. In this paper , we aim to e xplore how network-based approaches can be used in bifurcation detection. Centrality measures provide important means of under- standing the topological structure and dynamic process of complex networks [12]. Depending on the type of nodal in- fluence to be emphasized, dif ferent centrality measures, such as degree, eigen vector , clustering coefficient, closeness and betweenness, are commonly used in the literature [1]. For example, degree centrality measures the total number of con- nections a node has, while eigenv ector centrality implicitly measures the importance of a node by the importance of its neighbors. Network centrality allows us to capture multiple structural features from a single network, and thus expands the feature set for graph learning under limited network data samples. In this paper , we propose a spectral decompo- sition approach that inte grates multiple network centrality features for graph learning. It is worth mentioning that our work is dif ferent from graph principal components analysis (PCA) [13, 14], where a graph Laplacian matrix was used to construct a smooth regularization function in PCA by as- suming that the data manifold is encoded in the graph. In contrast to graph PCA, our approach finds the intrinsic low- dimensional manifold embedded in the centrality features. W e sho w in this paper that the use of netw ork centrality helps to identify differences in temporal netw orks. In addition to network centrality , we employ von Neu- mann graph entropy (VNGE) to quantify the intrinsic network complexity . VNGE was originally introduced by [15], de- termined by the spectrum of the graph Laplacian matrix. It was shown in [16 – 18] that VNGE can measure the amount of information encoded in structural features of networks. For example, the entropy of random netw orks, e.g., Erd ˝ os-R ´ enyi random graphs, is larger than the entropy of scale-free net- works under the same average nodal degree [18, 19]. Com- pared to the e xisting graph entropy measures using notions of either randomness complexity or statistical complexity [20, 21], the main advantage of VNGE is its computational effi- ciency , leading to O ( n 3 ) complexity in which n is the net- work size. Here, we further improv e the cubic complexity to O ( n 2 ) by deri ving a quadratic approximation to the VNGE. W e sho w that such an approximation is asymptotically con- sistent, con ver ging to the VNGE under mild conditions. Our experiments on a real-life application, cyber intrusion detec- tion, demonstrate that the proposed approaches can ef ficiently track the structural changes of dynamic networks and identify bifurcation ev ents. 2. PRELIMINARIES: GRAPH REPRESENT A TION A graph yields a succinct representation of interactions among nodes. Mathematically , we denote by G = ( V , E , W ) an undirected weighted graph, where V and E denote the node and edge sets with cardinality |V | = n and |E | = m , and W ∈ R n × n is a weighted matrix with entry W ij (or [ W ] ij ) satisfying W ij = 0 if i = j or ( i, j ) / ∈ E . The quantitativ e study of G is often performed under its graph Laplacian matrix L = D − W , where D = diag ( W1 ) is the degree matrix. Here diag( a ) denotes the diagonal matrix with diagonal vector a , and 1 is the vector of all ones. It is known from spectral graph theory [22] that the second small- est eigenv alue of L , called Fiedler number (FN), measures the network connecti vity . And the number of zero eigenv alues of L gives the number of connected components of G . Using the above notation, a dynamic network in a period of length T can be represented as a sequence of graphs {G t } T t =1 , where G t = ( V t , E t , W t ) . Throughout the paper, we assume that the dynamic network contains the same set of nodes with |V t | = |V | = n for any t . 3. NETWORK DIA GNOSTICS VIA CENTRALITY ANAL YSIS In this section, we introduce a graph diagnostic method that combines multiple centrality features to e valuate nodal im- portance to the network structure. By decomposing a single graph into multiple centrality features, we are able to achieve dimensionality reduction and feature decorrelation of the graph. W e introduce se veral centrality measures of G that will be used in the sequel to define our feature set. De gr ee (De g) of node i is defined as Deg( i ) = L ii = P n j =1 W ij , where L is the graph Laplacian matrix. Eigen vector centrality (Eig) is defined as the eigenv ector of the adjacency matrix W associated with its lar gest positi ve eigen value λ max . The eigen vector centrality of node i is given by Eig ( i ) = [ v ] i satisfying λ max v = Wv . Eigen vector cen- trality measures the importance of a node by the importance of its neighbors [1]. Local F iedler vector centrality (LFVC) ev aluates the impact of node remov al on the network connectivity and partition [6]. LFVC of node i is giv en by LFVC( i ) = P j ∈{ j | ( i,j ) ∈E } ([ f ] i − [ f ] j ) 2 , where f is the eigenv ector (known as Fiedler vector) of L associated with the small- est non-zero eigen value. Closeness (Clos) is a global measure of geodesic distance of a node to all other nodes [23]. Let ρ ( i, j ) denote the short- est path distance between node i and node j in a connected network. The closeness of node i is defined as Clos( i ) = 1 P j ∈V ,j 6 = i ρ ( i,j ) . Betweenness (Betw) measures the fraction of shortest paths passing through a node relative to the total number of shortest paths in the netw ork [24]. The betweenness of node i is defined as Betw( i ) = P l 6 = i P j 6 = i,j >l φ lj ( i ) φ lj , where φ lj is the total number of shortest paths from node l to j , and φ lj ( i ) is the number of such shortest paths passing through node i . Local clustering coefficient (LCC) quantifies how close a node’ s neighbors are to become a complete graph [25]. LCC of node i is giv en by LCC( i ) = |{ ( j,l ) | j ∈N i ,l ∈N i , ( j,l ) ∈E }| |N i | ( |N i |− 1) / 2 , where N i is the neighborhood set of node i . Other topological features: The set of hop w alk statistics is another useful network feature that takes into account indi- rect interactions among nodes. A node’ s h -hop walk weight is gi ven by the sum of edge weights associated with paths de- parting from this node and traversing through h edges [26]. Moreov er, given a set of reference nodes of interest, one can further expand the feature set by computing graph distances from reference nodes to other nodes [8]. Let X t ∈ R n × p denote the centrality-based feature ma- trix for a network at time t , where n is the graph size, and p is the number of centrality features. In contrast to graph PCA methods, which are often limited to undirected and con- nected graphs, our approach can be applied to directed and disconnected graphs. This is due to the f act that centrality fea- tures are also defined for directed and disconnected graphs. After acquiring the feature matrix X t , both linear and non- linear dimensionality reduction techniques [27] can be ap- plied. As a result, we obtain a lo w-dimensional data repre- sentation Y t ∈ R n × l with l ≤ p . T o better track the state of a dynamic network, we fit the data Y t to a minimum v olume ellipsoid (MVE), representing a certain confidence region for the state [28]. The MVE es- timate at time t can then be acquired by solving the con vex program minimize Q ∈ R l × l , b ∈ R l det( Q − 1 ) subject to k Qy i,t − b k 2 ≤ 1 , i ∈ N α Q 0 , (1) where Q and b are optimization v ariables, y T i,t denotes the i th row of Y t , and N α denotes the set of data within a α confidence re gion, determined by Mahalanobis distances of data belo w α = 97 . 5% quantile of the chi-square distrib u- tion with l degrees of freedom [28]. The rationale behind problem (1) is that P : = Q 2 and c : = Q − 1 b defines the ellipsoid { x ∈ R l | ( x − c ) T P ( x − c ) ≤ 1 } , where the de- terminant of P (or Q ) is in versely proportional to the v olume of this ellipsoid [29]. Since problem (1) in volves a linear m a- trix inequality , it can be solv ed via semidefinite programming (SDP), e.g., the sdp solver in CVX [30]. The complexity of SDP is approximately of order O ( a 2 b 2 + ab 3 ) [31], where a and b denote the number of optimization v ariables and the size of the semidefinite matrix, respectiv ely . In (1), we ha ve a = l + ( l + 1) l/ 2 and b = l , yielding the complexity O ( l 6 ) . Thanks to dimension reduction, problem (1) can be ef ficiently solved under a reduced feature space with small l . 4. V ON NEUMANN GRAPH ENTROPY V on Neumann entropy (or quantum entropy) w as originally used to measure the in-compressible information content of a quantum source, and can characterize the departure of a dynamical system from a pure state with zero entropy [16]. Recently , the von Neumann entropy of a graph, kno wn as von Neumann graph entropy (VNGE), was used to ef ficiently measure the graph comple xity [17]. By constructing a scaled graph Laplacian matrix L c : = c L with c = 1 / trace( L ) , VNGE can be defined as [16, 18] V = − n X i =1 λ i log λ i , (2) where trace( · ) denotes the trace operator of a matrix, { λ i } n i =1 are eigen values of L c , and the conv ention 0 log 0 = 0 is used since lim x → 0 + x log x = 0 . It is clear from (2) that VNGE can be interpreted as the Shannon entropy of the probability distribution represented by { λ i } n i =1 under the conditions that λ i ≥ 0 for any i and P n i =1 λ i = 1 . Therefore, regular graphs with an uniform distribution of { λ i } n i =1 provides an upper bound on VNGE. It was proved by [19] that the VNGE of Erd ˝ os-R ´ enyi random graphs saturates this upper bound. In (2), VNGE requires the full eigenspectrum of the graph Laplacian matrix, and thus has the cubic computational com- plexity O ( n 3 ) . In Proposition 1, we propose an approximate VNGE that scale more gracefully with the network size n . Proposition 1 The quadratic appr oximation Q of VNGE V in (2) is given by Q = 1 − c 2 d T d + 1 T ( W ◦ W ) 1 , (3) wher e d is the diagonal vector of L , W is the weighted adja- cency matrix, and ◦ denotes the entrywise pr oduct. Mor eover , Q → V log n , n → ∞ , when n + ∼ n and λ max ∼ λ min , wher e n + denotes the number of positive eigen values of L c , λ max and λ min de- note the lar gest and smallest nonzer o eigen values of L c , and for two functions f ( n ) and g ( n ) 6 = 0 , f ( n ) ∼ g ( n ) means lim n →∞ f ( n ) /g ( n ) = 1 . PC2 PC3 PC1 -0.06 -0.04 0.1 -0.02 0 0.02 0.05 0.04 0 0.06 0.04 0.02 0 -0.05 -0.02 -0.04 -0.06 -0.08 Abnormal graph sequence Normal graph sequence day 1 2 3 4 5 6 (a) 1 2 3 4 5 6 Time (day) 10 -8 10 -6 10 -4 10 -2 10 0 P-value P-value trajectory P-value = 0.01 (b) Fig. 1: Centrality-based bifurcation detection. (a) MVEs of central- ity features within 97 . 5% confidence region. (b) P v alue vs time. Proof: See Proof in Sec. 7. In contrast with (2), the quadratic approximation (3) yields an improv ed computational complexity of order O ( n 2 ) . Moreov er, Proposition 1 implies that the asymptotic consis- tency of Q with respect to V is guaranteed up to a constant factor log n . The condition n + ∼ n implies that the number of disconnected components (giv en by n − n + ) is ultimately negligible compared to n . The condition λ max ∼ λ min implies that a graph Laplacian matrix has balanced eigen- spectrum. This condition holds in regular and homogeneous random graph [18]. 5. EXPERIMENT AL RESUL TS In this section, we demonstrate the effecti veness of network centrality and VNGE in first-order bifurcation detection. W e conduct our experiments using the UNB intrusion detection ev aluation dataset [26, 32]. Here two graph sequences (with known adjacency matrices) are giv en in a time period of 6 days, and each of them corresponds to a cyber network in which each node is a machine and an edge implies the pres- ence of communication between machines. The first graph se- quence describes the normal activity of cyber networks from day 1 to day 6 . The second graph sequence includes abnor- mal networks under denial of service (DoS) and infiltrating attacks from day 4 to day 6 . In Fig. 1, we present principal component analysis based on network centrality features e xtracted from normal and ab- normal networks. In Fig. 1-(a), we present MVEs that fits the 3D representations of network centrality features obtained from PCA. Here the trajectory of centroids is smoothed using the cubic spline. As we can see, there exists a diver gence between the normal graph sequence and the abnormal graph sequence. The abrupt change from day 3 to day 4 reflects the anomalous beha vior of the network after day 3 when the attack beg an. The observed branching trajectory can be inter - preted using the concept of bifurcation [7]: there e xists a bi- furcation of order 1 in the sense that two simultaneous trends starting from the same type of networks (non-attacked) be- come separated from each other, tow ard tw o dif ferent types of networks (non-attack ed versus attacked). In Fig. 1-(b), we ev aluate the significance of the difference between the normal graph sequence and the abnormal graph sequence. Here the P value is defined from the Hotelling’ s T -squared test [33] asso- ciated with the null h ypothesis that the centroids of ellipsoids from the normal and abnormal graph sequences are identical at a given time point. Clearly , day 4 is the critical time for cyber intrusion with P v alue < 0 . 01 . 1 2 3 4 5 6 Time (day) -2 -1.5 -1 -0.5 0 0.5 1 1.5 2 Z-score of VNGE Abnormal graph sequence Normal graph sequence VNGE Approximate VNGE Fig. 2: VNGE of cyber networks o ver time. In Fig. 2, we present VNGE of the studied two graph se- quences, where VNGE is shown by its Z-score, which is nor - malized ov er time to have zero mean and unit variance. As we can see, the entropic pattern of the normal graph sequence is quite different from that of the abnormal sequence. Simi- lar to Fig.,1, there exists a first-order bifurcation after day 3 . An interesting observation is that the VNGE of abnormal net- works after bifurcation is lo wer than normal networks prior to bifurcation. That is because the network becomes more het- erogeneous under attacks, e.g., DoS attack is accomplished by flooding some targeted machines with superfluous requests in an attempt to overload these hosts. And the VNGE decreases when the degree heterogeneity of a network increases [16, 18]. W e further note that the approximate VNGE is close to the exact VNGE o ver time, implying the effecti veness of our pro- posed low-comple xity approximation giv en by (3). 6. CONCLUSION This paper showed how one can use network centrality and VNGE to detect bifurcation of dynamic comple x networks. Network centrality enables us to capture important topologi- cal properties of dynamic networks, and VNGE provides an efficient approach to measure the information di vergence be- tween dynamic networks. When applied to cyber intrusion detection, our approaches ef fectively detected the network bi- furcation ev ent. In the future, we would like to delve into the relation between bifurcation and network entropy . W e will also apply our approaches to other real-life applications. 7. PR OOF OF PROPOSITION 1 Based on T aylor series expansion of log x = P ∞ k =1 ( − 1) k − 1 k ( x − 1) k at x = 1 , we hav e quadratic approximation V ≈ Q = − n X i =1 λ i ( λ i − 1)=1 − n X i =1 λ 2 i = 1 − n X i =1 n X j =1 [ L c ] 2 ij ( a ) = 1 − c 2 n X i =1 L 2 ii + n X i =1 X j 6 = i L 2 ij = (3) , where the equality ( a ) holds due to the definition of L c in (2), and [ A ] ij (or A ij ) represents the ( i, j ) -th entry of a matrix A . Assuming L c has at least tw o nonzero eigen values, which implies 0 < λ i ≤ λ max < 1 for any nonzero eigen value λ i . W e rewrite V as V = − X i : λ i > 0 λ i ln λ i = − X i : λ i > 0 λ i (1 − λ i ) ln λ i 1 − λ i . (4) Since for all λ i > 0 , ln λ min ≤ ln λ i ≤ ln λ max < 0 and 0 < 1 − λ max ≤ 1 − λ i ≤ 1 − λ min < 1 , we obtain the relation − ln λ max 1 − λ min ≤ − ln λ i 1 − λ i ≤ − ln λ min 1 − λ max . (5) Using Q = P n i =1 λ i (1 − λ i ) = P i : λ i > 0 λ i (1 − λ i ) and applying (5) to (4), we hav e − Q ln λ max 1 − λ min ≤ V ≤ − Q ln λ min 1 − λ max . (6) Let λ max = a n and λ min = b n for some constants a, b such that a ≥ b > 0 . W e obtain lim n →∞ − 1 ln n · ln λ max 1 − λ min = lim n →∞ 1 ln n · ln n − ln a 1 − b n = 1 . Similarly , lim n →∞ − 1 ln n · ln λ min 1 − λ max = 1 . T aking the limit of V ln n and applying the above results into (6), we finally obtain lim n →∞ V ln n − Q = 0 . 8. REFERENCES [1] M. Newman, Networks: An Intr oduction , Oxford Univ ersity Press, 2010. [2] Alexander Bertrand and Marc Moonen, “Seeing the bigger picture: How nodes can learn their place within a complex ad hoc network topology , ” IEEE Signal Pr ocessing Magazine , vol. 30, no. 3, pp. 71–82, 2013. [3] A. Sandryhaila and J. M. F . Moura, “Big data analysis with signal processing on graphs: Representation and processing of massiv e data sets with irregular structure, ” IEEE Signal Pr o- cessing Magazine , v ol. 31, no. 5, pp. 80–90, Sept. 2014. [4] P .-Y . Chen and K.-C. Chen, “Information epidemics in com- plex networks with opportunistic links and dynamic topology , ” in IEEE Global T elecommunications Confer ence (GLOBE- COM) , 2010, pp. 1–6. [5] L. Akoglu, H. T ong, and D. Koutra, “Graph based anomaly detection and description: a survey , ” Data Mining and Knowl- edge Discovery , v ol. 29, no. 3, pp. 626–688, 2015. [6] P .-Y . Chen and A. O. Hero, “Deep community detection, ” IEEE T ransactions on Signal Pr ocessing , vol. 63, no. 21, pp. 5706–5719, 2015. [7] R. Borchert and N. A. Slade, “Bifurcation ratios and the adap- tiv e geometry of trees, ” Botanical Gazette , vol. 142, no. 3, pp. 394–401, 1981. [8] S. Liu, H. Chen, S. Ronquist, L. Seaman, N. Ceglia, W . Meixner , L. A. Muir , P .-Y . Chen, G. Higgins, P . Baldi, S. Smale, A. Hero, and I. Rajapakse, “Genome architecture leads a bifurcation in cell identity , ” bioRxiv , 2017. [9] S. L. Spencer et al., “The proliferation-quiescence decision is controlled by a bifurcation in cdk2 acti vity at mitotic e xit, ” Cell , vol. 155, no. 2, pp. 369–383, 2013. [10] R. Barg aje, K. Trachana, M. N. Shelton, et al., “Cell popula- tion structure prior to bifurcation predicts ef ficiency of directed differentiation in human induced pluripotent cells, ” Pr oceed- ings of the National Academy of Sciences , v ol. 114, no. 9, pp. 2271–2276, 2017. [11] M. Schef fer, J. Bascompte, W . A. Brock, et al., “Early-warning signals for critical transitions, ” Nature , vol. 461, no. 7260, pp. 53–59, 2009. [12] D. W ang, H. W ang, and X. Zou, “Identifying key nodes in multilayer networks based on tensor decomposition, ” Chaos: An Inter disciplinary Journal of Nonlinear Science , v ol. 27, no. 6, pp. 063108, 2017. [13] B. Jiang, C. Ding, and J. T ang, “Graph-laplacian pca: Closed- form solution and robustness, ” in Proc. IEEE Confer ence on Computer V ision and P attern Recognition , 2013, pp. 3492– 3498. [14] N. Shahid, V . Kalofolias, X. Bresson, M. Bronstein, and P . V an- derghe ynst, “Robust principal component analysis on graphs, ” in Pr oc. IEEE International Confer ence on Computer V ision , 2015, pp. 2812–2820. [15] S. L. Braunstein, S. Ghosh, and S. Sev erini, “The laplacian of a graph as a density matrix: a basic combinatorial approach to separability of mixed states, ” Annals of Combinatorics , v ol. 10, no. 3, pp. 291–317, 2006. [16] K. Anand, G. Bianconi, and S. Sev erini, “Shannon and von neumann entropy of random networks with heterogeneous ex- pected degree, ” Physical Review E , vol. 83, no. 3, pp. 036109, 2011. [17] L. Han, F . Escolano, E. R. Hancock, and R. C. W ilson, “Graph characterizations from von neumann entropy , ” P attern Recog- nition Letters , v ol. 33, no. 15, pp. 1958–1967, 2012. [18] F . Passerini and S. Severini, “The von neumann entrop y of networks, ” arXiv , https://arxiv .org/abs/0812.2597, 2008. [19] W . Du, X. Li, Y . Li, and S. Severini, “ A note on the von neu- mann entropy of random graphs, ” Linear Algebra and its Ap- plications , vol. 433, no. 11-12, pp. 1722–1725, 2010. [20] A. T orsello and E. R. Hancock, “Learning shape-classes us- ing a mixture of tree-unions, ” IEEE T ransactions on P attern Analysis and Mac hine Intellig ence , v ol. 28, no. 6, pp. 954–967, 2006. [21] D. P . Feldman and J. P . Crutchfield, “Measures of statistical complexity: Why?, ” Physics Letters A , vol. 238, no. 4-5, pp. 244–252, 1998. [22] Fan RK Chung, Spectral graph theory , vol. 92, American Mathematical Soc., 1997. [23] G. Sabidussi, “The centrality index of a graph, ” Psychome- trika , vol. 31, no. 4, pp. 581–603, 1966. [24] L. C. Freeman, “ A set of measures of centrality based on be- tweenness, ” Sociometry , pp. 35–41, 1977. [25] D. J. W atts and S. H. Strogatz, “Collecti ve dynamics of small- worldnetworks, ” nature , vol. 393, no. 6684, pp. 440–442, 1998. [26] P .-Y . Chen, S. Choudhury , and A. O. Hero, “Multi-centrality graph spectral decompositions and their application to cyber intrusion detection, ” Pr oc. IEEE International Conference on Acoustics, Speech and Signal Pr ocessing (ICASSP) , pp. 4553– 4557, 2016. [27] L. V an Der Maaten, E. Postma, and J. V an den Herik, “Dimen- sionality reduction: a comparativ e, ” J Mach Learn Res , vol. 10, pp. 66–71, 2009. [28] S. V an Aelst and P . Rousseeuw , “Minimum volume ellipsoid, ” W iley Inter disciplinary Re views: Computational Statistics , vol. 1, no. 1, pp. 71–82, 2009. [29] P . Sun and R. M. Freund, “Computation of minimum-volume cov ering ellipsoids, ” Operations Resear ch , vol. 52, no. 5, pp. 690–706, 2004. [30] M. Grant, S. Bo yd, and Y . Y e, “Cvx: Matlab software for disciplined con vex programming, ” 2008. [31] A. Nemiro vski, “Interior point polynomial time methods in con vex programming, ” http://www2.isye.gatech. edu/ ˜ nemirovs/Lect_IPM.pdf . [32] A. Shiravi, H. Shira vi, M. T av allaee, and A. A. Ghorbani, “T o- ward de veloping a systematic approach to generate benchmark datasets for intrusion detection, ” computers & security , v ol. 31, no. 3, pp. 357–374, 2012. [33] B. F . J. Manly and J. A. N. Alberto, Multivariate statistical methods: a primer , CRC Press, 2016.
Original Paper
Loading high-quality paper...
Comments & Academic Discussion
Loading comments...
Leave a Comment