Wavelet decomposition of software entropy reveals symptoms of malicious code
Sophisticated malware authors can sneak hidden malicious code into portable executable files, and this code can be hard to detect, especially if encrypted or compressed. However, when an executable file switches between code regimes (e.g. native, enc…
Authors: Michael Wojnowicz, Glenn Chisholm, Matt Wolff
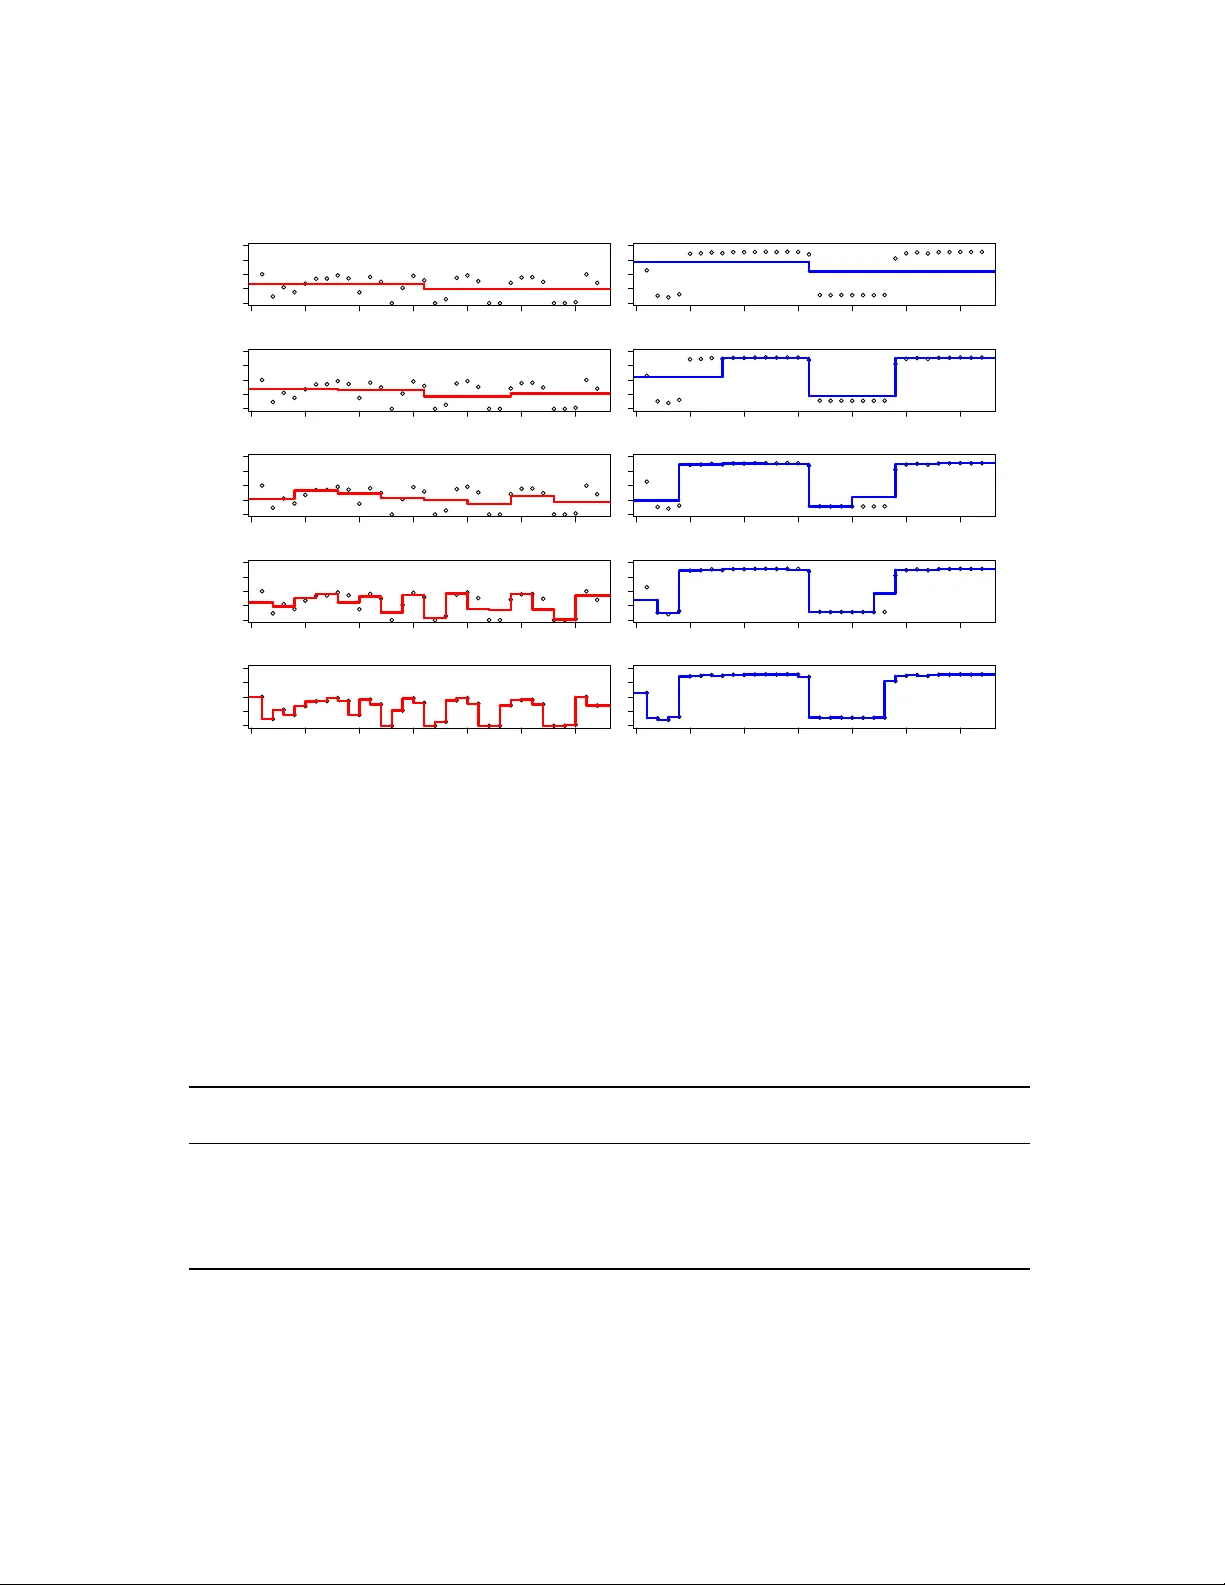
W a velet decomposition of software entr op y re veals symptoms of malicious code Michael W ojno wicz, Glenn Chisholm, Matt W olff , Xuan Zhao Dept. of Research and Intelligence Cylance, Inc. 18201 V on Kar man Dr iv e Ir vine , CA 92612 {mwojno wicz, gchisholm, mwolff , xzhao} @cylance.com ABSTRA CT Sophisticated malware authors can sneak hidden malicious con tents into p ortable executable files, and these conten ts can be hard to detect, esp ecially if encrypted or compressed. Ho wev er, when an executable file switc hes betw een con- ten t regimes (e.g., native, encrypted, compressed, text, and padding), there are corresp onding shifts in the file’s repre- sen tation as an entrop y signal. In this pap er, we develop a metho d for automatically quantifying the extent to which patterned v ariations in a file’s entrop y signal make it “suspi- cious." In Exp erimen t 1, we use w a v elet transforms to define a Suspiciously Structured Entropic Change Score (SSECS), a scalar feature that quantifies the suspiciousness of a file based on its distribution of en tropic energy across multiple lev els of spatial resolution. Based on this single feature, it w as p ossible to raise predictive accuracy on a malware de- tection task from 50.0% to 68.7%, ev en though the single feature w as applied to a heterogeneous corpus of malware disco vered “in the wild." In Exp erimen t 2, we describ e how w av elet-based decomp ositions of soft ware en trop y can b e ap- plied to a parasitic malware detection task inv olving large n umbers of samples and features. By extracting only string and en trop y features (with w a v elet decompositions) from soft ware samples, we are able to obtain almost 99% detection of parasitic malware with fewer than 1% false p ositiv es on go od files. Moreov er, the addition of wa v elet-based features uniformly improv ed detection performance across plausible false p ositiv e rates, both in a strings-only mo del (e.g., from 80.90% to 82.97%) and a strings-plus-en trop y mo del (e.g. from 92.10% to 94.74%, and from 98.63% to 98.90%). Ov er- all, wa v elet decomp osition of softw are entrop y can b e useful for machine learning mo dels for detecting malware based on extracting millions of features from executable files. 1 KEYW ORDS: wa v elet decomposition, structural entrop y , malw are detection, parasitic malware, machine learning 1. INTR ODUCTION 1.1 The Entropy Of Malicious Softwar e A fundamental goal in the information security industry is malw are detection. In this pap er, we fo cus our malw are detection efforts on the fact that malicious files (e.g. para- sitics, or exploits with injected shellco de) commonly contain encrypted or compressed (“pack ed”) segments whic h conceal 1 This article is a post-print of [18] whic h corrects t ypos in- tro duced during editing. malicious con ten ts [3]. Thus, the information securit y indus- try has been interested in developing metho dologies whic h can automatically detect the presence of encrypted or com- pressed segments hidden within p ortable executable files. T o this end, entrop y analysis has b een used, b ecause files with high entrop y are relativ ely likely to hav e encrypted or com- pressed sections inside them [5]. In general, the entrop y of a random v ariable reflects the amount of uncertain t y (or lac k of knowledge) ab out that v ariable. In the context of softw are analysis, zero en trop y would mean that the same c haracter w as rep eated ov er and ov er (as might o ccur in a “padded” c hunk of co de), and maximum en trop y would mean that a c hunk consisted of entirely distinct v alues. Th us, c h unks of code that ha ve been compressed or encrypted tend to ha ve higher en trop y than native code. F or instance, in the soft ware corpus studied by [5], plain text had an av erage en tropy of 4.34, native executables had an a vera ge entrop y of 5.09, pack ed executables had an a v erage entrop y of 6.80, and encrypted executables had an av erage entrop y of 7.17. 1.2 Suspiciously Structured Entr opy Based on the reasoning ab o v e, previous research has used high mean entrop y as an indicator of encryption or com- pression. Ho w ev er, malicious conten ts, when concealed in a sophisticated manner, may not b e detectable through simple entrop y statistics, suc h as mean file entrop y . Mal- w are writers sometimes try to conceal hidden encrypted or compressed co de that they introduce in creating files suc h as parasitic malware; for instance, they may add ad- ditional padding (zero entrop y ch unks), so that the file passes through high entrop y filters. How ev er, files with con- cealed encrypted or compressed segments tend to v acillate mark edly b et w een native co de, encrypted and compressed segmen ts, and padding, with each segment having distinct and characteristic exp ected entrop y lev els. Thus, the field of cyb ersecurit y has started to pa y atten tion to files with highly structur ed entr opy [11], [2], that is, files whose co de flips b e- t ween v arious distinguishing levels of entrop y through the file. In order to automatically iden tify the degree of en tropic structure within a piece of softw are, w e represent each p ortable executable file as an “entrop y stream. ” The entrop y stream describ es the amount of en trop y ov er a small snippet of co de in a certain location of the file. The “amount” of en tropic structure can then be quan tified, suc h that w e can differen tiate, for example, b et w een a low-structured signal with a single lo cal mean and v ariation around that mean, v ersus a highly-structured signal whose local mean c hanges man y times o v er the course of the file. In this pap er 2 , we define suspiciously structur e d entr opy as a p articular p attern of entr opic structur e which matches those of malicious files. T o quantify the suspiciousness of the structured entrop y within a piece of softw are, we develop the notion of a “Suspiciously Structured Entropic Change Score” (SSECS). W e first describ e how to calculate SSECS as a single predictive feature, and analyze its p erformance in malware detection. W e then generalize this feature to large-scale malware detection tasks. The deriv ation of the SSECS feature dep ends up on the notion of a w a v elet trans- form, which we now briefly review. 1.3 Brief Overview Of W av elets The W a v elet T ransform is the primary mathematical op er- ator underlying our quantification of structurally suspicious en tropy . The W av elet T ransform extracts the amount of “detail” exhibited within a signal at v arious lo cations ov er v arious levels of resolution [8]. In essence, it transforms a one-dimensional function of “lo cation” (in our case, file lo- cation) into a t w o-dimensional function of “lo cation” and “scale. ” By using the output of the wa velet transform (the so-called “w a v elet coefficients”), it is p ossible to obtain a se- ries of coarse-to-fine approximations of an original function. These successive approximations allow us to determine the m ulti-scale structure of the entrop y signal, in particular the “energy” av ailable at different levels of resolution. F or this pap er, we apply Haar W a v elets, which is a particu- larly simple family of wa v elets whose members are piecewise constan t. The Haar W av elet T ransform pro jects the origi- nal entrop y signal on to a collection of piecewise constan t functions which oscillates as a square wa v e ov er bounded supp ort (i.e., the functions assume non-zero v alues only on certain b ounded interv als). Since these piecewise constant functions hav e supp orts which v ary in their scale (width) and lo cation, the resulting pro jections describ e the “detail” within the signal at v arious locations and resolutions. More sp ecifically , the Haar W av elet T ransform is based up on the so called “mother function”, ψ ( t ) , defined b y: ψ ( t ) = 1 , t ∈ [0 , 1 / 2) − 1 , t ∈ [1 / 2 , 1) 0 , otherwise a v ery simple step function. Given the Haar mother function ψ ( t ) , a collection of dy adically scaled and translated wa v elet functions ψ j,k ( t ) are formed by: ψ j,k ( t ) = 2 j / 2 ψ (2 j t − k ) (1) where the in tegers j, k are scaling parameters. The dilation parameter j indexes the level of detail or resolution, and the translation parameter k selects a certain lo cation within the signal to b e analyzed. Note that as the scaling parameter j increases, the function ψ j,k applies to (is non-zero ov er) 2 This pap er is a developmen t of earlier researc h originally published in conference pro ceedings [15]. F or a more com- prehensiv e viewp oin t, see [16]. −0.5 0.0 0.5 1.0 1.5 −1.0 0.0 1.0 Wa velet Functions (Resolution J=0) x y1 −0.5 0.0 0.5 1.0 1.5 −1.5 −0.5 0.5 1.5 Wa velet Functions (Resolution J=1) x y2 −0.5 0.0 0.5 1.0 1.5 −2 −1 0 1 2 Wa velet Functions (Resolution J=2) x y4 Figure 1: Examples of Haar wavelet functions. Here w e sho w some Haar wa v elet functions ov er the unit interv al. Eac h colored square wa v e represen ts (the non-zero part of ) a different wa v elet function. The Haar w a v elet functions are defined in Equation 1. In particular, w e plot wa v elet functions for resolution levels j = 0 , 1 , 2 and lo cations k = 0 , .., j . These wa velet functions are used as filters to pick up the magnitude of entropic change in a piece of softw are at differen t levels of resolution and in different file locations. successiv ely finer interv als of the signal. Some example Haar w av elet functions are sho wn in Figure 1. Giv en a signal x ( t ) where t = 1 , . . . , T , we first rescale the signal so that the first observ ation o ccurs at time t = 0 and the final observ ation o ccurs at time t = 1 . Then, the so- called “mother wa v elet co efficien t” at scale j and lo cation k is given by the inner pro duct of the signal with the w av elet. Since we are dealing with discrete signals, the inner pro duct tak es the form: d j,k = < x, ψ j,k > = T X t =1 x ( t ) ψ j,k ( t ) , One interpretation of this co efficien t is that it gives the (scaled) difference b et w een lo cal av erages of the s ignal across neighboring ch unks or bins. The size of the neigh- b oring ch unks is determined by the scaling parameter j . The family of mother wa v elet co efficien ts, { d j,k } , enable a “Multi-Resolution Analysis” (MRA) of the signal x ( t ) . In particular, the signal x ( t ) can b e decomp osed in to a series of approximations x j ( t ) , whereby eac h successiv e approxi- mation x j +1 ( t ) is a more detailed refinement of the previous appro ximation, x j ( t ) . The functional approximations are 0 100 200 300 400 500 0 2 4 6 8 Projected signal, resolution level 3 Entropy 0 100 200 300 400 500 0 2 4 6 8 Projected signal, resolution level 5 Entropy 0 100 200 300 400 500 0 2 4 6 8 Projected signal, resolution level 8 File Location (Index of Chunk of Raw Bytes) Entropy Figure 2: W avelet-base d functional appr oximations to a soft- war e’s entr opy signal at differ ent levels of r esolution. Here, w e sho w the entrop y signal from a single Portable Exe- cutable (PE) file pro jected on to Haar father wa v elet space at differen t levels of resolution ( j ∈ { 2 , 5 , 8 } from Equation 2). In general, each successive functional appro ximation adds the incremental detail pro vided at that level of spatial res- olution, compared to the next-most-coarse level of spatial resolution, and does so across v arious spatial lo cations. obtained through the wa v elet co efficien ts by the f orm ula: x j +1 ( t ) = x j ( t ) + 2 j − 1 X k =0 d j,k ψ j,k ( t ) (2) where x 0 ( t ) , the coarsest-level functional appro ximation, is the mean of the full signal. Thus, the collection of mother w av elet coefficients { d j,k } store the “details” that allow one to mov e from a coarser approximation to a finer approxima- tion. Examples of successive functional approximations, in the context of softw are entrop y signals, are shown in Figure 2. Using the wa v elet transform, it is p ossible to “summarize” the ov erall amount of detail in a signal at v arious levels of resolution. The total amount of detail at a particular ( j th) lev el of resolution is kno wn as the ener gy at that lev el of resolution: E j = 2 j − 1 X k =1 ( d j k ) 2 (3) The distribution of energy across v arious levels of resolution is kno wn as an ener gy sp e ctrum . Note that the energy at resolution lev el j is just the squared Euclidean norm of the v ector of mother w av elet co efficients from resolution level j . After this step, w e hav e reduced the original signal of size T = 2 J (and resultant w a v elet v ector of size T − 1 ) to a vector of J elemen ts, where each element represents the amoun t of “energy” at a single lev el of resolution. 1.4 W a velet-Based Classifiers The energy sp ectra of signals hav e b een very useful features for classifiers such as neural netw orks. In fact, this combined strategy , whereby the coefficients from a discrete wa velet transform are used as no de activ ations in a neural netw ork, is referred to as a wa v elet neural net w ork ( WNN ) strategy (see e.g. [10], [ ? ]). Using WNN’s, researchers ha v e b een able to automatically classify lung sounds into categories (crack- les, wheezes, striders, squawks, etc.) [6], to automatically determine whether brain EEG scans originated from health y patien ts, patients with epilepsy , or patients who were in the middle of having a seizure [9], or to automatically determine whether EMG signals collected from the bicep originated from patients who were healthy , suffering from my opath y , or suffering from neurogenic disease [4]. W e refer to the ov erall strategy of using wa v elet co efficien ts as features in a classifier as a W avelet-Base d Classifier strat- egy . W e prefer this term ov er WNN , whic h, although w ell- established in the literature, is sp ecific to neural netw ork classifiers. Indeed, in this pap er, we choose logistic regres- sion (b oth standard and regularized) rather than a neu- ral netw ork to mo del our data, b ecause the logistic regres- sion mo del pro vides an atomic analysis of the relationship b et ween the wa velet-based features and classification cate- gories. 1.5 Suspiciously Structured Entropic Change Score (SSECS) The initial fundamental problem with applying wa velet- based classifiers to malw are analysis is that executable files out “in the wild” ha v e different lengths. This contrasts with controlled observ ational situations, e.g. those described ab o ve, which produce signal samples of fixed length that are held constant across the data set. In con trolled observ a- tional situations, all samples will produce the same num ber of features, J, and v ariation across these set of J features can b e immediately asso ciated with a classification v ariable in a straigh tforward manner, for example by setting the input la yer of the neural net w ork to ha v e J activ ation notes. Ho wev er, in uncontrolled observ ational con texts, signal lengths can differ wildly from sample to sample. Imag- ine, for instance, comparing signal A of length 32 (so J=5, and if E f ,j represen ts the energy at resolution level j = 1 , . . . , J for p ortable executable file f , we would hav e E a, 1 , . . . , E a, 5 ) with signal B of length 256 (so J=8, and w e ha v e E b, 1 , . . . , E b, 8 ). How should we compare these tw o files? Our solution to this problem, for smaller data sets 3 , is to transform each file’s J -dimensional energy sp ectrum into a 3 A second solution, for larger datasets, is describ ed in Ex- p erimen t 2. single scalar feature, a 1 -dimensional “Suspiciously Struc- tured Entropic Change Score” (SSECS). The computation of SSECS is a tw o-step pro cess: first, we compute the wa v elet- based energy sp ectrum of a file’s entrop y signal, and second, w e compute the file’s malware prop ensit y score from that en- ergy sp ectrum. In our case, we fit a logistic regression mo del to the binary classification resp onse (malware or not) which uses these wa v elet energy features as predictor v ariables. W e fit J separate regression mo dels, one for eac h file size group- ing. Giv en the Energy Sp ectrum { E f ,j } , whic h is the set of wa v elet energies for each resolution level j = 1 , . . . , J of p ortable executable file f , the logistic regression mo del es- timates b P f , the predicted probability that file f is malware, b y the form ula b P f = 1 1 + exp [ − β 0 + E f ,j · β ( J ) ] where β ( J ) j is a mo del parameter, known as a “logistic re- gression co efficien t”, from the J th logistic regression mo del. This num ber, b P f is what w e refer to as the SSECS. 2. EXPERIMENT 1: ANAL YZING AND EV ALU A TING THE PREDICTIVE PER- FORMANCE OF A SINGLE W A VELET - B ASED FEA TURE In Exp erimen t 1, we attempt to assess the predictiv e v alue of SSECS as a single feature describing potentially suspicious v ariation in soft ware en tropy . In particular, as discussed in Section 2.2, the wa v elet-based feature is constructed in an attempt to describe the “suspiciousness" of a piece of soft ware’s en trop y signal when that entrop y signal is re- represen ted, through a wa v elet transform, in terms of en- tropic c hange distributed across different levels of spatial resolution. 2.1 Data Data are a set of n=39,968 p ortable executable files from a Cylance rep ository . 19,988 (50.01%) of these files w ere kno wn to be malicious, and the remaining files were b e- nign. These files were collected “from the wild," and thus highly heterogenous. F or example, the “malware" category con tains different types of malicious softw are (e.g. viruses, T rojan horses, spyw are, backdoors, bots, and ransomw are – but not adw are.) 2.2 Method 2.2.1 Constructing the entr opy str eam T o compute the entrop y of an executable file, the original file, represen ted in hexadecimal (00h-FFh), is split into non- o verlapping ch unks of fixed length, t ypically 256 b ytes. F or eac h ch unk of co de, the entrop y is then computed using the form ula b elo w: H ( c ) = − m X i =1 p i ( c ) log 2 p i ( c ) , (4) where c represents a particular ch unk of co de, m represents the num ber of p ossible c haracters (here, n=256), and p i is the probability (observed frequency) of each character in the giv en ch unk of code. The en trop y for any given ch unk then ranges from a minimum of 0 to a maxim um of 8. 2.2.2 Computing the Suspiciously Structur ed En- tr opic Change Scor e (SSECS) The procedure for computing the suspiciously structured en- tropic change score (SSECS) is as follows: 1) Partition data set by size: Group sampled files into j = { 1 , . . . , J } groups, where j = b log 2 T c and T is the length of the file’s en trop y stream: 2) Iterate: F or all files which fall in to the j th length group 2a) Compute Haar Discrete W av elet Co efficien ts: The dis- crete wa v elet transform tak es as input a discrete series of size T = 2 J observ ations. Because the transform re- quires the series to hav e a dyadic length, if the num ber of observ ations in the executable file’s entrop y stream is not an integer p o w er of 2, we right-truncate the series at v alue 2 b log 2 T c . The so called “mother” wa v elet co ef- ficien ts, d j k , describ e the “detail” at successively fine- grained resolutions. In particular, the mother wa v elet co efficien ts are indexed suc h that j ∈ { 1 , . . . , J } repre- sen ts the resolution level, ordered from coarse-grained to fine-grained, and k ∈ { 1 , . . . , K = 2 j − 1 } represents the particular location (or bin) of the en tropy signal at that resolution lev el. A t eac h resolution lev el j , the signal is divided into N j = 2 j − 1 non-o verlapping, ad- jacen t bins suc h that each bin includes B j = 2 J − j ob- serv ations. Note that the num ber of bins, K, increases as j increases to finer resolutions. The mother wa v elet co efficien t at index ( k, j ) is then given by: d kj = 1 s j 2 kB j X i =(2 k − 1) B j +1 y i − (2 k − 1) B j X i =(2 k − 2) B j +1 y i (5) where the scaling factor is s j = ( √ 2) J − j +1 and is nec- essary for the w av elet transform to preserv e the size (norm) of the signal. There are T-1 mother w av elet co efficien ts. 2b) Compute W av elet Energy Spectrum : The wavelet en- er gy sp ectrum summarizes the “detail” or “v ariation” a v ailable at v arious resolution lev els. The energy sp ec- trum is computed as a function of the mother w a v elet co efficien ts, d j k . In particular, the “energy”, E j , of the en tropy stream at the j th resolution level is defined b y Equation 3. Given a particular executable file’s en- trop y stream, we refer to its distribution of energy ov er differen t resolutions the file’s “energy sp ectrum. ” 2c) Compute W av elet Energy Suspiciousness: Now we use the wa v elet energy sp ectrum to determine the “prop en- sit y” of eac h file to b e malw are (i.e., its suspiciousness). Computing this prop ensit y requires training. W e use 5-fold v alidation. 2c1) Partition The Curren t Sample Of Files: Split the en tire set of F J files whic h are of the appropriate size into 5 mutually exclusive subsets F 1 J , . . . , F 5 J , eac h of which represents exactly 20% of the entire sample. 2c2) Iterate: F or eac h subset F i J , where i ∈ { 1 , . . . , 5 } 2c2a) Fit a logistic regression : Fit a logistic regres- sion mo del on the other four subsets { F k J : k 6 = i } , where the mo del fits the class v ariable (mal- w are or not) as a function of the wa v elet energy sp ectrum. The logistic regression model will pro duce a set of b eta coefficients to w eigh the strength of eac h resolution energy on the file’s probabilit y of being malw are. 2c2b) Calculate malware prop ensit y: Use the logistic regression mo del ab o v e to then mak e a predic- tion ab out files in subset F i J . In particular, use the mo del learned in step 1c2a to calculate the predicted probability that eac h file in set F i J is malware, given its w a v elet energy spectrum. This malware propensity (i.e., predicted mal- w are probability) lies within the in terv al [0 , 1] , and is what we call the Suspiciously Structured En tropic Change Score (SSECS). 2.3 Results 2.3.1 Suspicious P atterns of Entr opic Change in A Single F ile Size Gr oup Ho w do es the mo del transform these wa velet energy sp ec- tra into predictions ab out whether the file is malware (that is, into a Suspiciously Structured Entropic Change Score)? T o illustrate, we consider the subset of n=1,599 files in our corpus b elonging to file size group J = 5 . Because these files can b e analyzed at J = 5 different spatial resolutions, w e extract 5 features from each file, with eac h feature rep- resen ting the energy at one lev el of spatial resolution in the file’s entrop y stream. F or illustrative purposes, we b egin by analyzing the wa v elet energy sp ectrum for tw o files from this size category , as they em bo dy more general trends in the energy patterns of malicious versus clean files. Figure 3 shows wa v elet-based functional approximations for tw o differen t entrop y streams. The left column of the plot depicts the entrop y signal from File A, which is legitimate softw are, whereas the right col- umn of the plot depicts the entrop y signal from File B, whic h is malware. Reading these columns from top to b ottom, w e see that the wa v elet transform pro duces successively de- tailed functional approximations to these files’ entrop y sig- nals. The title ab o v e each subplot shows the w a v elet energy , as computed in Equation (3) in the text, of the signal at a particular spatial resolution lev el. The wa v elet energy is simply the sum of the squares of the scaled differences in the mean en trop y lev els, where the differences are only taken b e- t ween even/odd index pairings (i.e. the algorithm takes the differences mean bin 2 − mean bin 1 , mean bin 4 − mean bin 3 , and so forth). Th us, we can gain some visual in tuition ab out ho w the energy spectra can b e deriv ed from these successive functional approximations. Based on this entropic energy sp ectrum decomp osition (or distribution of energy across v arious levels of spatial resolu- tion), the mo del b eliev es that File A is legitimate softw are, whereas File B is malware. In v estigating this conclusion, w e see that these tw o files hav e radically different wa v elet energy distributions across the 5 lev els of spatial resolution. The legitimate softw are (File A) has its “entropic energy” mostly concentrated at finer levels of resolution, whereas the piece of malware (File B) has its “entropic energy” mostly concen trated at coarser levels of resolution. F or the clean file, the energy in the entrop y stream is concentrated at the resolution levels j = 4 and j = 5 (where the energy is 34.5 and 23.84 squared bits, respectively). F or the dirt y file, the energy in the entrop y signal is concen trated at coarser levels of analysis, p eaking esp ecially strongly at level j = 2 (where the energy is 139.99 squared bits). The fit of the logistic regression mo del (for b oth raw and normalized features) is summarized in T able 1. Note that for the en tire table, num bers outside the parentheses repre- sen t results for the normalized features, whereas n um bers in- side the paren theses represent results for raw features. The t wo “Energy” columns list the energy at all five levels of spatial resolution for these t w o files. The “V alue of β j ” column describ es the estimated b eta weigh t in a logistic re- gression fitting file maliciousness to the five wa v elet energy v alues, based on a corpus of n=1,599 files. The “P-v alue” column describ es the probability of getting the test statis- tic we observ ed (not sho wn, it is a function of the data) under the hypothesis that there is no relationship b et w een energy at that level and file maliciousness. The co des are: ∗ = p < . 05 , ∗∗ = p < . 01 , ∗ ∗ ∗ = p < . 001 , ∗ ∗ ∗∗ = p < . 0001 , ∗ ∗ ∗ ∗ ∗∗ = p < . 00001 . The “Malware Sensitivity” represen ts the estimated change in the o dds that a file is malw are associated with an increase of one unit in the cor- resp onding feature. It is calculated by ( e β − 1) × 100% . F or the normalized v alues (those outside the parenthesis), an increase of one unit refers to an increase of one standard deviation. Based on these logistic regression b eta weigh t ( β j ) v alues, w e see that the tw o sample files from Figure 3 are indeed represen tative of a larger trend: having high energy at spa- tial resolution levels 1,2 and 3 (the coarser levels) is asso- ciated with a higher probability of the file b eing malw are (since those β j ’s are p ositiv e), whereas having high energy at levels 4 and 5 (the finer lev els) is asso ciated with a low er probabilit y of the file b eing malicious (since those β j ’s are negativ e). Moreo v er, these asso ciations app ears to b e re- flectiv e of trends in the larger p opulation of files, since the p-v alues are largely strongly statistically significant. This finding makes sense if artificial encryption and compression tactics tend to elev ate moderate to large sized c h unks of malicious files in to high en trop y states. 2.3.2 Suspicious P atterns of Entr opic Change Acr oss All F ile Size Gr oups Do the trends found in the single level analysis of n = 1 , 599 files hold up in the full corpus of n = 39 , 968 files? In par- ticular, regardless of file size, can we corrob orate the sim- ply stated conclusion that “malw are tends to concen trate en tropic energy at relatively coarse lev els of spatial resolu- tion?” And if so, where is the dividing line b et w een “coarse” and “fine”? In Figure 4, we summarize the results of logistic regres- sion mo dels fits across all file size groupings. The plot sho ws logistic regression beta co efficien ts for determining the probability that a p ortable executable file is malw are based up on the magnitude of file’s entropic energy at v ar- ious levels of spatial resolution within the co de. Positiv e b etas (red colors) mean that higher “en tropic energy” at that resolution level is asso ciated with a greater probability 0 5 10 15 20 25 30 0 4 8 W avelet Energy at Le vel 1 = 4.35 squared bits 0 5 10 15 20 25 30 0 4 8 W avelet Energy at Le vel 1 = 14.44 squared bits 0 5 10 15 20 25 30 0 4 8 W avelet Energy at Le vel 2 = 0.8 squared bits 0 5 10 15 20 25 30 0 4 8 W avelet Energy at Le vel 2 = 139.99 squared bits 0 5 10 15 20 25 30 0 4 8 W avelet Energy at Le vel 3 = 5.29 squared bits 0 5 10 15 20 25 30 0 4 8 W avelet Energy at Le vel 3 = 53.84 squared bits 0 5 10 15 20 25 30 0 4 8 W avelet Energy at Le vel 4 = 34.5 squared bits 0 5 10 15 20 25 30 0 4 8 W avelet Energy at Le vel 4 = 9.75 squared bits 0 5 10 15 20 25 30 0 4 8 W avelet Energy at Le vel 5 = 23.84 squared bits 0 5 10 15 20 25 30 0 4 8 W avelet Energy at Le vel 5 = 19.22 squared bits File Location (Each Chunk is 256 Bytes) Entropy Figure 3: W a v elet-based functional approximations, and the corresp onding wa v elet energy sp ectrum, for the en trop y signals of tw o representativ e p ortable executable files from one file size group. Resolution E ner gy S pectr a S tatistical M odel F or F ile S iz e J = 5 Lev el # B ins B in S iz e F il e A F il e B V alue of β j P − v alue M alw are S ensitiv ity 1 2 16 -0.39 (4.35) -0.01 (14.44) 0.448 (0.017) ***** +56.5% (+1.7%) 2 4 8 -0.79 (0.80) 6.27 (139.99) 0.174 (0.008) * +19.0% (+0.89%) 3 8 4 -0.48 (5.29) 2.18 (53.83) 0.847 (0.046) ***** +133.2% (+4.74%) 4 16 2 1.42 (34.50) -0.37 (9.75) -0.106 (-0.008) n.s. -10.0% (-0.75%) 5 32 1 1.77 (23.84) 1.19 (19.22) -0.240 (-0.030) ** -21.4% (-2.99%) T able 1: Inv estigating the relationship b et w een the en tropic w a ve let energy sp ectrum and maliciousness for files in one size group. of b eing malw are. Negativ e b etas (blue colors) mean that higher “entropic energy” at that resolution level is asso ciated with a lo w er probability of being malw are. F or b oth colors, stronger intensities represen t stronger magnitudes of the re- lationship b et w een entropic energy and malware. Mathe- matically , the dot product b et ween a file’s energy sp ectrum and these b eta weigh ts determine the fitted probability that the file is malicious. Th us, the Danger Map interpretation can be in terpreted as follo ws: F or any file size grouping (or ro w), files that ha v e high energies in the red sp ots and low energies in the blue sp ots are significantly more lik ely to be “dangerous. ” Conv ersely , files that ha v e lo w energies in the red sp ots and high energies in the red sp ots are significantly more likely to be “safe. ” T aking this Danger Map in to consideration, we draw the follo wing conclusions: • T o a first appro ximation, the full analysis supports the “coarse-energy-is-bad, fine-energy-is-goo d” mantra (observ ed in Section 2.3.1’s analysis of a single file-size group). Visually , most diagonal elements of the matrix are blue (and also more blue than the off-diagonals). Th us, across most file sizes, high energies at the finest- lev el of spatial resolution app ear to be indicative of file legitimacy , and high energies at coarse levels of spatial resolution are often asso ciated with suspiciousness. • How ev er, what qualifies as a suspicious pattern in the w av elet decomp osition of a file’s entrop y stream ap- p ears to b e more complex than the simplistic sum- mary ab o v e. F or example, the app earance of the dou- ble diagonal bands in blue suggest somewhat regular v acillations in terms of how “suspicious” high entropic energy would lo ok at v arious levels of spatial resolu- tion. W e find that the particular patterning depicted in the Danger Map provides a statistically significan tly b etter description of malware than random (baseline- informed) guessing alone. Likelihoo d ratio tests com- paring the fit of the size-sp ecific models (where the b eta co efficien ts of each size-sp ecific mo del are given b y the sp ecific colorings in the corresp onding row of the Danger Map) versus the fit of mo dels with no fea- tures (interpretable as a uniform color across rows, where the intensit y of the color is determined by base- line malware rates, indep endent of the wa velet energy sp ectrum) yield the test statistics b elo w. Moving from b ottom (J=3) to top (J=15) of the figure, w e hav e: χ 2 (3) = 198 . 36 , χ 2 (4) = 563 . 51 , χ 2 (5) = 257 . 52 , χ 2 (6) = 235 . 09 , χ 2 (7) = 150 . 11 , χ 2 (8) = 585 . 57 , χ 2 (9) = 662 . 22 , χ 2 (10) = 283 . 24 , χ 2 (11) = 385 . 33 , χ 2 (12) = 305 . 04 , χ 2 (13) = 233 . 39 , χ 2 (14) = 116 . 17 , χ 2 (15) = 61 . 88 , All of these test statistics achiev e statistical signifi- cance at the α = . 05 level. Moreov er, ev en after a conserv ative Bonferroni’s correction for simultaneous h yp othesis testing (of 10 null hypotheses), we can still reject the null h yp othesis of a uniform color across A 'Danger Map' For Software Entropy Resolution Level File Size Grouping (J) 1 2 3 4 5 6 7 8 9 10 11 12 13 14 15 16 3 4 5 6 7 8 9 10 11 12 13 14 15 −1.0 −0.5 0.0 0.5 1.0 1.5 2.0 Beta V alue Figure 4: A “Danger Map" for entropy patterns within a pie c e of softwar e. The danger map is deriv ed from a statis- tical mo del of malware classification which learns suspicious patterns inherent within each softw are’s en tropy streams. In particular, a wa velet decomp osition of these entrop y streams rev eals the entropic energy at v arious levels of resolution. The plot shows logistic regression b eta co efficien ts for de- termining the probability that a p ortable executable file is malw are based up on the magnitude of file’s entropic energy at v arious levels of resolution within the code. ro ws for each spatial resolution except spatial resolu- tion level 9. This finding suggests that the distribution of colors in the “Danger Map" of Figure 4, while not sufficien tly simplistic to be easily verbalizable, is un- lik ely to be obtainable by random c hance. 4 2.4 Predicti ve perf ormance of the single wa velet featur e Ho w can w e use the information distributed across the “Dan- ger Map” to construct a single n um ber whic h could score a piece of soft w are’s suspiciousness based on the wa v elet de- comp osition of its en trop y signal? W e studied the predictive p erformance of SSECS in identifying malware b y construct- ing a hold-out test set of n = 7 , 991 files and found: 1. SSECS as a single fe atur e impr ove d pr e dictions of mal- war e , within a balanced sample of malw are and legit- imate soft w are, from 50% to 68.7% accuracy . This mak es SSECS a particularly impressive feature, con- sidering that most machine learning mo dels of malware consist of millions of features. 4 W e reject the n ull h ypothesis that the colors in each ro w are uniform, and this rejection is consistent with the hypoth- esis that the complex patterns of colors are meaningful in predicting malware. How ev er, we point out for the sake of completion that this finding is also consistent with simpler but more sp ecific hypotheses, suc h as that the right-most off-diagonal cell is driving the result. Ideally , a more so- phisticated statistical mo del, well-tailored to the structure of a multi-resolution dataset, would be applied here to tease apart these remaining p ossibilities. 2. SSECS pr ovides pr e dictive information b eyond what is c ontaine d in a me an entropy fe atur e . A mo del with mean entrop y as a single feature ac hiev ed 66.2% predictiv e accuracy . Th us, mean entrop y is indeed also an impressiv e single predictor of malw are (p er- haps not surprisingly given its prev alence in the liter- ature). How ev er, unlik e mean entrop y , the wa v elet en- ergy sp ectrum detects suspicious patterns of en tropic change across the co de of the executable file. W e found that a 2-feature mo del which includes both mean en- trop y and SSECS achiev es 73.3% predictiv e accuracy (so adding wa v elet-based information to the mo del yields a 7.1% bo ost in predictive accuracy b ey ond what is obtained b y mean en trop y alone). 3. SSECS pr ovides pre dictive information b eyond what is c ontaine d in a “standar d deviation of entr opy" fe atur e . A sk eptic migh t ask: wh y not simply use standard deviation, a more commonly used and more computa- tionally straightforw ard measure of v ariation? Stan- dard deviation is useful, but a relatively cruder mea- sure of v ariation, as it operates on only a single spatial scale. Indeed, a 2-feature mo del which includes b oth mean entrop y and standard deviation ac hiev es merely 70.4% predictive accuracy . 3. EXPERIMENT 2: LARGER-SCALE DE- TECTION OF P ARASITIC MAL W ARE In Exp eriment 1, we ev aluated the predictive v alue of a sin- gle wa v elet-based feature that describ es ho w soft w are’s en- tropic shifts are distributed across multiple spatial scales. W e found that this feature can exploit v aluable information from a softw are’s entrop y signal which is relev an t to mal- w are status and whic h go es b ey ond the predictive v alue of the most commonly used en trop y measures, mean entrop y , as well as a p oten tially conceptually simpler measure of en- trop y v ariation, en trop y standard deviation. In Exp erimen t 2, w e apply a broader system of wa v elet-based features to a larger-scale malware prediction task. In particular, the task is to iden tify parasitic malware from a large corpus of otherwise go od files. P arasitic malware generally infects ex- isting files on a user’s system, and the infected part of the file t ypically conceals itself through encryption or compres- sion. Thus, if wa v elet decomp osition of soft w are entrop y indeed yields features whic h successfully trac k the presence of suspicious c h unks of encrypted or compressed code, then these features should b e particularly v aluable for a parasitic detection task. 3.1 Data Data were 699,121 samples of Portable Executable (PE) files from a Cylance repository . Of these samples, 17,605 files (2.51%) were parasitic malware, and the remaining files w ere legitimate softw are. W e randomly selected 80% of the dataset for training, and the remaining 20% were allo cated to the test set. 3.2 Method T o v alidate the utility of w av elet features in distinguishing parasitic malware from clean softw are, we compared four mo dels (in the sense of types of features extracted from ex- ecutable files to feed in to a mac hine learning classifier): 1. Strings Mo del : A strings-only mo del is a common wa y to build features for a machine learning classifier [13]. Th us, we extract the P 1 = 1 , 117 , 127 most common strings observed in our corpus and use them as binary features in a predictive mo del. 2. Strings+W avelet Mo del : W e would like to in v estigate if wa velet-based features can add predictive v alue to a strings only mo del. Because of the relatively large- scale size of the dataset ( ≈ 20 × the size of Exp er- imen t 1), we streamline the feature generation pro- cess. Rather than computing SSECS, the energy sp ec- trum suspiciousness score, which requires a nested mo deling step, we follo w the feature generation algo- rithm of Section 2.2 only up to Step 2.2.2, computing the wa v elet energy sp ectrum. W e then represen t the w av elet energy sp ectrum separately for each file size group. In particular, a sample with T p oin ts in its en tropy stream will ha v e J = b log 2 T c features in its w av elet energy sp ectrum. If J max is the maxim um observ ed v alue of J in the dataset, then there are P J max J =1 J = J max ( J max + 1) 2 features, where any given sample with T p oin ts in its entrop y stream will only ha ve non-zero v alues for J = b log 2 T c of these features (namely , for the part of the vector that corresp onds to its filesize group). Although obviously this pro ce- dure creates a huge proliferation of features relative to the single SSECS feature studied in Exp eriment 1, the pro cedure is more informative and becomes more feasible as more data is collected, while simultaneously streamlining the mo deling pip eline for larger datasets. Finally , w e bin the w a v elet energy spectrum features, whic h are originally contin uous, to create a sparse bi- nary dataset. In this wa y , we obtain 24,009 binary fea- tures deriv ed from the w a velet energy sp ectrum. Af- ter adding in the strings as w ell, the Strings+W a v elet mo del includes P 2 = 1 , 141 , 136 binary features. 3. Strings+Entr opy+W avelet Mo del : The wa v elet fea- tures capture some information ab out the entrop y sig- nal, but it is incomplete. F or example, the wa v elet energy sp ectrum describ es variation at multiple lev- els of resolution, but ignores first-or der information (i.e., measures of central tendency , such as the mean). Th us, in an attempt to construct a more p o w erful pre- dictiv e mo del from strings and the entrop y signal, here w e add simple summary statistics ab out the entrop y signal: mean, standard deviation, signal-to-noise ra- tio, maximum entro py , p ercen tage of the signal with “high” entrop y ( ≥ 6.5 bits), p ercen tage of the signal with zero entrop y , and length and squared length of the signal. As these supplementary entrop y features are relatively simple to compute, we obtain these mea- suremen ts separately for eac h PE section. As these features are also contin uous, they are then binned through an internal binning pro cess to create a sparse binary dataset. This pro cedure creates 108,835 ad- ditional features to add to the strings model (24,009 deriv ed from the wa v elet energy sp ectrum, and 84,826 other en trop y features). All together, this model con- tains P 3 = 1 , 225 , 962 binary features. 4. Strings+Entr opy Mo del : In order to provide a more rigorous test of the v alue of the wa v elet features, w e create a fourth mo del which includes strings and the summary en trop y features described ab o v e, but no wa velet features. Our reasoning is that, ev en if the wa v elet features improv e the strings- only mo del, this improv ement could, in theory , hav e b een merely driven b y the inclusion of some en- trop y information (or even file length). By construct- ing this model, we can compare the performance of the Strings+Entrop y+W av elet mo del with the p er- formance of the Strings+En tropy mo del to answer the question: do wa v elet features provide additional predictiv e information that go es ab o v e and b ey ond the information inherent in summary entrop y statis- tics (mean, max standard deviation, etc.)? Thus, this mo del includes the 84,826 summary en trop y fea- tures, but not the wa v elet features. All together, with the string features as well, this mo del contains P 4 = 1 , 201 , 953 features. Because we hav e a large n um b er of predictors (up to P max = 1 , 225 , 962 ) relativ e to samples ( N = 699 , 121 ), we apply a “logistic lasso" model (i.e. ` 1-p enalized logistic regres- sion) to p erform classification and feature selection simul- taneously . Similarly to unregularized logistic regression, w e can use the learned regression (or beta) weigh ts as a proxy for feature imp ortance. Since the features are all binary , eac h β j , j = 1 , . . . , P can be interpreted as the increase in log o dds that the file is malw are which is asso ciated with the j th feature “turning on" (i.e. flipping from 0 to 1) and all other features staying constant. Thus, features with large p ositiv e (resp ectiv ely , negative) b eta weigh ts can b e consid- ered particularly strong predictors of goo dness (resp ectiv ely , badness). In the results section, we explore prop erties of the most “influential" features, defined as the collection of 100 features with the largest p ositiv e w eigh ts and 100 features with the largest negative weigh ts. As our purp ose in this pap er is to compare the effect of different feature subsets on predictiv e p erformance, and not to explore the predictive b enefits of v arying lev els of sparsit y in f eature selection, w e simply fix the sparsity parameter to 1.0. 3.3 Results and Discussion In Figure 5 and T able 2, we compare the p erformance of the logistic lasso parasitic malware classifier using datasets with and without wa v elet features. In particular, the ROC curves in Fig. 5 graphically depict p erformance results across a range of decision thresholds, and T able 2 highlights n umeri- cal results at particular samples of the R OC curves. The left hand column of T able 2 shows the hit rate of the mo del, and the right hand column shows the correct rejection rate. Eac h pair of rows in T able 2 can b e seen as providing concrete v alues for samples of p oin ts from the ROC curv es in Fig. 5, where the rows for each pair represen t samples from the blue and red curves which hav e nearly aligned x-co ordinates. Th us, each pair of ro ws describ es the effect of adding w a v elet features at roughly comparable tolerances for risking a false p ositiv e. The wa velet features impro v ed the string-only mo del’s abil- it y to detect parasitics while simultaneously reducing false p ositiv es. The effect of wa velet features on detection was fairly strong for most false p ositiv e rates. F or example, for false p ositiv e rates around one-third of one p ercen t, the wa v elet features bo osted detection of parasitic malw are from 80.90% to 82.97% despite only adding ∼ 24k features to the original corpus of ∼ 1.1 million strings. Moreo v er, Fig 5. (right plot) rev eals that inclusion of w a v elet features b oosted the parasitic detection p erformance of a strings- plus-en tropy mo del in a fairly pronounced wa y as well. F or false p ositive rates around .02-.03%, detection of parasitic malw are jump ed from 92.10% to 94.27%. F or false posi- tiv e rates around .77-.79%, detection of parasitic malware jump ed from 98.63% to 98.90%. These results in Fig. 5 (righ t side) reinforce the conclusion of Experiment 1, we find that the wa v elet features capture information that go es b ey ond more p edestrian entrop y-based information (mean, max, standard deviation, etc.). Overall, these results sug- gest that the wa v elet energy spectrum extracted from the en tropy signal of an executable file provides a useful set of features for a mac hine learning mo del for automatically de- tecting parasitic malware. Moreov er, the predictive v alue of these features seems to not be redundant with other, simpler summary features deriv able from the en trop y signal. In T able 3, we rep ort some additional results ab out the most influential features in the v arious mo d- els. In the strings-only mo del, w e found that the 100 most influential strings in terms of push- ing the mo del to wards a parasitics classification in- cluded examples suc h as: CreateKernelThread, Tram- poline, FreeAllBuffers, VVVVVVVVVVVVVVVVVVVVVVVVVV- VVVVVVVVVVVVVVVVVVVVVVVV, UUUUUUUUUUUUUUUUUUUUUUU- UUUUUUUUUUUUUUUUUUUUUUUUU, SetProcessPriorityBoost , CreateProcessA , and ! Best regards 2 Tommy Salo 002E [Nov-2005] yours [Dziadulja Apanas] . F or the strings+w av elet mo del, we see that ev en though the wa v elet features comprise a relatively small proportion (2.1%) of the strings+wa v elet model, they constitute a relatively large prop ortion (7.0%) of that mo del’s set of influential features. F rom an adversarial p oin t of view, it is a nice finding that w av elet-based features can displace some of the imp ortance of strings, as it is presumably easier for an ev asive mal- w are writer to alter a suggestive string such as Trampo- line (the string is suspicious as it evok es deriv ativ es of the state-sponsored Stuxnet parasitic worm) than to dis- place an entropic energy sp ectral configuration in a direc- tion fav ored by a machine learning mo del. Finally , in the strings+w av elet+entrop y model, wa velet features were also disprop ortionately influential on the final classification; they w ere ab out 2.5 times more likely to b e influential features than w ould hav e b een predicted based on their o v erall prev a- lence in the feature corpus alone. 4. GRAND DISCUSSION All together, w a velet decomp ositions on soft w are entrop y seem to b e useful for malware prediction tasks b y captur- ing the degree to which a p ortable executable file exhibits suspicious patterns of shifting entrop y within its byte-lev el co de. In particular, w e considered the problem that certain kinds of malw are (e.g. parasitic malware) tend to contain c hunks of encrypted and compressed co de em b edded in an otherwise normal lo oking executable file. T o address this situation, w e applied a wa velet decomposition to eac h file’s en tropy stream so as to obtain eac h file’s entropic wa velet energy spectrum. The entropic wa v elet energy spectrum Str ings Str ings + Entrop y 60 70 80 90 100 0.0 0.2 0.4 0.6 0.8 1.0 0.0 0.2 0.4 0.6 0.8 1.0 F alse P ositiv e Rate (%) Hit Rate (%) W a v elets Y es No Figure 5: Performance b o ost on par asitic malwar e dete ction task c ause d by adding wavelet-b ase d fe atur es to two differ ent b aseline fe atur e pr o c essing methods. Performance here was measured as accuracy by a logistic lasso classifier on a hold-out test set of softw are samples. Predictiv e Accuracy (T est Set) Mo del P arasitic Malware Clean Softw are Strings 80.90% 99.64% Strings+W av elet 82.97% 99.65% Strings+En trop y 92.10 % 99.97% Strings+En trop y+W av elet 94.27 % 99.98% Strings+En trop y 98.63% 99.19% Strings+En trop y+W av elet 98.90 % 99.23% T able 2: W avelet-b ase d de c omp ositions of softwar e entr opy b o osts p erformanc e on a p arasitic malwar e dete ction task. The left hand column sho ws the hit rate of the model, and the right hand column shows the correct rejection rate. Each pair of ro ws show the numerical v alues for p oin ts that form approximate vertical slices through the red and blue ROC curves in Fig. 5. That is, each pair of rows compares hit rates on parasitic malware for appro ximately equal false p ositiv e rates on clean soft ware. Con tribution of W a v elet F eatures Mo del % of All F eatures % of Influential F eatures Strings+W av elet 2.10% 7.00% Strings+En trop y+W av elet 1.96% 4.50% T able 3: W avelet-base d fe atur es ar e disprop ortionately likely to b e influential fe atur es. As defined in Section 3.2, influential features hav e a particularly strong impact on the mac hine learning model’s classification. c haracterizes how a file distributes entropic change across m ultiple levels of spatial resolution. In the first study , we found that a single feature derived from wa v elet decomposi- tions of softw are entrop y can yield v aluable predictive infor- mation in a heterogeneous corpus of malware. In the second study , we found that features derived from the w av elet de- comp ositions b oosted p erformance on a large-scale parasitic malw are detection task, and that a classifier built solely on three t ypes of features (strings+entrop y+w a v elet) can pro- duce excellent predictive performance. In b oth studies, we found that the information pro vided by wa velet decomp osi- tions of softw are entrop y is not merely redundant with more common measures such as mean entrop y or standard devia- tion of the entrop y . F uture research relating wa velet decomp ositions to malware classification in machine learning tasks might consider any of the follo wing goals: 1. Exploit predictive v alue from information ab out the lo c ation of en tropic change (perhaps as pointers for extracting further information about those parts of the file). This lo cation of entropic change is provided in the mother wa v elet co efficien ts across which we hav e marginalized to obtain the w a v elet energy spectrum. 2. Apply a more p o w erful classifier, such as a deep- learning neural netw ork, which could consider more complicated in teractions b et w een features when mod- eling the resp onse. In addition, incorporate other classes of features (n-grams [7], statistical functions of n-grams [14], etc.) What kinds of features interact usefully with the w a v elet energy spectrum in predict- ing malware, and what can w e learn from that ab out the existing corpus of parasitic malware? 5 3. In v estigate the p oten tial utilit y of non-entr opic w av elet energy sp ectra from byte-lev el representations of executable files. Indeed, entrop y streams are just one p ossible example of real-v alued streams deriv able from byte-lev el file con ten t (see e.g. [14]), and wa v elet energy spectra can b e extracted from any real-v alued function on the raw bytes. 5. REFERENCES [1] Anderson, B., Storlie, C., & Lane, T. (2012, Octob er). Impro ving malware classification: bridging the static/dynamic gap. In Pro ceedings of the 5th A CM w orkshop on Securit y and artificial intelligence (pp. 3-14). ACM. [2] Ba ysa, D., Lo w, R. M., & Stamp, M. (2013). Structural en tropy and metamorphic malware. Journal of computer virology and hacking techniques, 9(4), 179-192. [3] Brosc h, T., & Morgenstern, M. (2006). Run time pac kers: The hidden problem. Black Hat USA. [4] Subasi, A., Yilmaz, M., & Ozcalik, H. R. (2006). Classification of EMG signals using wa v elet neural 5 Note that the predictiv e p erformance of the model would lik ely improv e b y first applying appropriate dimensionality reduction techniques; see e.g. [17]. net work. Journal of neuroscience methods, 156(1-2), 360-367. [5] Lyda, R., & Hamro c k, J. (2007). Using en trop y analysis to find encrypted and pac k ed malware. IEEE Securit y & Priv acy , 5(2). [6] Kandasw am y , A., Kum ar, C. S., Ramanathan, R. P ., Ja yaraman, S., & Malmurugan, N. (2004). Neural classification of lung sounds using wa v elet co efficien ts. Computers in biology and medicine, 34(6), 523-537. [7] K olter, J. Z., & Malo of, M. A. (2004, A ugust). Learning to detect malicious executables in the wild. In Pro ceedings of the tenth ACM SIGKDD in ternational conference on Kno wledge discov ery and data mining (pp. 470-478). A CM. [8] Nason, G. (2010). W a v elet metho ds in statistics with R. Springer Science & Business Media. [9] Omerhodzic, I., A vdako vic, S., Nuhano vic, A., & Dizdarevic, K. (2013). Energy distribution of EEG signals: EEG signal wa v elet-neural netw ork classifier. arXiv preprint [10] P ati, Y. C., & Krishnaprasad, P . S. (1993). Analysis and synthesis of feedforw ard neural net w orks using discrete affine w a v elet transformations. IEEE T ransactions on Neural Netw orks, 4(1), 73-85. [11] Sorokin, I. (2011). Comparing files using structural en tropy . Journal in computer virology , 7(4), 259. [12] Subasi, A. (2007). EEG signal classification using w av elet feature extraction and a mixture of expert mo del. Exp ert Systems with Applications, 32(4), 1084-1093. [13] Sc h ultz, M. G., Eskin, E., Zadok, F., & Stolfo, S. J. (2001). Data mining metho ds for detection of new malicious executables. In Security and Priv acy , 2001. S&P 2001. Proceedings. 2001 IEEE Symposium on (pp. 38-49). IEEE. [14] T abish, S. M., Shafiq, M. Z., & F aro oq, M. (2009, June). Malware detection using statistical analysis of b yte-level file con ten t. In Proceedings of the A CM SIGKDD W orkshop on Cyb erSecurit y and In telligence Informatics (pp. 23-31). ACM. [15] W o jnowicz, M., Chisholm, G., & W olff, M. (2016, Marc h). Suspiciously Structured Entrop y: W av elet Decomp osition of Soft w are Entrop y Reveals Symptoms of Malware in the Energy Spectrum. In FLAIRS Conference (pp. 294-298). [16] W o jnowicz, M., Chisholm, G., W allace, B., W olff, M., Zhao, X., & Luan, J. (2017). SUSPEND: Determining soft ware suspiciousness b y non-stationary time series mo deling of en trop y signals. Expert Systems with Applications, 71, 301-318. [17] W o jnowicz, M., Zhang, D., Chisholm, G., Zhao, X., & W olff, M. (2016, Octob er). Pro jecting" b etter than randomly": How to reduce the dimensionalit y of very large datasets in a w a y that outperforms random pro jections. In Data Science and Adv anced Analytics (DSAA), 2016 IEEE International Conference on (pp. 184-193). IEEE. [18] W o jnowicz, M., Chisholm, G., W olff, M., & Zhao, X. (2016). W av elet decomp osition of soft w are entrop y rev eals symptoms of malicious code. Journal of Inno v ation in Digital Ecosystems, 3(2), 130-140.
Original Paper
Loading high-quality paper...
Comments & Academic Discussion
Loading comments...
Leave a Comment