Passive Crowd Speed Estimation in Adjacent Regions With Minimal WiFi Sensing
In this paper, we propose a methodology for estimating the crowd speed using WiFi devices without relying on people to carry any device. Our approach not only enables speed estimation in the region where WiFi links are, but also in the adjacent possi…
Authors: Sa, eep Depatla, Yasamin Mostofi
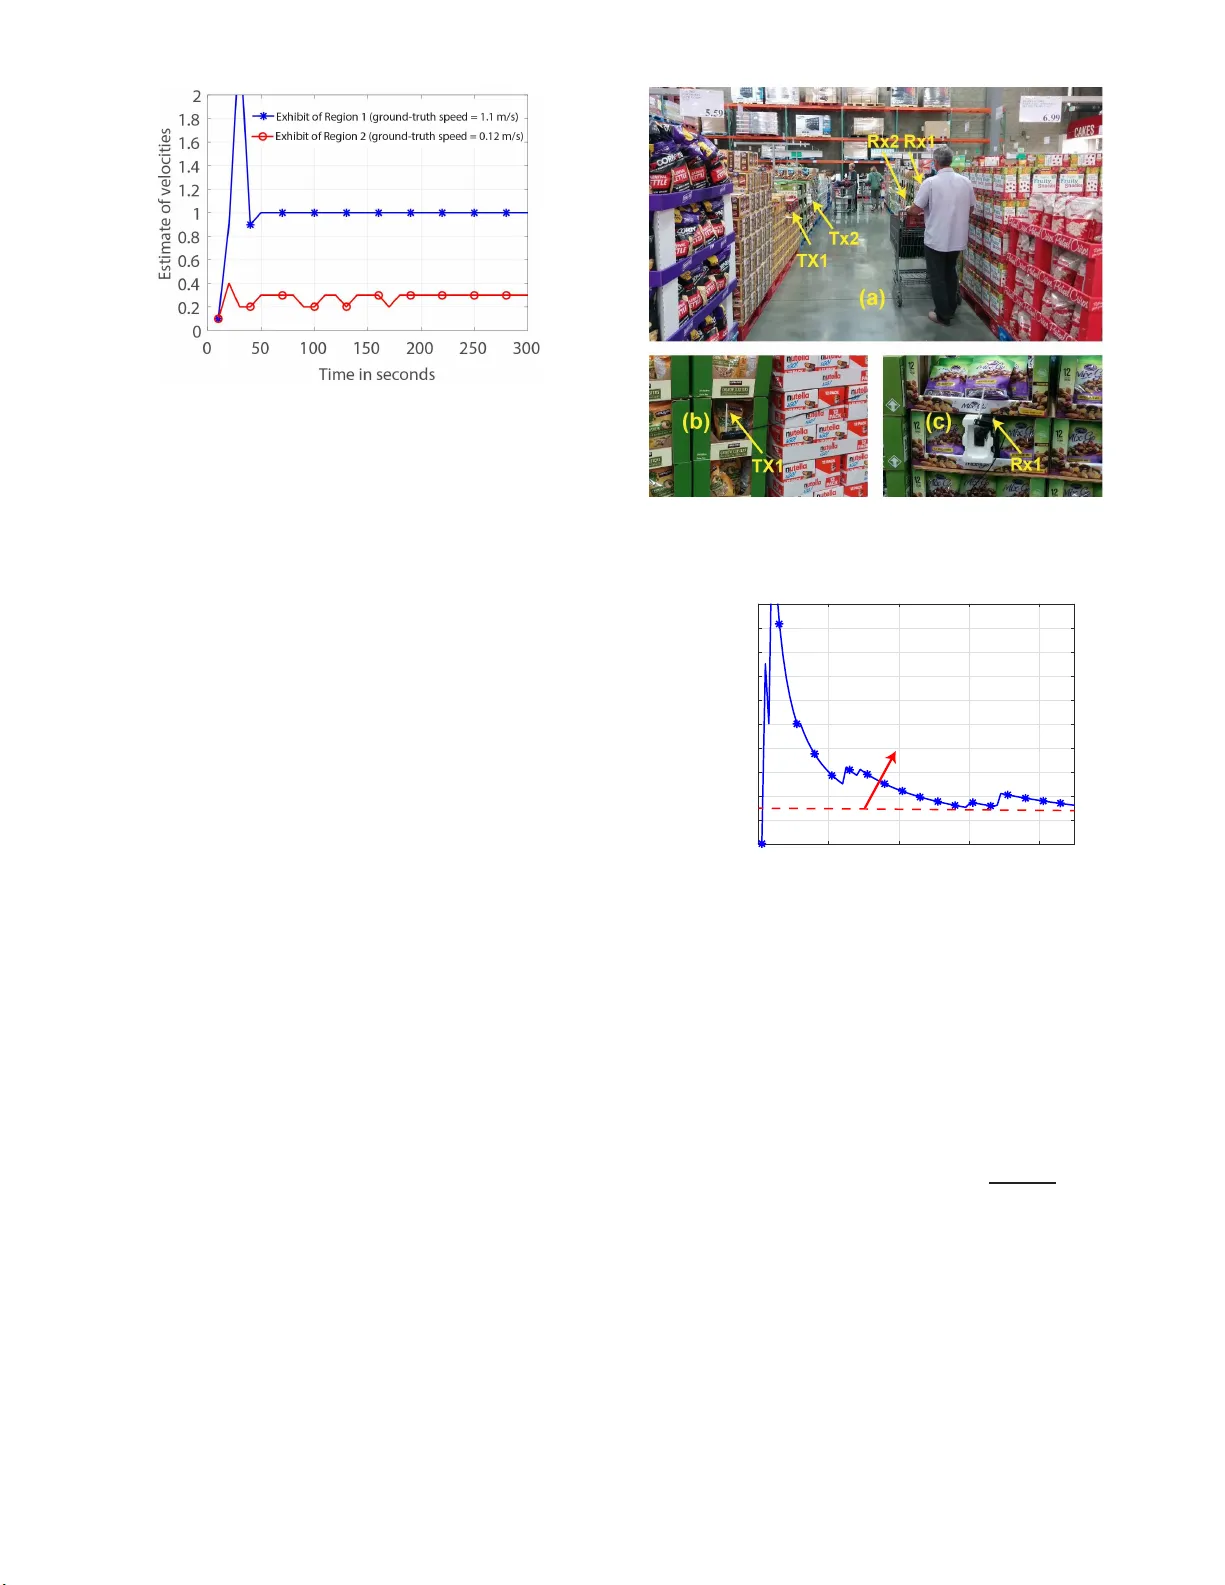
P assiv e Cro wd Spe ed Estimation in Adja cent Regions With Minimal WiFi Sensing Saandeep Depatla and Y asamin Mostofi Abstract —In this paper , we propose a methodology for estimating the cro wd speed using W i Fi dev ices without relying on people t o carry any device . Our approach not only enables speed estimat ion in the region where WiFi links are, but also in the adjacent possibly WiFi-free regions. More specifically , we use a pair of WiF i links in one region, whose RSSI measurements are then used t o estim ate the crowd speed, not only in this region, but also in adjacent WiFi-free regions. W e first prov e how the cross-correlation and the probability of crossing the two links implicitl y ca rr y key inf or mation about the pedestrian speeds and dev elop a m athematical model to relate them to pedestrian speeds. We then v ali date our approach with 108 experiments, in both indoor and outdoor , where up to 10 people walk in two adjacent areas , wit h v ariety of speeds per region, showing that our framew ork can accurately estim ate these speeds with only a pair of WiFi links in one region. For instance, the NM SE over all experiments is 0.18. We also ev aluate our framew ork in a museum-type setting and estim ate the popularity of different exhibits. We finally r un expe ri m ents in an aisle in Costco, estimating key attributes of buyers’ behaviors. Index T erms —Crowd speed estim ation, Crowd analytics with WiFi, De vice-free sensing, Crowd behavior sensing, Retail analytics. ✦ 1 I N T R O D U C T I O N C O nsider an area that consis ts of a number of regions, such as a shopping mall, a retail store, a museum, or a train station. People may hav e dif ferent av erage speeds in differ ent regions, depending on the specifics of the re gions in terms of popularity , usefulness, or ease of tra versing, amon g other factors. For instance, one region of a d ep artment store can b e mo re popu lar than other regions, resulting in people slowing down. A particular exhibit may be less popu lar in a museum, resulting in people speeding up. Finally , peop le may slow do wn in a specific p art of a train station due to an on going con struction work. Thus , the specifics of a particular region can directly af fect th e speed of the visitors in the c orrespond ing re gion, as studies ha ve also sho wn [1]. In this paper , we are interested in estimating such r egion- dependent speeds . Since a person may n ot have a con s tant speed in a region, in this paper “speed estima tion” refers to estimating the average speed of the people in each region, where the av erage is the spa tial average of the speed of a person in that partic ular region. 1 In other words, people can stop se veral times in a region, or ch ange their instantaneous speed. W e are then interested in estimating their a verage speed, which is region- dependent and can thus re veal valuable information about the regions. Fig. 1 sh ows tw o example s cenarios of the problem of interest (a closed and an op en area), with two adjacent regions. W e are interested in estimating th e region-dependent speeds of the pedestrians in th ese two regions, with a p air of WiFi lin ks in only one region (e.g., Region 1 in Fig. 1). More importantly , we are interested in su ch estim ations in large areas. Then , movements o f people in Region 2 may not directly af fect the lin ks in Region 1. F or instance, th e WiFi signal may be too weak by the time it gets to Region 2, resulting in a W iFi-free Region 2. As such, we are in terested in estimating the crowd sp eed not only in Region The authors are with the Department of El ectric al a nd Computer Engineering, University o f California Santa Barbara, Santa Barbara , CA 93106, USA email : { saandeep, ymostofi } @ece.ucsb .edu. This work is funded by NSF CCSS awar d # 1611254. 1. W e may drop the t erm “average” t hroughou t t he paper for brev ity . 1 where the links are, but also in the adjacent possibly WiFi-fr ee regions. Es timation of the s peeds in bo th re gions, by r elying on sensing and WiFi signal availability in o nly one region, is what we refer to as speed estimation with sensing in only o ne region in this paper . 2 Finally , we are interested in crowd speed estimation witho ut relying on people to carry any device, to wh ich we refer as passive speed estim atio n. Motivating Examples: The ubiqu ity of in expensiv e, low- cost, and low-power Internet-of-Things (IoT) sensors p resent g reat opportun ities for learning about our surroundings lead ing to IoT - enabled smart ambiance. The kn owledge of peop le’ s walking speed in a particular region can be useful for several application s . For ins tan ce, re tail stores can learn ab o ut th e popularity of the products on dif ferent aisles, if th ey k now buyers’ speeds in diff erent p arts of th e stores. Con sider an aisle in a retail store containing a specific typ e of product, for ins tance. Shoppers that are en tering th is aisle will walk at a no rmal pace if the produ cts in the aisle do n ot attract their attention . On the oth er hand, th ey may slow d own, or sto p to look at the items if they find them of interest. Therefore, by estimating the av erage speed of the pedestrians in an aisle, the popu larity of the products in that aisle can be inferred. This information, in turn, can sig nificantly help with business planning . Similarly , m useums can estimate which of their exhibits are mo re popu lar , based on the speeds of the visitors. For instance, consider a mus eu m with dif ferent exhibits. The visito rs typically slow down and spend more time in the exhibit that interests them more. Therefore, b y estimating the average speed of the visitors in each exhibit, the popu larity of the corresponding exhibit can be inferred. Sm art cities can further design the traf fic signal timin g s fo r th e pedestrian crosswalks based on their speeds [2]. Furthermore, identifying the slow areas can further help with 2. W e emphasize that our approach works the same i f the adjace nt region is not W iFi-free, or if t he m ovements of people in Region 2 affect the t ransmitted signals. In other words, our propo sed approach does not rely on t he av ailabil ity of the transmitt ed signals in the a djacent regions and as such can work equall y well i f the adjac ent area s are WiFi-free. Fig. 1: T wo example scenarios of the problem of i nterest, where an area consists of two regions, Region 1 and Region 2, as indicat ed. People move casual ly throughout the area with a specific speed in e ach region. A pair of W iFi links are locat ed in Region 1. W e are then inte rested i n est imating the region-dependent speeds of both regions, based on only WiFi RSSI measureme nt s of the links and signal availability i n Region 1. (a) sho ws an example of a c losed area, such as an exhibition or a museum, where the total number of people i nside the area changes slowly with ti me a nd people can traverse bac k a nd forth or change directions i nside the a rea any number of times depending on their i nterest, whereas (b) shows an example of an open area such as a train sta tion, where people can come and go from both regions and c an form flow direct ions. city planning such as allocation of new roads and f acilities, or design of a sh opping center . Public places, such as a train station, can further detect abno rmal behaviors if an aty pical slow down is estimated in a particular area. Resources can then b e allocated accordingly . 1.1 Related W ork In th is section, we discu ss the s tate-of-the-art for estimating th e speed of a crowd. Infrared-Based A pproaches: Infrared (IR) sensors can be utilized to sense h uman activities in an environment. For instance, it h as been proposed for cou nting the total number of people [3], [4], or for tracking human motion [5]. More recent work has explored classifying the speed of human m otion usin g passive IR sensors. For instance, [6] classifies the speed of a sing le person walking in a hallway as slow , mo derate, or fast using three I R sensors. A training phase in which a single person walks at diff erent speeds is first utilized to train a classifier , which is then used to classify the speed o f a person. This work, howe ver , only considers a sin gle pedestrian. In general, th ere is no existing IR- based work th at can estim ate the speed of a crowd of p eople, or do it with sensing in o nly one re gion. More importantly , while IR s ensors may be av ailable at the entrance and exit of a retails store, th ey need to be installed th roughou t the store for collecting analytics, whereas smart IoT WiFi devices already exist througho u t most stores. Neve rtheless, we note th at the m ethod we propose in this paper can also be implemented with active IR, instead of WiFi, to enable speed estimatio n of a cro wd with IR. V ision-Based A pproaches: V ision-based method s can p oten- tially be u sed to estimate the speed of ped es trians in the immediate area wh ere the cameras are installed [7]–[10]. These m ethods in volve using cameras to continu ously record a vid eo of the scene in which the pedes trians are walking, followed by computer-vision algorithms to estimate the speeds. Howe ver , while consu mers are fine with s ecurity cameras being probed in an on-demand manner for security p urposes, serious p rivac y concerns arise when cameras are utilized in p u blic p laces to analyze cu stomer behaviors. For instance, a recent survey on retail shop pers [11 ] reveale d that 75% of th e p eople who und ersto od the capabilities of v ision-based tracking technolo gies found it intrusiv e for retails to track their behavior u sing such a techn o logy . Furthermore, em ploying such tracking techniq u es could lead to sho ppers choosing n ot to visit the corresponding stores, as reported in [12]. In sum mary , vis ion- based tracking and s peed estimation m ethods hav e the major drawback o f p ri vacy violation. Moreov er , v ision-based methods in volve installing cameras and utilizing com plex computer-vision algorithms which can be e xpen s iv e. F or instance, W almart dis- continued its in-store vision-based tracking technology after a fe w months, as it was too expensive [13]. Finally , v ision-based techniques can only estimate the speed of people in the areas that are in the d irect lin e-of-sight of the cameras. Radio Frequen cy (RF) s ig nals, on the other hand, can alleviate some o f th e d rawbacks associated with the vision-based systems . For th is reason, there has b een a considerable interest in using RF signals for estimating some o f the characteristics of a pedestrian flow , such as the n u mber of ped es trians in an area [14 ]– [16], the locations of th e p eople [1 7], the walking direction [18], the walk- ing speed [19], and other sens ing ap p lications [20]. In particular , the work on speed estimation, using R F signals, can be classified into device-free passive and device-based activ e meth ods, as we summarize next. Device-Based Act ive RF Appr oaches: De vice-based acti ve methods depend on the information provided by a mob ile d e vice carried b y the p edestrians, such as the Medium Access Con trol (MA C) data, to track people. How ever , these method s require the shop p ers to carry a wireless device, or an o n-body sensor, which lim its their ap plicability . More importantly , if a store is to use sh oppers’ devices to gather store an alytics, it can only gather crude, low resolution tracking data, based on monito ring which router the device is connected to in the s tore (i.e., this data may no t directly translate to speed estimation in diffe rent aisles). Even then, serious p ri vacy co ncerns lim it the applicability of such an approach in public places. For instance, No rdstrom, a clothing co mpany which implemented an acti ve W iFi-based in- store tracking techno logy to analyze the behavior of their cus- tomers, withdrew it due to p ri vacy co ncerns of the sh oppers [21]. Furthermore, a recent survey on acti ve W iFi tracking technolo gy [12] reve aled th at 80 % o f the sh oppers do not like to be tracked based on their smartphones, while 43 % do not want to shop at a store that employs active W iFi tracking technolo gy . Device-Fr ee P assive RF Approaches: The device-fr ee pas- siv e methods, o n the other hand , leverage the interaction of RF s ignals with the p edestrians and hence do not require the pedestrians to carry any device. In this manner, they can preserve the pri vac y . Among th e de vice-free m ethods, [ 22] classifies the speed o f a s ingle person walking in a circle of radius 2 m , based on the RSSI measu rements of a mobile phone located a t the center of the circle. A prior training p hase, in which RSSI measurements are collected when a single p erso n is walking in the area with th ree diffe rent speeds, is utilized. [23 ] classifies the speed of a sing le person , using FM radio receiv ers. Similarly , a training phase in which a person walks at differ ent speeds is used . Howe ver , in these work, only one person is considered in the area and classification of a single s peed is performed based on extensi ve p rior training. In realistic s cenarios, such as in p ublic places, there will be sev eral p ed estrians walking at the same time. In [24 ], RSSI measuremen ts of several W iFi links are used to track up to 4 p eo ple walking in the same area. Such an approach can in principle b e extended tow ards speed estimation. Ho weve r , this and other work on trackin g [25] typically h a ve to assu me ver y fe w people (less than 5 ). Moreover , in order to estimate region- dependent speeds o f a crowd of pedestrians, there is no need to track every in dividual, as we shall see in this p aper . In o ur previous work (conference version of this work [26]), we ha ve sho wn ho w to estimate the walking speed of multiple people in a single region (i.e., when peop le are walking with same speed throu ghout the region). This is a special case of th e scenario considered in this paper where the speed of peop le is the sam e in both the regions. In this pap er, we th en build on our previous work to d e velop a gen eralized m ethodolog y that can estimate the speed of a crowd in two adjacent regions, where people can walk with diff erent speeds in each region, based o n on ly WiFi sensing in o ne region. 1.2 Goals and Contrib utions T o the b est of ou r knowledge, passive estimation of the s p eeds o f a cro wd in multiple regions, with ubiquitou s IoT devices utilizin g RF sen sing in only one region, has not been explored, which is the main m otiv ation for the propo s ed work. More specifically , our goal in this paper is to estimate th e region-dependen t (average) speeds of a crowd of p ed estrians in two adjacent regions, with o ut a need for th em to carry any wireless device, and by measuring the Received Signal Strength (RSSI) of a pair of WiFi lin ks in only o ne region. Our approach enables the es tim ation of th e sp eed not on ly in the region where the p air of links are, but also in the adjacent W iFi-free regions as well. It further shows that it is indeed possib le to estim ate the motion attributes of a crowd in RF- free zones. Fig . 1 shows two sample scenarios with two regions, Region 1 and Region 2, and with a region-depen d ent speed, i.e., people walk with (average) speed of v 1 in Region 1 and (a verage) speed of v 2 in Region 2. T wo links are installed in Region 1, as can be seen. W e are th en in terested in estimating these region- dependent speeds , b ased on o n ly the RSSI measurements of th e links in Region 1 , and without relying on any impact people m ay hav e on the links when in Region 2. W e next su m marize our key contributions: • W e mathematically characterize the probability of crossing a link, b y u sing a Markov chain modeling and borrowing theories from s tatistical data analysis. Our results reveal the functional dependency of th e probability of crossin g on the speed s in both regions. They further ind icate how dif ferent attributes o f the two re gion s , such as th e dimensions of the regions, impact th e probability of crossing. • W e show how the aver age speeds of the two regions can be estimated u s ing the p robability of crossing and the cross- correlation of the two links. T o the best of our knowledge, this is the first tim e that the speeds of a crowd in m ultiple regions are passi vely estim ated with WiFi. Moreover , this is th e first time the speed s of adjacent WiFi-f ree regions are estimated. It is noteworthy that our a pproach does not require a training phase where people walk in the area with different speeds bef orehand. • W e conduct a to tal of 108 experiments, with up to 10 p eople walking in both an indoor and an outdoor ar ea that has two regions, with a v ariety of speed s per region, an d show that our approach can a ccurately estimate th e sp eeds o f pedestrians in the two adjacent regions by u sing the RSSI measurements of a pair of W iFi link s located in one re gion. For instance, the Normalized Mean Square Error (NMSE) of our speed estima- tion over all the experiments is 0 . 1 8 . Furthermo re, the overall classification accurac y , when cro wd’ s speed is cate gorized as slow , normal, o r fast, is 85% . Finally , the sensing is minima l in th e sen se that the num ber of links per the to tal size o f the area to be monitored is consid erably sm all (e.g., 2 links per 14 m × 4 . 5 m ). • W e further validate our frame work in a mu s eum setting, where there are two exhibitions each contain ing very different typ es of displays. W e th en estim ate the region-dependent ave rage speeds of the in vited vis itors and thus deduce which exhibit was more popular . W e finally run an experiment in an aisle in Costco, estimate key attrib utes o f buyers’ mo tion beh a viors, and ded uce the in terest of the buyers in the p roducts in that aisle. W e note that wh ile we showcase ou r approach with 2 regions, our ap proach can be easily extended to speed estim ation in M adjacent re gions for any M > 2 , with m inimal sensing i.e., with sensing in less than M regions. The rest of the p aper is organized as following. In Section 2, we dis cu ss the pro b lem setup. In Section 3, we mathematically characterize two key statistics, the probability o f crossing and the cross-correlation between a pair of WiFi links, and show how they carry vital information on th e speeds of pedestrians in bo th re gion s, and present a methodo logy to estimate these speeds accordingly . In Section 4, we th o roughly validate our frame work with seve ral experiments. W e conclud e in Section 5. 2 P R O B L E M S E T U P Consider the scenario where N pedestrians are walking in an area that con sists of two adjacent regions, Region 1 and Region 2, with region-dependent sp eeds, as shown in Fig. 1. A pair of WiFi links are located in o ne region, which make RSSI measurements as peo ple walk in the two regions. The goal of this p aper is to estimate the speeds of the pedestrians in th e two adjacent regions, using the WiFi measurements of the links located in one region. T o keep the paper applicable to many scen arios, we consider two possible general cases, as shown in Fig. 1. The first case (Fig. 1 a), can represent a museum, a conference, o r an exhibit-typ e setting where the total number of people inside the overa ll area changes slowly with time such that it can be consid ered constant over a small period of time. People can hav e any motio n behavior in this area and can possibly trav erse the area several times back and forth, through diffe rent regions, dependin g on their interest. The second case (Fig. 1b), on the oth er h and, captures the cases where people can enter and exit th rough both regions, and can form flow directions through the area. Then th e total number of peop le can change rapidly with time and cannot be co nsidered a constant. This case represents s cenarios like train stations or a sto re aisle. As we show in this paper , the estimation of the region- dependent speeds can be achie ved for both cases under the same unifying framew ork. W e assume that, N , th e total number of people in th e area (or N avg , th e average nu mber of peop le for time- var ying cases such as Fig. 1b ) is known. Assuming the knowledge of the total n umber of p eople in the area is reasonable for many applications. For instance, in sto res, there may be mechanisms (such as d oor sensors) to count the total nu mber of people in the s to re. Then, it would be of in terest to estimate the speed of shoppers in different regions. W e further no te th at the total number of p eople can also be estimated with additional sensing in the area. Thus, in this paper we focus o n estimatin g the region-dependen t speeds, assum in g N (or N avg ), and based on min imal sensing in only one region. In this sectio n , we summarize a simple motion model for the pedestrians and briefly d iscuss their impact o n the links. This is th en followed by ou r p roposed m ethodolog y for estimating the region-dependent speed s in the next section . 2.1 Ped estrian Motion Model In this paper , we assu me th at people move casually in the two adjacent regions and do not assum e any specific pattern for their motion. T o describe a casual motion, we then use the sim ple mathematical m odel of [14], which we briefly summarize next. Consider the mo tion o f a single person in the workspace of Fig. 1. Let x ( k ) , y ( k ) , and θ ( k ) denote th e position along x- axis, the position along y-axis, and th e heading of th e person w .r . t. th e x-axis, at time k , respecti vely . Since the person walks casually in the area, he/she keeps walking in a particular d irection, while occasionally chang ing the direction of motion . This can be captured b y using the following mo del for th e headin g direction: θ ( k + 1) = ( θ ( k ) with probability p Uniformly in µ with probability 1 − p (1) where µ = [ − θ max , θ max ] ∪ [ π − θ max , π + θ max ] , for the case o f Fig. 1a since people can change their direction any time and can tra verse th e area back and forth as many tim es as they wish. θ max then defines the maximum angle for the direction of motion. For instance, when θ max = 90 ◦ , the person can choose any direction in [0 , 2 π ] . Then, θ max allows us to mo del the m o tion dependin g on the en vironm ent and scenario. For in stance, θ max is ty pically less than 90 ◦ in lon g hallways [27]. For the case o f Fig. 1b, we assume that people mainly travel in a forward direction. Thus, we take µ = [ − θ max , θ max ] or µ = [ π − θ max , π + θ max ] depend ing on the direction of m o tion. Based on Eq. (1), the position dy namics are then given as follows: x ( k + 1) = ( x ( k ) + v 1 δ t cos ( θ ( k )) if 0 ≤ x ( k ) < B 1 x ( k ) + v 2 δ t cos ( θ ( k )) if B 1 ≤ x ( k ) < B , (2) y ( k + 1) = ( y ( k ) + v 1 δ t sin ( θ ( k )) if 0 ≤ x ( k ) < B 1 y ( k ) + v 2 δ t sin ( θ ( k )) if B 1 ≤ x ( k ) < B , (3) where δ t is the time step, and B = B 1 + B 2 . For the ca se of Fig. 1a, we assume that wh en a person en counters any of the four bound aries of the area, he/sh e reflects o f f o f the boun d ary , similar to a ray of light. 3 For the open area of Fig. 1b, o n th e other h and, we assum e a main ly forward flow from each entrance tow ards th e opposite exit. Then, the person exits the area up o n reaching the opposite exit. W e then use this m otion model in the next section when d ev eloping our methodolo gy for estimatin g the speeds. 3. T hi s boundary behavior i s only assumed for the purpose of model ing. In our experiments, we have no control over how people walk. 2.2 Effect of Ped estrians on the WiFi Signals As sh own in Fig. 1, a pair of W iFi link s located in Region 1, m ake wireless measurements as the pedestrians walk in the two regions. When a pedestrian (or multiple) crosses a link, the correspon ding RSSI measurement will drop , to which we refer as Line o f Sight (LOS) blockag e. When peop le do not block the LOS b ut they are in the vicinity of a link, they can still impact the receive d signal through multipath. The proposed meth odolog y of this p aper is based o n utilizing only the LOS blo ck age impact. In Section 4.2, we show how to estim ate the LOS blockag e sequ ence from the recei ved RSSI measurements. 3 E S T I M A T I O N O F P E D E S T R I A N S P E E D S In th is section , we prop o se a framew ork to estimate the region- dependent sp eed o f pedestrians in two adjacent regions, using a p air of WiFi lin ks located in only one region, as shown in Fig. 1. More specifically , we first derive a mathematical expression for the probab ility of p ed estrians cross ing a WiFi link. W e th en characterize the cross-correlation between th e tw o links. Our analysis shows that these parameters carry key information o n the speeds of the pedestrians in both regions, which we then use to estimate the speed s . A key feature o f our ap proach is that it only relies on WiFi signal av ailability in the region where th e links are but can d educe the speed o f the crowd in the adjacent possibly W iFi-free region. In this s ection, we first characterize the probability o f crossing an d the cross-correlation for the case of the closed area of Fig. 1a, the analysis of which is m ore inv olved since a person can rev erse the d irection of motion anytime and can bounce b ack an d fo rth in the area as many times as he/she wis h es. W e then show how to extend the an alysis to the case of open area of Fig. 1b, putting everything under on e un ifying umbrella. 3.1 Prob ability of Crossing a Link Consider Fig. 1a and th e motion model o f Eq. (1)-(3 ). Sin ce the heading, an d the positions alon g the x -axis and y -axis at time k + 1 , depend only o n th e correspon ding values at time k , we use a Markov chain m odel to describe th e mo tion dyn amics of each pedestrian. W e then use the properties of the corresponding Markov chain to mathematically derive the probab ility of crossing a given link b y a sin gle pedestrian and show its depend ency on th e speeds of each region. This is then followed by characterizing the probability th at any number of p eople cros s a given lin k. W e note that the probability of crossing problem of in terest to this s ectio n is considerably diffe rent from that o f [14], since there are two regions with links in only o ne region. As su ch, a new characterization and methodolo gy is required as we develop in this sectio n. For the p urpose o f modeling , we discretize the work-space and assume that people can choose o n ly discrete positions alo n g x- axis, y-axis, and the heading d irection. 4 More specifically , θ ( k ) ∈ µ d = {− θ max , − θ max + ∆ θ , · · · , θ max } ∪ { π − θ max , π − θ max + ∆ θ , · · · , π + θ max } , x ( k ) ∈ { 0 , ∆ x, · · · , B 1 + B 2 } , and y ( k ) ∈ { 0 , ∆ y , · · · , L } , where ∆ θ , ∆ x , and ∆ y d enote the discretization step size for heading and po s ition along x-axis and y-axis respectiv ely . Let N θ denote the num ber of discrete angles for the heading. Furthermore, let N 1 and N 2 represent the number 4. T hi s is only for the purpose of mathema tical characteri zation. In practice, the positions and hea ding of the pedestria ns are natural ly not limite d to these discrete values. of d is crete p ositions alon g the x -axis in Region 1 and R egion 2 respecti vely . Let Θ( k ) deno te the random var iable representing th e heading of a pedestrian at tim e k . Let π θ ( k ) represent th e corresponding probability vector with the i th element ( π θ ( k )) i = Prob (Θ( k ) = ( µ d ) i ) , wh ere Prob(.) is the probability o f the argument, and ( µ d ) i denotes the i th element o f the set µ d . Then from Eq. (1), we have the following Markov chain for th e headin g Θ( k ) : π θ ( k + 1) = π θ ( k ) P Θ , (4) where P Θ is th e prob ability transition matrix for the heading with ( P Θ ) ij = Prob (Θ( k + 1) = ( µ d ) j | Θ( k ) = ( µ d ) i ) and is g iv en by ( P Θ ) ij = δ ( i − j ) × p + 1 − p N θ = ( P Θ ) j i , where δ ( . ) is the Dirac-delta function, N θ = card ( µ d ) , and card(.) den o tes the numb er of elements in the argument. Since the prob ability transition matrix P Θ is symmetric, it is a doubly -stochastic m atrix, which im plies a uniform stationary distribution for Θ( k ) [28]. This implies that the prob ability that a pedestrian heads in any giv en d irection (in µ d ) is the same asymptotically . Let X ( k ) denote the random variable representing the po sition of a pedestrian along the x -axis at time k . Similar to th e heading direction, we can describe the dynam ics of X ( k ) u sing a Markov chain. Let P X denote the co rresponding probability transitio n matrix for X ( k ) . W e then have the following lemma for the stationary distribution of X ( k ) . Lemma 1. The s tationary distribution o f X ( k ) is given by γ = [ c 1 e 1 c 2 e 2 ] , wher e c 1 , c 2 ar e constants , and e 1 , e 2 ar e N 1 and N 2 -dimensional row-vector s with all their elements as 1 . Pr oo f. Let P X be p artition ed as P X = P 11 P 12 P 21 P 22 , where P 11 is a squ are m atrix of dimension N 1 . Further , P ij , for i, j ∈ { 1 , 2 } , specify the transitio n probab ilities from position s in Re- gion i to po sitions in Region j . The stationary distrib ution of the p artitioned transition matrix P X is sh own in [29] to be γ = [ k 1 γ 1 k 2 γ 2 ] , where k 1 and k 2 are constants, and γ 1 and γ 2 are the station ary distribution vectors correspo n ding to the probability trans itio n matrices, S 11 and S 22 , d efin ed as follows: S 11 = P 11 + P 12 ( I N 2 − P 22 ) − 1 P 21 S 22 = P 22 + P 21 ( I N 1 − P 11 ) − 1 P 12 , (5) where I N 1 and I N 2 are th e identity matrices of dimens io ns N 1 and N 2 respecti vely . Consider any two positio ns, r ∆ x and q ∆ x , alo ng the x-axis that are in the same region (i.e., with the same speed). Then, based on [14], Prob ( r ∆ x → q ∆ x ) = Prob ( q ∆ x → r ∆ x ) , where Prob ( r ∆ x → q ∆ x ) denotes the probability of g oing from q ∆ x to r ∆ x in on e time step. Since the speed of the pedestrians is the same within a region, we th en h a ve, P 11 = P T 11 and P 22 = P T 22 . (6) Furthermore, b y ch oosing the step size ∆ x such that q ∆ x can be reached from r ∆ x in one time s tep if and only if | q − r | ≤ 1 , we hav e the following property for P 12 and P 21 . ( P 12 ) ij 6 = 0 iff i = N 1 , j = N 1 + 1 ( P 21 ) ij 6 = 0 iff i = N 1 + 1 , j = N 1 . (7) By sub stituting Eq. (6) and (7) in (5), we get, S 11 = S T 11 and S 22 = S T 22 . Sin ce S 11 and S 22 are symm etric, the corre- spondin g stationary distributions are uniform, imp lying γ 1 = e 1 N 1 , and γ 2 = e 2 N 2 . Therefore, the s tatio nary distribution of P X is γ = [ c 1 e 1 c 2 e 2 ] , wh ere c 1 = k 1 N 1 and c 2 = k 2 N 2 are co nstants. This p roves the lemma. Lemma 1 states th at the pos ition of a pedestrian along the x-axis h as a uniform asy mptotic d is tribution within each region. W e next deriv e the probability that a pedestrian crosses a link, giv en that the pedestrian is in a region where there is a link (Region 1 in this case). W e th en use this condition al probability of crossin g the link, along with Lemm a 1 , to deri ve th e overall probability of crossing. W e first m athematically define crossing /blocking a link. W e say that a p edestrian crosses/blocks a g iv en link 5 located at X i along the x -axis, at time k + 1 , if either x ( k + 1) ≥ X i and x ( k ) ≤ X i or x ( k + 1) ≤ X i and x ( k ) ≥ X i . With this defin itio n for the cross/block, we then have th e following lemma for the condition al probability o f crossing a g i ven link, given that the pedestrian is in the region wh ere th ere is a link. Lemma 2. Given that a p erson is in Re g io n 1 , the probability of cr os sing a given link in Re gion 1 is given by p c | 1 = v 1 δt sinc ( θ max ) B 1 , wher e sinc ( θ max ) , sin ( θ max ) θ max with θ max in radia ns. Pr oo f. C onsider a link located in Region 1 of Fig. 1a, whose x - coordinate is X i . X i , for in stance, can represent X 1 or X 2 of Fig. 1a. Let th e positio n of the person at time k b e x ( k ) ≤ X i . The p erson crosses the lin k at tim e k + 1 , if h e/sh e choos es a direction θ ( k ) at time k su ch that x ( k ) + v 1 δ t cos ( θ ( k )) ≥ X i , which results in | θ ( k ) | ≤ cos − 1 X i − x ( k ) v 1 δt , where | . | is the absolute value of the argument. Since | θ ( k ) | ≤ θ max , in order to cross th e link, the h eading direction should be as follows: | θ ( k ) | ≤ min n θ max , cos − 1 X i − x ( k ) v 1 δ t o . (8) Since the heading direction is un iformly distributed over µ d , the probability that a p erson at x ( k ) crosses the link in Region 1 at time k + 1 , p x ( k ) c | 1 , is given b y , p x ( k ) c | 1 = min n θ max , cos − 1 X i − x ( k ) v 1 δt o 2 θ max , for x ( k ) ≤ X i . (9) By symmetry , it can be seen that p x ( k ) c | 1 , for x ( k ) ≥ X i , is gi ven by , p x ( k ) c | 1 = min n π − θ max , π − cos − 1 x ( k ) − X i v 1 δt o 2 θ max , (10) The probability of crossin g th e link given the person is in Region 1, p c | 1 , is then obtained by sum ming over all the positions in Region 1 from which a cross can occur: p c | 1 = X i + v 1 δt X x ( k )= X i − v 1 δt ∆ x B 1 p x ( k ) c | 1 , (11) where ∆ x B 1 is the prob ability that a pedestrian is located at any giv en p osition in Re gion 1. By substituting Eq. (9) and (10 ) in (11) and letting δ t → 0 , we g et, p c | 1 = 1 2 B 1 θ max Z X i + v 1 δt X i − v 1 δt min n θ max , cos − 1 X i − x ( k ) v 1 δ t o dx. (12) 5. In this paper, we consider WiFi links t hat a re located paral lel to the y- axis (see Fig. 1). Howe ver , the deriv ati on of the probability of crossing can be extended to a ny general l ink configuration foll o wing a similar approach. By s implifying Eq. (12) fu rther, we get p c | 1 = v 1 δ t sin ( θ max ) B 1 θ max , (13) which p roves the lem ma. By usin g Lemm a 1 and Lemma 2 , we then hav e the following theorem for the probab ility of crossin g a gi ven link by a single pedestrian. Theorem 1. Th e p r o bability of cr o ssing a given link by a single pedestrian , p c, single person , walking with th e speed v 1 in Re g ion 1 a nd sp eed v 2 in Re gion 2, is given by , p c, single person = v 1 v 2 δt s inc ( θ max ) v 1 B 2 + v 2 B 1 . Pr oo f. Th e probability of crossing a given link in R egion 1 by a single pedestrian is given by , p c, single person = c 1 p c | 1 , (14) where c 1 , defined in Lemma 1 , denotes the p robability of the pedestrian being in Region 1, and p c | 1 is th e condition al prob abil- ity that the pedestrian crosses the given link in Region 1 , if h e/she is in Region 1. T o find the probability c 1 , we use th e pseudo-aggregation p rop- erties of the u nderlying Marko v chain [30]. More specifically , for the transition matrix P X , defined in Lemma 1 , with a statio nary distribution of th e form [ c 1 e 1 c 2 e 2 ] , the constan ts c 1 and c 2 are giv en by the stationary distrib ution of th e probability transition matrix P , as we s how next. P = p 11 p 12 p 21 p 22 , (15) where p ij = 1 T P ij 1 N i , for i, j ∈ { 1 , 2 } , an d 1 denotes a column vector wh ose elements are all 1 . W e can then prove th at th e stationary distribution of P in Eq. (15) is ( c 1 , c 2 ) [30]. It can be seen that p 12 , is the probability of crossing from Region 1 to Region 2 . From Lemma 2 , we have, p 12 = p c | 1 2 and p 21 = p c | 2 2 . (16) By sub s tituting Eq. (16) in (15) and s o lving for th e stationary d is- tribution of P , we have, c 1 = v 2 B 1 v 1 B 2 + v 2 B 1 , and c 2 = v 1 B 2 v 1 B 2 + v 2 B 1 . The p robability o f crossin g a given link in Region 1 by a single pedestrian can then be characterized as follows, p c, single person = c 1 p c | 1 = v 1 v 2 δ t sinc ( θ max ) v 1 B 2 + v 2 B 1 . (17) This p roves the theorem. Remark 1. Note that if there was a link in Region 2, th e probability of a single pedestrian cros s ing it would have b een the same. This can be seen from the expression for p c, single person by interchanging B 1 with B 2 and v 1 with v 2 . Further, no te th at the probability of crossing is indepen d ent of the location of the link within Region 1. Since there are N people walking in the area, we next charac- terize the probability th at any numb er of peop le cross a given link, p c ( v 1 , v 2 ) , assuming th at pedestrians’ mo tio ns are indep en dent. W e then hav e the following for the closed case: p c ( v 1 , v 2 ) = 1 − (1 − p c, single perso n ) N . (18) From Eq. (18), it can be seen th at the probability of any number of pedestrians cross in g the lin k is a function of the sp eeds of the pedestrians in both regions. Furthermore, from Rem ark 1, we can see that the probability of crossing a link in Region 2, if there was one in Region 2 , will no t provide any additional information in terms of the speeds in Region 1 an d 2, as it has the same exact function form as the p robability o f crossing a link in Region 1. In other words, it w ould not have been po ssible to estimate the speeds b y utilizing two links, one in Region 1 and on e in Region 2. 3.2 Characterizing the Cross-co rrelation As sh own in Fig. 1, a pair of W iFi links in one region (Region 1) make wireless measurements as peop le walk in two adjacent regions. W e next characterize the cross-correlation between th ese two links and show how it carries vital in formation on the speeds. Consider the closed area o f Fig. 1a. W e say an event E l happens at a link, if l > 0 number o f people block th e link. Let Y 1 ( k ) and Y 2 ( k ) d enote the event sequences co rresponding to Link 1 and Link 2 , as defined below: Y i ( k ) = ( l if E l happens at time k 0 otherwise , for i ∈ { 1 , 2 } . In this section, we show that the cross -correlation between the e vent sequences o f the two lin ks carry ke y information ab out th e speeds of th e pedestrians . W e show ho w to estimate the e vent sequences from real data in the next section. The cross-correlation b etween the two ev ent sequences, Y 1 ( k ) and Y 2 ( k ) , is given b y R Y 1 Y 2 ( τ , v 1 , v 2 ) = Cov Y 1 ( k ) , Y 2 ( k + τ ) r V ar Y 1 ( k ) V ar Y 2 ( k + τ ) , (19) where Cov(. , .), and V ar(.) denote the covar iance and variance o f the arguments, respecti vely . Since the p edestrians walk in depen- dent of each other , we have, Y i ( k ) = N X j =1 Y j i ( k ) , for i ∈ { 1 , 2 } , (20) where Y j i ( k ) = 1 if j th person blocks Link i at time k , 0 otherwise for i ∈ { 1 , 2 } . Since we assum e independent motion for the pedestrians, it can be easily confirmed that the numerator and the denominator of Eq. (19) are prop ortional to N , an d therefore the cross -correlation becom es independ ent of N . This can be seen by substitutin g Eq. (20) in (19), and further simplification s, which results in R Y 1 Y 2 ( τ , v 1 , v 2 ) = Prob ( Y j 2 ( k + τ ) = 1 | Y j 1 ( k ) = 1) − p c, single person 1 − p c, single person , for any j ∈ { 1 , 2 , · · · , N } . (21) It can be seen that Eq. (21) is independent of N . For the case of open area, sin ce the number o f peop le in the area changes with time, N should be consid ered a random variable. Then, by assum- ing that p eoples’ arri val into the area follow a Poisson process, by substituting Eq. (20) in (19), and after further simplification, we get an expression similar to Eq. (21), which is a function of only the m o tion dynamics of a single pedestrian. While it is cons iderably challengin g to derive a closed -form expression for the cross-correlation, th e dep endency o n the speeds can b e easily seen. For in stance, th e first term in the num erator of Eq. (21), Prob ( Y j 2 ( k + τ ) = 1 | Y j 1 ( k ) = 1) , is the pro b ability that the j th person is at Link 2 at time k + τ , giv en th at he/she is at Link 1 at tim e k . Clearly this depends on the speeds at wh ich the j th person is walking in both regions. Hence the cross-correlation in Eq . (21 ) contain s in formation abou t the speeds. Howe ver , given the vicinity o f the two links, and b y cons idering all the possible motion patterns of the p eople, it can be easily seen that the cross- correlation carries more informatio n o n the speed of Region 1, as compared to Region 2. As such, in the n ext part, we utilize it for the estim ation of the sp eed in Region 1, as we shall see. 3.3 Speed E stimation f or the Closed Area As shown in Sections 3.1 and 3.2, the probability of crossing a W iFi link , and the cross-correlation between the two WiFi lin ks, carry key info rmatio n about the sp eeds of the pedestrians in the two adjacent regions. Equ ations (18) and (21) further mod el these relationships, which we then use to estimate th e speeds of the pedestrians in the two regions. Let Y exp 1 and Y exp 2 denote the e vent sequences, correspon d ing to the two WiFi link s , obtained from an experiment. Let R exp Y 1 ,Y 2 ( τ ) denote the cross-correlation between the e vent sequences Y exp 1 and Y exp 2 , and let p exp c, 1 , p exp c, 2 denote the probability of crossing Link 1 and Link 2 respective ly . The probability o f crossing can be computed from the e vent s eq uences as follows: p exp c,i = δ t T × Number of events in Y exp i , for i ∈ { 1 , 2 } , (22) where T denotes the to tal time for which the data is co llected, and δ t is the discretization step size. Since the cross-correlation of Eq. (21) is in dependent of th e total n umber of people, N , we first estimate v 1 from the cross- correlation witho ut assumin g the kn owledge of N . Then, given N and an estimate of the speed in Region 1, i.e., b v 1 , we use the probability of crossing in Eq. (18 ) to estimate the speed in Region 2. More specifically , we h av e, b v 1 = min v 1 ,v 2 τ = T X τ =0 R exp Y 1 ,Y 2 ( τ ) − R Y 1 ,Y 2 ( τ , v 1 , v 2 ) 2 b v 2 = min v 2 p exp c − p c ( b v 1 , v 2 ) 2 , (23) where p exp c = p exp c, 1 + p exp c, 2 2 . In other words, give n that each link will hav e the same probability o f cross, we aver age the experimental probability of crossin g of the two links in order to reduce the impact of errors. W e further only estimate v 1 from the cross- correlation, since it is h eavily dep endent on v 1 , as d iscussed earlier . As for e valuating R Y 1 ,Y 2 ( τ , v 1 , v 2 ) , we utilize simula- tions, which are low comp lexity since th e cross-correlation is independent of N an d can th us be simulated for only on e person . More specifically , for any given speed pair , we simu late o ne person walking in th e area and generate the event sequences corresponding to the two lin ks in the area. R Y 1 ,Y 2 ( τ , v 1 , v 2 ) is then obtained by com puting the cross-correlation between the two eve nt seq uences. Finally , the parameter θ max in p c ( v 1 , v 2 ) is assum ed to be 45 ◦ in all o ur results of the closed areas in the next section sin ce they in volve lo ng hallways. W e note that our results are not very sensitiv e to th is choice of θ max , and θ max for a wide range of angles n ear 45 ◦ will lend similar results as we shall see in the next section. 3.4 Speed E stimation f or the Open Area Consider the open area scenario shown in Fig. 1b . The num b er of people in th e area ca n ch ange during the sens in g period and should be considered a random variable. Howe ver , as explained in Section III-C, since the cross-correlation is not a fun ction o f the number of p eo ple, Eq. (23) can still be us ed to estimate the speed v 1 . W e next show how to characterize the prob ab ility of crossing for the open area in order to estimate v 2 . Let λ d enote the rate o f arri val of peop le in to the area (from both regions). W e assu me that th e rate of departure o f peop le from the area is als o λ . This will be th e case as long as the average number of people, N avg , averaged over a sm all time interva l, does not chan ge sign ificantly with time. Furthermo re, we assume th at each person mainly h as a forward flow , i.e., sh e/he mainly w alks in a forw ard direction and rarely turns b ack. The probability of crossing a link is th en related to the rate of arriv al as follows: p c ( v 1 , v 2 ) = Number of events in time interval [0 T] × δ t T = λδ t, (24) T o relate p c to th e average speed o f peop le in the two regions, we next use a theory from queuing sys tem s. Consider the over all area as a queuin g system in which every person is serviced un til the person exits. Then, the Little’ s law of queuing theo ry [31] relates the aver age numb er of p eople being serviced, N avg , to the a verage time s pent in the area by a person, T avg , and the rate of arri val, λ , as follows: N avg = λT avg . (25) Since we assume that people mainly walk in a forward direction , the ave rage time spent in the corridor can be approx imated as follows: 6 T avg ≈ B 1 v 1 + B 2 v 2 . (26) From Eq. (24), (25), and (26), we can characterize the probability of crossing in terms of the speeds of peo ple in the two regions as follows: p c ( v 1 , v 2 ) ≈ N avg v 1 v 2 v 1 B 2 + v 2 B 1 δ t. (27) v 1 and v 2 can then be estimated by su bstituting Eq. (27) in Eq. (23). Remark 2. Co nsider the expr ession d erived for p c of Eq. (18 ), for the closed case. If we assu me th at the pr obability of simulta- neous crosses are negligible, we can approximate Eq. (18) with N v 1 v 2 δt s inc ( θ max ) v 1 B 2 + v 2 B 1 . F or the open case, Eq. (26) becomes a better appr oximation if θ max is sma ll. Then, by ap pr oximating θ max ≈ 0 , we then have the pr obability of cr ossing of the clo sed ca se appr oximated by N v 1 v 2 δt v 1 B 2 + v 2 B 1 , which is s imila r to th e expr ession derived for the open case in Eq. (27). As mentioned earlier , Eq. (26) can b e more rigor ously related to θ max as pa r t of future work. 4 E X P E R I M E N T A L R E S U LT S In this section, we validate the proposed methodo logy of Section 3 with se veral experiments. W e start with a n umber of experiments in closed areas in b oth ind oor and outd o or , where d if ferent num ber of people walk in two adjacent regions, with a variety o f possible 6. W e note that a better approximation of the average time ca n be ca lculate d by c onsidering the motion model of people in Sec tion 2, as part of our future work. Fig. 2: (a) D-Link WBR 1310 wireless router along with an omni-directional antenna, (b) the TP-Link wireless N150 WLAN card, (c) Raspberry Pi board used to control t he data col l ection process and synchronize t he two W iFi l inks. speeds per region, an d show that our frame work can estimate the s p eeds with a good accuracy . W e then run experiments in a museum-style setting, where two exhibitions showcase two very diff erent types o f displays . Our ap proach can then accurately estimate the v is itor s p eeds in both exhibits, and thu s deduce which exhibit is more pop ular . W e fin ally test o ur framew ork in an op en aisle of a retail store, Costco, and estimate the rate of arri val and speed of people in the aisle, thus in ferring the interest of people in the products o f the aisle. W e next start by explaining the experimental setup and the initial data processin g. 4.1 Experiment Setup As shown in Fig. 1, o ur experiments consis t o f pedestrians walking in two ad jacent regions with dif ferent pos s ible sp eeds in each region. A p air of W iFi links located in one region make wireless RSSI m easurements to estimate the speeds of pedestrians in both regions. W e use a D-link W BR-1310 WiFi router that operates in 802.11 g mo d e as a Tx no d e and a TP-Link W ireless N150 W LAN card config ured to op erate in 802.11 g mode as a Rx node for each link . In order to receiv e and sto re the wireless measurements, the WLAN cards need to be interfaced with a computer via a USB con nection. W e use a portable credit card-sized computer , Raspberry Pi (RPI), for this pu rpose. Furthermo re, to transmit and recei ve the wireless s ig nals, we use omni-directional anten nas at both the router an d the WLAN card of each lin k. Fig. 2 shows the W iFi router , WLAN card, RPI, and the om ni-directional antenna used in our experiments. In order to deriv e th e cross-correlation from th e experimental data, the recei vers of the two W iFi lin k s need to b e synchro n ized in time. T o achieve this, we interface the Rx no des of both WiFi links to th e same RPI and program them to recei ve the wireless sign als at the same tim e instan ts from their correspo nding transmitters. The data is collected at a rate of 20 samp les/second at each recei ver of the W iFi link. Sin ce th e two W iFi links are located at a close distan ce (of the order o f meters), each link is configu red to operate in a d ifferent su b-channel of the 2. 4 GHz wireless band to a void any in terference. Specifically , we use sub-channel 1, which operates at 2 . 41 GHz for one link, and su b-channel 11, which operates at 2 . 4 7 GHz, for th e other link . This s ep arates the two links by the widest frequency margin in the 2.4 GHz W iFi band. Fig. 3 (left) and Fig. 3 (right) show the resulting experimental setup in an outdoo r and an indoor area respectively . 4.1.1 Experimental Speeds As show n in Fig . 1, o u r experiments inv olve p ed estrians wa lking at various sp eed s in each of the two adjacent regions. In ou r experiments of Section 4.3, we ask peop le to walk casually througho u t th e area containing two regions, maintaining a specific speed v 1 in Region 1 and v 2 in Region 2. W e consider three speeds, 0 . 3 m/s , 0 . 8 m/s , and 1 . 6 m/s , for each region, which results in 9 possib le combin ations for the speeds in the two regions. T o help peo ple walk at the correct speeds, we make use of a mobile app lication called “Frequency Soun d Generator” which generates an audible tone ev ery second. Each p erson then listens to this ap plication on his /her mobile and takes a step of length v 1 , while walking in Region 1 and a step of length v 2 , while walking in Region 2 , ever y time h e/she hears the ton e. This ensures correct speeds for peo ple walking in each region. In order to take step s o f length v 1 in Region 1 and v 2 in Region 2 , we have people practice their step leng th s to match v 1 and v 2 prior to the experiments. This procedure is employed o nly to ensu re an accurate ground- truth o f speeds in each region, which is used in assessing the performance of our approach. In our m useum-type experiments and the experiments in the aisle o f Co stco, the sp eed s of people are naturally d etermin ed by their interests in each region, and as such there is n o control over peoples’ speeds in th ose experiments. 4.2 Initial Data Processing As shown in Section 3, our frame work is based on th e eve nt sequences of a pair of W iFi links located in one region, with the e vents correspon ding to people crossin g a W iFi link. Therefore, we need to first extract the e vent sequences of ea ch WiFi link from the correspondin g RSSI measurements. W e next describe this p rocess. T o co n vert the R SSI measuremen ts into an event sequen ce, we first iden tify all the d ips in the RSSI m easu rements and the associ- ated times at which the dips occur . Let k i , for i ∈ { 1 , 2 , · · · , I } , denote these times, and let Z ( k i ) denote th e correspond in g R SSI measurement at time k i . The event sequence, Y exp i ( k ) , is then obtained from the RSSI measu rements as follows: Y exp i ( k ) = ( l if k = k i and Z ( k i ) is closest to R l,i 0 otherwise , for i ∈ { 1 , 2 } , where R l,i denotes the RSSI measurement of the i th W iFi lin k when l people simultaneo u sly block the i th link. W e find the values of R l,i by performing a small calibration phase in which l (up to 2) people s imultaneously block the i th W iFi link and the correspond ing RSSI is measu red. 7 Note that small vari ations in R l,i due to factors such as diffe rent dimens io ns of people crossing th e WiFi link have a negligible impact on our results. For instance, we collect R l,i data for only 2 people in the calib ration phase, while a total o f 10 diff erent peop le walk in each campus experiment. 4.3 Experimental V alidations and Discussions In th is Section , we extensi vely validate our frame work by es tim at- ing th e speeds of people in two adjacent regions of an area u sing the aforementio ned experimental setup . 7. W e need to collect this only for small l as the probabili ty of l people simultaneously blocking the LOS li nk i s negligible for higher l . Fig. 3: (left) The outdoor are a of i nterest a nd (right) the indoor are a of i nterest. Ea c h are a is divided int o two regions, Region 1 and Region 2, as separated by the black li ne in both outdoor and i ndoor case s. The di mensions of t he outdoor area are L = 4 . 26 m , B 1 = 5 . 5 m , B 2 = 8 . 8 m , and t hat of indoor area are L = 2 . 25 m , B 1 = 7 m , B 2 = 13 m (se e Fig. 1 for definiti ons of B 1 and B 2 ). T wo WiFi l i nks, each consisti ng of a transmi tter and a receiver are locate d i n Region 1. Fig. 4: The outdoor a re a of interest with two sna pshots of people walking i n the area. The black line se parates the area int o two regions. People mov e casual ly throughout the area with the given region-specific spee d. A pair of WiFi links locate d in Region 1 makes wireless measurements t o est imate t he s pe e d of people in both regions. T rue speeds ( v 1 , v 2 ) Estimated speeds ( b v 1 , b v 2 ) (0.8, 0.8) (0.9, 0.9) (0.8, 0.3) (0.8, 0.3) (0.8, 1.6) (0.8, 2.3) (0.3, 0.8) (0.4, 0.9) (0.3, 0.3) (0.4, 0.4) (0.3, 1.6) (0.3, 2.4) (1.6, 0.8) (1.7, 0.6) (1.6, 0.3) (1.8, 0.5) (1.6, 1.6) (1.9, 2) T ABLE 1: A s a mple performance of our speed estimat ion approach for Region 1 ( v 1 ) and Region 2 ( v 2 ) of the outdoor a rea of Fig. 4 and the case of N = 5 people. Fig. 3 (left) and (right) show the consid ered outdoor and indo o r closed areas o f in terest respectiv ely . Each area is divided into two re gion s , with a pair of WiFi link s located in one of the regions. The d imensions of the outdo or area are L = 4 . 2 6 m , B 1 = 5 . 5 m , B 2 = 8 . 8 m , X 1 = 2 . 5 m , X 2 = 3 . 7 m , while the dimensions of the ind oor area are L = 2 . 25 m , B 1 = 7 m , B 2 = 13 m , X 1 = 2 . 5 m , X 2 = 4 m (see Fig. 1a). People are then asked to walk casually througho ut the area, with a specific region-dependen t sp eed. Sample snapshots of people walking in the outdoo r and indo or areas are shown in Fig. 4 T rue speeds ( v 1 , v 2 ) Estimated speeds ( b v 1 , b v 2 ) (0.8, 0.8) (0.9, 0.9) (0.8, 0.3) (1, 0.5) (0.8, 1.6) (0.9, 1.6) (0.3, 0.8) (0.5, 0.9) (0.3, 0.3) (0.5, 0.3) (0.3, 1.6) (0.4, 1.9) (1.6, 0.8) (1.9, 0.7) (1.6, 0.3) (1.7, 0.4) (1.6, 1.6) (1.9, 2.1) T ABLE 2: A s a mple performance of our speed estimat ion approach for Region 1 ( v 1 ) and Region 2 ( v 2 ) of the indoor are a of Fi g. 5 and the c ase of N = 9 people. and Fig. 5 respectively . W e have conducted sev eral experiments in these areas with different n u mber of p eople walking at a variety of speeds. More specifically , we test the proposed methodo logy with 9 poss ib le co mbinations o f speeds for ( v 1 , v 2 ) for the two adjacent regions. For each p air of speeds, we th en run a num ber of experiments with bo th 5 and 9 peo ple walking in the area. For any given speed, people are instructed o n how to walk with that specific sp eed as discu ssed in Section 4.1. T able 1 s hows a s ample performance of our approach when 5 people are walking in the outdoor area and for all th e 9 speed combinations, while T able 2 Speed v 1 v 2 v 1 or v 2 NMSE 0.11 0.24 0.18 T ABLE 3: NMSE of the estima tion of speeds in each region as wel l as the overall NMSE of the speeds in any of the two regions. NMSE Scenario v 1 v 2 v 1 or v 2 Outdoor 0.09 0.16 0.12 Indoor 0.14 0.33 0.23 T ABLE 4: NMSE of speed es t imati on for both indoor and outdoor . NMSE Number of people v 1 v 2 v 1 or v 2 N=5 0.06 0.20 0.13 N=9 0.16 0.29 0.23 T ABLE 5: NMSE of speed es t imati on based on the total number of people walking in the area. Fig. 5: The indoor area of i nt erest wit h two s na pshots of people walking in t he area. The black l ine separates the area i nt o two regions. People mov e casually throughout the area with the given region-specific spee d. A pair of WiFi links locate d in Region 1 makes wireless measurements t o est imate t he s pe e d of people in both regions. shows a sample perf ormance wh en 9 people are w alking in the indoor area. It can be s een that our proposed methodo logy can estimate the sp eed s of people in the adjacent regions with a good accuracy , for both indo o r and outdoor cases, by using a pair of W iFi lin ks located in on ly one region. T o further validate our frame work statistically , we repeat each speed pair 3 times, o n differe nt days , for both cases of 5 and 9 p eople w alking in the ar ea. This amoun ts to 108 overall sets of experiments. T o e valuate the performance, we calculate the NMSE. T able 3 sh ows the overall NMSE of the estim atio n error for speed of Region 1 as 0.11, for speed o f R egion 2 as 0 .24, and for the s p eed in any of the two regions as 0.18 , confirmin g a goo d performance. Fig. 6 further shows the Cumulative Distrib ution Function (CDF) of the No rmalized Square Error (NSE) for the speed of Region 1, Region 2 , and the s p eed in any region. It can be s een that the NSE is less than 0 . 15 , 9 0% of the time for v 1 and 70% o f the time for v 2 , further confirmin g a good performance. W e note that th e estimation of v 1 , i.e., the speed of the region where the link s are located, is more accurate as comp ared to v 2 . W e further note th at the con vergence tim e of the presented speed estimation results is typically within a cou ple of minutes, with sev eral cases (tho se with higher s peeds) con verging in m uch less than a minu te. 4.3.1 Speed Clas sification P erf or mance Thus far , we h av e established that our approach can successfully estimate the region-dependen t speeds of peo p le walking in two adjacent re gions , based on W iFi RSSI m easurements in o nly o ne region. Howe ver , for some application s, an exact speed estimation may no t be necessary . Rather, a classification of the pace to low , n o rmal walking, or high may suffice. Therefore, we next show the classification performance of the p roposed appro ach to Low ( 0 . 3 m/s ), Norm al walking ( 0 . 8 m/s ), or High ( 1 . 6 m/s ) speeds. More specifically , we classify th e estimated speed b v i using Classification accuracy (in %) Experiment scenario v 1 v 2 v 1 or v 2 Outdoor N=5 people 100 81.4 90.7 Outdoor N=9 people 88.9 77.8 83.4 Indoor N=5 people 100 66.7 83.3 Indoor N=9 people 92.6 74.1 83.3 All experime nts 95.4 75 85.2 T ABLE 6: Performance of s pe e d cl assificat ion to High, Normal W alking, and Low for indoor and outdoor c ases, and for different number of pedestrians. nearest n eig hbor classifier as Low if b v i ≤ 0 . 55 m/s , No rmal if 0 . 55 m/ s < b v i ≤ 1 . 2 m/ s , an d Hig h if b v i > 1 . 2 m/ s , fo r i ∈ { 1 , 2 } . T able 6 shows the accuracy of o ur classification for both indoo r and outdo or cases and for dif ferent n umber of p eople. It can b e seen that th e overall classification accuracy of the speeds in eith er of the two regions is 85 . 2% over all th e experiments, confirming a good p erformance. For compariso n , we note that the probability of correct classification w ould have b een 33% in any of the two regions for a random classifier . 4.3.2 Underlying T rends of Speed Es timation W e next discuss som e of the underlying characteristics of the results, starting with the imp act of the experiment location . T able 4 an d Fig. 7 show the NMSE of the estimation error and the CDF of the normalized square error respectively , based on all the experiments in each location. While the estimation err or in the indoor environment is still s m all, th e estimatio n error is less in the Fig. 6: CDF of the normaliz e d square error for speeds in Region 1 ( v 1 ), Region 2 ( v 2 ), and for the speeds i n any region. It ca n be seen t hat our approach e stimate s the speeds with a good accuracy . Fig. 7: CDF of t he normalized square error based on t he location of the experiment. It can be seen that t he outdoor location has a slightly better performance than indoor , as expected. Fig. 8: CDF of the normaliz e d square error based on the t otal number of people. It c an be seen t hat the estima tion error slightly increases for 9 people as compared to t he case of N = 5 . Fig. 9: Effect of the assumed value of θ max on the Normalized Mean Square Error of the esti mated spe e ds in the two regions. It ca n be seen t hat NMSE is low for a broad range of θ max , whic h sho ws that it is not that sensit iv e to t he exact choice of θ max . outdoor environment as expected, due to the smaller am o unt of multipath. Furthermore, T able 5 and Fig. 8 show th e p erformance as a function of the to tal nu mber of pedes trians . It can be seen that the estimation error is sligh tly higher for N = 9 people as compared to N = 5 . 4.3.3 Sensitivi ty to θ max As described in Section 3, we assu m e θ max = 45 ◦ in ou r models of the closed area, which characterizes the flow of peop le in hallway- type scenarios. W e next sh ow the sensitivity o f our resu lts to the assumed value of θ max . More specifically , we assume a broad range of values for θ max to characterize th e flow of peop le in our experiments an d estimate the sp eeds of people accordin gly . Fig. 9 sho ws the NMSE of the estimated speeds in the two re gions as a function of the assumed value of θ max . It can be seen that the estimation error is nearly constant over a broad range of θ max , which shows th at o ur approach is robust and not th at sensitive to the exact choice of θ max . 4.4 Museum Experiments So fa r , we presented our experimental results for se veral cases in which people are walking with a variety of speeds in two adjacent regions o f an area. W e next con sider a m useum-type scenario, in which there are tw o adjacent exhibition s, s howcasing two very diff erent types of displays. W e th en u tilize our methodolo gy to estimate the visitor speeds in bo th exhibits, and d educe which Fig. 10: Our museum whic h contains two exhibits – (a) a sam ple display in the exhibit of Region 1, which contains non-engaging ite ms, (b) a sample displ ay in the exhibit of Region 2, which conta i ns more engaging displays such as “Where is W al do?” , and (c) a snapshot of the visitors exploring the museum. exhibit is more pop ular . By more p opular, we mean th at the exhibit receiv ed mo re attentio n, i.e., peo p le slowed d own to spend more time there. For the purpos e of th is experiment, we s tage an exhibition with two typ es of exhibits in two adjacent regions. W e place basic visually-bo ring disp lays on th e walls of Region 1, such as basic pictures, list of alphab ets, and list o f numbers. In Region 2, on the other hand, we place more visually -in volved displays such as “Where is W aldo” p ictures [32]. Fig. 1 0 (a) and (b) show a sample display in Region 1 and Region 2 respective ly . W e use the indo or experiment site sh own in Fig . 5 for this experiment. W e then in vite 10 peop le (randomly selected from our advertisement) to visit this museum. The visitors d o n ot ha ve any background about our experiments. Upon arri val, they are told to explore the area that cons ists of the two exhibits as it interests them. Note that we do not ask people to walk at a particular speed in a giv en region, as we did in th e validation experiments. Fig . 1 0 (c) sh ows a snapshot of the museum with p eople exploring the exhibits. W e use the same Tx/Rx locations in Region 1 of Fig. 5 Fig. 11: Ou r estimat es of the speeds in the two ex hibits of the mu seum experiment of Fig. 10. The speed i n the Exhibit of Region 2, whic h contai ns the W a ldo pictures, is est imated as 0 . 3 m/s , indicati ng a significa nt slow do wn, whil e the speed in Region 1 is estimat ed a s 1 m/s , which i s a normal walking speed. The re sults further indicate that the exhibit of Region 2 was more engaging and popular . and collect the data for 5 minutes. In this settin g, we observe that people stop at a disp lay that interests them b efore m oving on to explore other displays . The experiment is video taped in b oth regions an d the ground -truth aver age s peeds of people in Region 1 an d Region 2 are visually estim ated as 1 . 1 m/s an d 0 . 12 m/ s , respecti vely , by e xtracting the tim e spent by ea ch p erson in the two regions from the video. W e th en use our proposed approach to estimate the a verage s p eeds in the two regions o f the m useum. Fig. 11 sho ws the estim ated a verage speeds in the two regions as a function of time. It can b e seen that the speed of peo ple in the Exhibit o f Re gion 2, which contain s the W aldo pictures, is estimated as 0 . 3 m/ s , ind icating a significant slow down, while the s p eed in th e Exhibit of Region 1 is estim ated as 1 m/ s , which is a normal walking speed. It can be seen that these estimates are consistent with the ground -truth an d wh at on e would expect based on th e level of engagement of the d isplays. The estimates further indicate th at Exhibit 2 was more en gaging and popular sin ce it was estimated th at peo p le significantly slowed down there. This shows th e potential of the proposed m ethodolog y for estim ating the leve l of popu larity of ad jacent displays, bas ed on only sensing and measurement in one o f the regions. 4.5 Costco Experiments In this section, we use our frame work to estimate the m o tion behavior of the buyers in an aisle of a retail sto re, Cos tco [26]. Since p eople constantly come an d go through th e aisle, this will be an example of th e open area scenario of Fig. 1b. Since the aisle th at we were assigned by the sto re for our experiments only contained one kin d of products, we then estimate the rate of arriv al of peop le into th e aisle, and the sp eed at which people walk while they are exploring the aisle (using the same frame work), thu s assessing the popularity o f the products in the aisle. Fig. 12 shows the aisle of in terest in o ur lo cal Costco. Th is aisle co ntains a specific type of merchandise, snacks and cookies in this case. Bo th ends of the aisle are open and peop le can enter/exit from either end of the aisle. Since the aisle co n tains the same type o f p roducts, we take the entire aisle as a single region (i.e., v 1 = v 2 ), but assume the rate of arriv al (or eq uiv alently N avg ) to be unkn own as well. It is expected that people walk at a slow pace if th e prod ucts in the aisle g en erate interest and they consid er Fig. 12: The Costco e xperiment – (a) sho ws the considered “snacks and cookies” ai sle in Costco, whil e (b) and (c ) show a pair of our WiFi nodes positioned a long the aisle to ma ke wirele ss meas ureme nts. 0 200 400 600 800 Time in seconds 0 0.02 0.04 0.06 0.08 0.1 Estimate of the rate of arrival (people/second) True rate = 0.016 Fig. 13: The est imate of the ra te of arriv al of people i nto the aisle of Fig. 12 at Costco, as a function of time. It can be seen that our framewor k c orrectly estimat es the rate of arriv al. buying them. W e are thus interested in estimating such b ehaviors. A pair of W iFi links are located along the aisle, as indicated in Fig. 1 2, and make wireless measu rements as peop le walk throu gh the aisle. W e then use our approach of Section 3 to estimate the speed of people in th e aisle as well as their rate of arri val into the aisle. Since the probab ility of crossing link i , p c,i = λδ t, for i ∈ { 1 , 2 } , the rate o f arri val λ is estim ated as b λ = p c, 1 + p c, 2 2 δt . In order to es tim ate the speed o f people walking in the aisle, we further use the cross-correlation between the two WiFi links giv en b y Eq. (19). W e then collect wireless R SSI measurements for 15 minu tes as people walk throug h the aisle shown in Fig. 12. W e manually record the times at which people arrive from either entrance o f the aisle and com pute th e true rate o f arri val. Fig. 13 shows the estimated rate of arri val as a function of time. It can be seen that our framew ork accurately estimates the rate of arri val of people into the aisle using a p air of W iFi links. Note that the rate of arriv al on that particular day/tim e was 1 person per minute. Thus, ou r estimation con verges relatively f ast, within 4 00 seconds, which is the time 6 peop le visited the aisle. Furthermore, the a verage ground-truth speed of people w alking in that aisle is estimated as 0 . 48 m/s , by manually recording the entrance and exit times of peo ple in that aisle o n 4 d if ferent days. The av erage sp eed of people walking in the aisle is estim ated as 0 . 2 m/s using our framework, which is con sistent with the grou nd-truth, and indicates a significant slow d own, sh owcasing th e popularity of the aisle. 5 C O N C L U S I O N In th is paper , we proposed a framew ork to estimate th e average speeds o f pedestrians in two adjacent regions, b y using RSSI measurements of a pair of WiFi lin ks in only one region. Our approach only relies on WiFi sig nal a vailability in the region where the links are located. Thus , it not o nly allows for estimating the speed o f a crowd in the imm ediate region where the p air of links are, but also enables deducing the speed of the cro wd in the adjacent WiFi-fr ee regions. More specifically , we s howed how two key statistics, th e probability of crossing and the cross- correlation between the two links, carry key information about the p edestrian sp eeds in the two regions and mathematically characterized them as a function o f the speeds. T o v alidate o ur frame work, we ran extensiv e experiments (total of 1 08) in indo or and outdoor locations with up to 1 0 p eople, with a variety of speeds per region, an d showed that o ur approach can accurately estimate the speeds of pedestrians in both regions. Fu rth ermo re, we tested our m ethodolog y in a m useum setting, with two different exhibitions in ad jacent areas, and estim ated the average pedestrian speeds in bo th exhibits, thus deducing which exhibit was more popular . Fin ally , we u sed our frame work in Costco, estimated the motion behavior of buyers in an ais le, and deduced th e popularity of the produ cts located in that aisle. R E F E R E N C E S [1] M. Fran ˇ ek, “Environ menta l factors i nfluencing pedestrian walking speed, ” P erceptual and motor sk ills , vol. 116, no. 3, pp. 992–1019 , 2013. [2] J. N. LaPlante and T . P . Kae s e r , “The conti nuing ev olution of pedestrian walking speed assumptions, ” Institute of T ransportation Enginee rs. ITE Jou rnal , vol. 74, no. 9, p. 32, 2004. [3] P . Li u, S.-K. Nguang, and A. Partridge, “Occupancy inference usi ng pyro ele ctric i nfrared sensors through hidden marko v models, ” IEEE Sensors Journal , vol. 16, no. 4, pp. 1062–106 8, 2016. [4] J. Y ang, M. Santa m ouris, and S. E. Lee , “ Rev iew of occupancy sensing systems and occupancy modeling methodologies for the application in instituti onal buildings, ” E nerg y and Buildings , pp. 344–349, 2016. [5] B . Y ang, J. Luo, and Q. Liu, “ A novel l o w-cost and small-siz e human tracking system wit h p yroelectric infrared se nsor mesh network, ” In- frar ed Physics & T echnolo gy , vol. 63, pp. 147–156, 2014. [6] J. Y un a nd S.-S. Lee, “Human movement detecti on and identifica tion using pyroelectric infrared sensors, ” Sensors , v ol. 14, no. 5, pp. 8057– 8081, 2014. [7] S. D. Khan, “ Estimat ing speeds and directions of pedestrians in real -time videos: A solution to road-safety problem. ” [8] P . Sourtzinos, D. Makris, and P . Remagnino, “Highly ac c urate est imation of pedestrian speed profiles from video sequences, ” in Innovations in Defence Support Systems–3 . Springer , 2011, pp. 71–81. [9] G. W ang, J. L i, P . Zhang, X. Zhang, and H. Song, “Pedestrian speed estimat ion based on direc t linear tra nsformation c alibration, ” in Audio, Langua ge and Image Processing (ICALIP), 2014 International Confer- ence on . IEEE , 2014, pp. 195–199. [10] M. H. Dridi, “Tracking indi vidual targets in high density cro wd scenes analysis of a video recording in hajj 2009, ” arXiv preprint arXiv:1407.2044 , 2014. [11] New CSC Research Reveals Where Shoppers and Reta il- ers Stand on Next Generation In-store T echnology , 2015, https://t urtl.dxc.technology/story/55ee93d8bbfd077 f2d4e22ee.pdf? [12] New study: consumers ov erwhelmingly re j ect in-store t racking by retaile rs, 2014 , www .opinionlab.com/ne wsmedia/new-study-consumers- ov erwhelmingly-rejec t-in-store-tracking-by-retaile rs. [13] Smile this Blac k Friday , you might well be on ca m era!, 2015, https://nakedsecurity .sophos.com/2015/11/24/smile-this-blac k-friday- you-might-well-be-on-camera/. [14] S. Depa t la, A. Murali dharan, and Y . Mostofi, “Occ upancy estima t ion using only WiFi power measurements, ” IEEE Journal on Selec ted Areas in Communications , vol. 33, no. 7, pp. 1381–139 3, 2015. [15] S. Depatla and Y . Mostofi, “Crowd Counting Through W alls Using W iFi, ” to appear in IEEE Inter nati onal Conference on P ervasive Com- puting and Communications , 2018. [16] W . Xi, J. Zhao, X.-Y . Li, K. Zhao, S. T ang, X. Li u, and Z . Jiang, “Elect ronic frog eye: Counting crowd using wifi, ” in IEEE INFOCOM 2014-IEEE Confer ence on Computer Communications . IEEE, 2014, pp. 361–369 . [17] C. Xu, B. Firner, R. S. Moore, Y . Zhang, W . Trappe, R. Howard , F . Zhang, and N. An, “SCPL: indoor device-free multi-subjec t counting and localiza tion using radio signal strength, ” in Information Pro cessi ng in Sensor Networks (IPSN), 2013 ACM/IEEE International Conference on . IEEE, 2013, pp. 79–90. [18] D. W u, D. Zhang, C. Xu, Y . W ang, and H. W ang, “Wi Dir: walking direc- tion estimat ion using wi reless s i gnals, ” in Pr oceedings of the 2016 ACM International Joint Conference on P ervasive and Ubiquitous Computing . A CM, 2016, pp. 351–362. [19] Z.-P . Jiang, W . Xi, X. Li, S. T ang, J.-Z. Zhao, J.-S. Han, K. Zhao, Z. W ang, and B. Xiao, “Communicati ng is crowdsourcing: Wi-Fi indoor localiz ation with CSI-b ased speed esti mation, ” Jo urnal of Computer Science and T echnolog y , vol. 29, no. 4, pp. 589–604, 2014. [20] C. R. Karanam and Y . Mostofi, “3D t hrough-w all imaging with unmanned aeri al vehicle s usi ng WiFi, ” in Proceedings of t he 16th AC M/IEE E International Conference on Information Processing in Sen- sor Networks . A CM, 2017, pp. 131–142. [21] Attention, Shopper s: Stor e Is T racking Y our Cell , 2013, http://www .nytimes.com/2013/07/15/business/attenti on- shopper- stores- are- tra c king- you r - c e l l . h t m l . [22] S. Sigg, U. Blanke, a nd G. Tr ¨ oster , “The t elepathic phone: Fricti onless activity recognition from WiFi-RSSI, ” in P erv asive Computing and Communications (P e rCom), 201 4 IEEE International Con ference on . IEEE, 2014, pp. 148–155. [23] S. Shi, S. Si gg, W . Zhao, a nd Y . Ji, “ Monitoring att ention using ambient FM radio signals, ” IEEE P ervasive Computing , vol. 13, pp. 30–36, 2014. [24] M. Bocca, O. Kaltiokalli o, N. Patwari, and S. V enkatasubramanian, “Multiple target t racking with RF s e nsor networks, ” IEEE T ransactions on Mobile Computing , vol. 13, no. 8, pp. 1787–1800, 2014. [25] D. Zhang, Y . Liu, X. Guo, and L. M. Ni, “RASS: A real -time, accurate , and scalable system for tracking transce iver-fr ee objects, ” IEEE T ransac- tions on P arallel and Dist ributed Systems , vol. 24, no. 5, pp. 996–1008, 2013. [26] S. Depa t la a nd Y . Mostofi, “Title withhel d to prese rve anonymity of the submission, ” 2018. [27] U. W ei dmann, U. Kirsch, and M. Schreckenberg, P edestrian and evacu- ation dynamics 2012 . Springer Science & Business, 2014. [28] C. D. Meyer , Matrix analysis and applied li near algebra . Siam, 2000. [29] C.D.Meyer , “Stochastic complementation, uncoupling mark ov chains, and the t heory of nearly reducible syst e ms, ” SIAM re view , vol. 31, no. 2, pp. 240–272, 1989. [30] G. Rubino a nd B. Sericola, Markov chains and dependability theory . Cambridge Univ ersity Press, 2014. [31] J. D. L ittle , “Or forumlittl e’ s law as viewed on it s 50th anniv ersary , ” Operations resear ch , vol. 59, no. 3, pp. 536–549, 2011. [32] Where i s Waldo, 2015, http:/ / whereswaldo.com/index.html. Saandeep Depatla received the B.S. degree in electronics and communication engineering from the National Institut e of T echnology , War an- gal, in 2010 and the M .S. degree in electrical and computer science engineering (E CE) from the Univ ersity of California, Santa Barbara (UCSB), in 2014. F rom 2010 to 2012, he worked on de- v eloping antennas fo r radars in el ectronics and radar dev elopment est ablishment, I ndi a. Since 2013, he has been working t ow ards the Ph.D . degree in ECE at UCSB. His research int erests include ambient sensing using wireless signals, signal processing, and wireless communications. His research on RF sensing has appeared in sev eral popular news ven ues such as Engadget and Huffington Post among ot hers. Y asamin Mostofi received t he B.S. degree in electrical engineering f rom Sharif University of T echnology , and t he M. S. and Ph.D . degrees from Stanf ord Univ ersity . She is currently a profes sor in the Depar tm ent of Elec tr ical and Computer Engineering at the Univ ersity of Cal- ifornia Santa Barbara. Y asamin is the recipi- ent of the 2016 Antonio Ruber ti Prize from the IEEE Control Systems Society , the Presiden- tial Early Career A ward for Scientists and Engi- neers (PECASE), the National Science Founda- tion (NSF) CAREER award, and the I EEE 2012 Outstanding Engineer A ward of Region 6 (more t han 10 Western U.S . states), among other aw ards. Her research is at the int ersection of communications and robotics, on m obile sensor networks. Current research thrusts include X- ra y vision for robots, RF sensing, communication-aware robotics, occu- pancy estimation, see-through imaging, and human-robot networks. Her research has appeared in sev eral reputable news ven ues such as BBC , Huffington P ost, Daily Mail, Engadget, T echCr unch, NSF Science360, A CM News, and I EEE Spectrum , among others.
Original Paper
Loading high-quality paper...
Comments & Academic Discussion
Loading comments...
Leave a Comment