An Analysis of Two Common Reference Points for EEGs
Clinical electroencephalographic (EEG) data varies significantly depending on a number of operational conditions (e.g., the type and placement of electrodes, the type of electrical grounding used). This investigation explores the statistical differen…
Authors: Silvia Lopez, Aaron Gross, Scott Yang
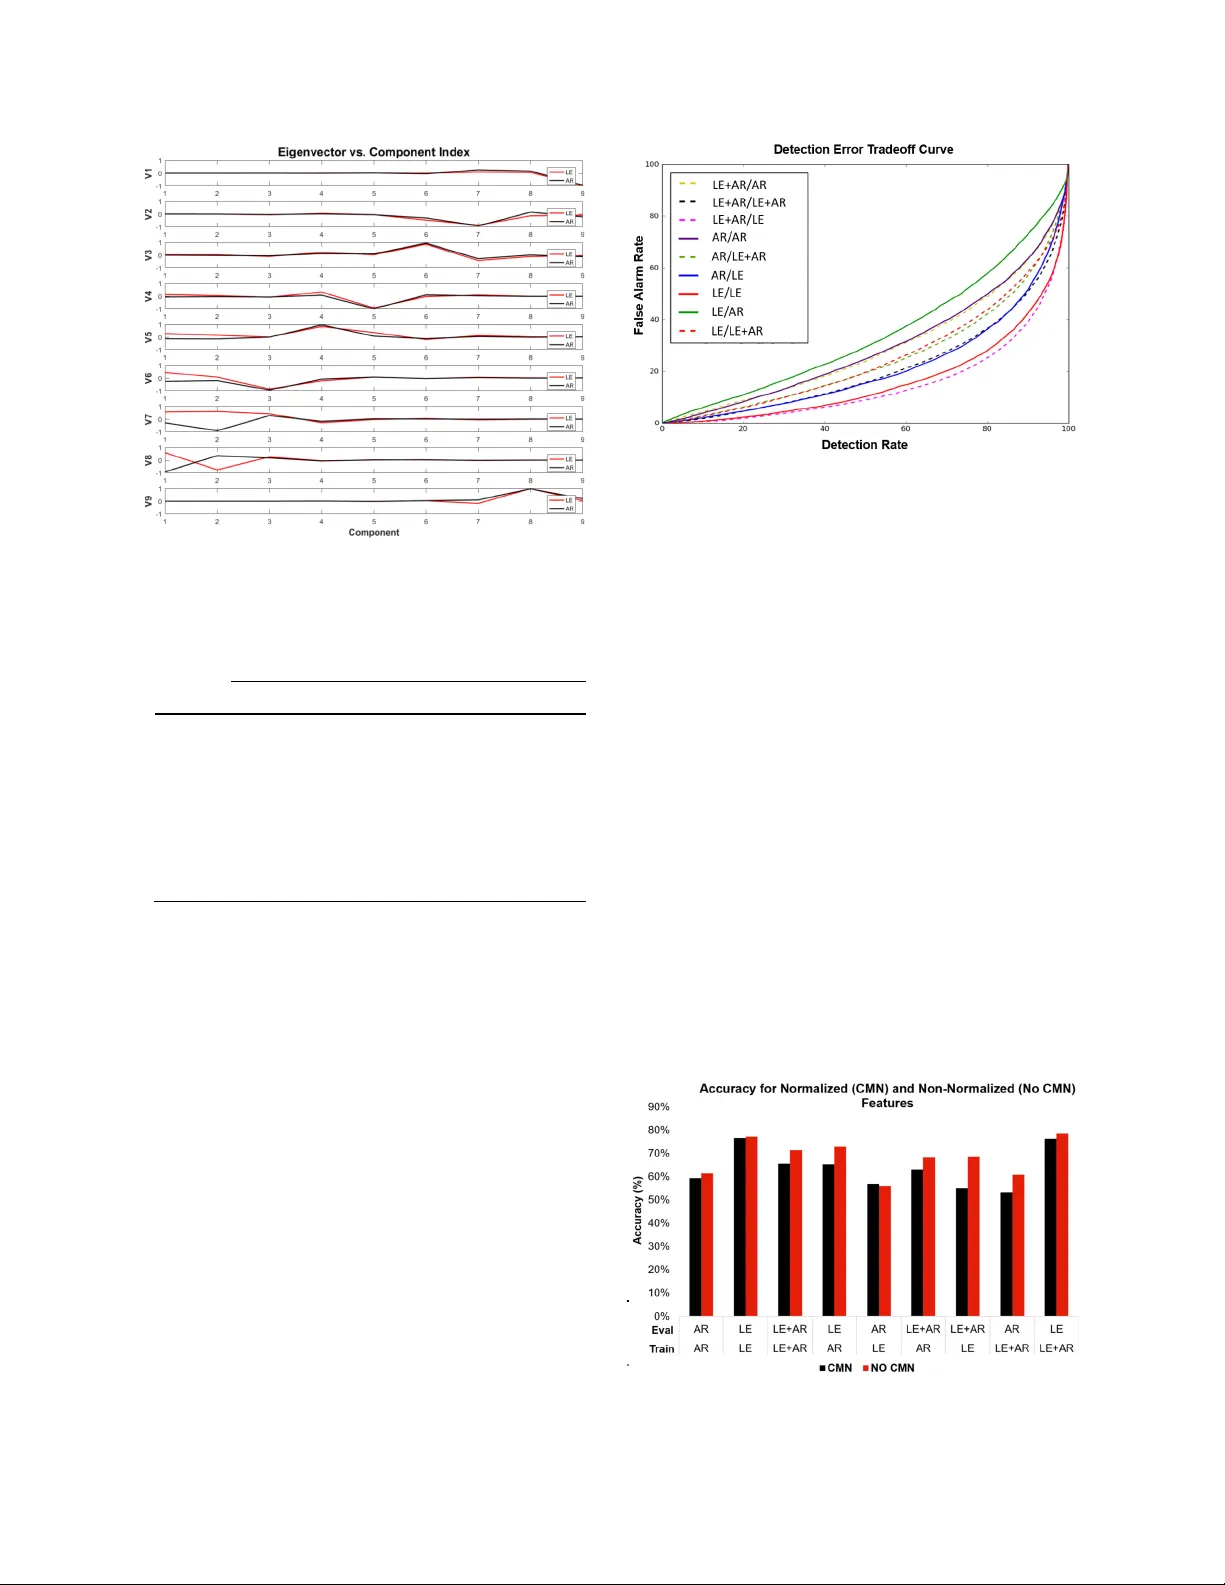
AN ANALYSIS OF TWO COMMON REFERENCE POINTS FOR EEGS S. López, A. Gross, S. Yang, M. Golmohammadi, I. Obeid and J. Picone Neural Engi neeri ng Dat a Conso rtiu m, Templ e Uni versi ty, P hilad elphi a, Pe nnsylv ania, USA { silvia.lopez, aaron.gross, scott.y ang, meysa m, obeid, picone}@temple.edu Abstract — Clinical e lectroencephalo graphic (E EG) da ta varies significantly depending on a number of operational conditions (e.g., the type and placement of electrodes , the type of electrical grounding used). This inve stigation explores the statistical differences p resent in two different referential montages: L inked Ear (LE) and Averaged Reference (AR ) . Each of these accounts for approximately 45% of the data in the TUH EEG Corpus. In this study, we explore the impact this variability has on machine learning performance. W e compare the statistical properties of features generated using th ese two m ontages, and explore the impact of performance on our standard Hidde n Markov Model (HMM) based classification system. We show that a system trained on LE data significantly outperforms one trained only on AR data ( 77. 2% vs. 61.4% ) . We a lso demonstrate that performance of a system trained on both data sets is somewhat compromised (71.4% vs. 77.2% ). A statistical analysis of the data s uggests that mean, v ariance and channel normalization should be considered . However, cepstral mean subtraction failed to produce an improvem ent in performance, suggesting that the impact of the se statistical differences is subtler . I. I NTRODUCTION Diagnos is of c linical conditions such as epilepsy are dependent on e lectroe ncephalo graphy (EEG), the recording of the brain’s electrical activity through electrodes placed on the scalp, as shown in Figure 1. D elivering a conclusive diagnosis without an EEG i s often unfeasibl e [1] . The key role played by this technique in the dia gnosis o f several neurologica l conditions coupled w ith the large amounts of tim e required by specialized neurologists to interpr et these records, h as created a workflo w bottle neck – neurologists are overwhelmed with the amount of data that needs to be manually reviewed [2] . The re is a great need f or partial or complete automation of the EEG anal ysis process , a nd automated technology is slowly emerging to fill this void [3] , [4] . The need for this data to be m anually reviewed in real - time for clinical reasons further exacerbates the nee d for automatic interpret ation technology. Research has specifical ly focused on the task of ictal (seizure) EEG detection or identification. In [3] , for instance, h idden Markov m odels (HM M s ) are trained to recognize the ictal, interictal and postictal stag es of the brain. The research presente d in [5 ] , on the oth er h and, describes a system that uses a wavelet - based sparse functional linear model with a 1 - NN classi fier for the classification of ictal E EGs. The same task was accomplished i n [4] through the implem entation of a Support Vector Machine (SVM) classifier . All these studies achieve d detecti on accuraci es in the range of 89% to 100% , eve n though clin ical performa nce of commercial technology based on these approaches is significantly lacking [6][7] . F ew studies , how ever, have addressed an important problem inherent to clin ical record ings: the im mense variability. All seizure de tection studies previously cited limit the training and evaluation of their models to one or two h omogen eous d atabases. The large var iabili ty among EEG channels and montages utilized in clinical E EGs is not usually taken in to account for the gene ra tion and evaluation of the models. For ex ample, in the TUH EE G Corpus [8] , which is th e basis fo r this stud y, there a re over 40 different channel configurat ions and at least 4 different types of refer ence points used in the EEGs administered. It is unclear that whether this data can be modele d by a s ingle stat isti cal mod el, or wheth er spe cial measur es must be taken to account for this vari abili ty. Research fields such as speech recogniti on have dealt with thi s probl em for many yea rs using techno logies suc h as speaker and chan nel adap tation [9] , but th ese technolog ies have yet to be explor ed in EEG research. The informati on yielded by an EEG channel is essentia lly the difference of electric al activity bet ween t wo electrodes. In Figure 1 , we show a typical EEG electrode pattern that includes common elect rical refe rence points. Because changes in the electrode locations on the s calp ! Figur e 1 . Thr ee com mo n ref er e ntia l monta ges ar e sho wn: a) th e Common Vert ex Reference (C z ) , b ) th e Linked Ears Refere nce (LE ) and c ) th e Av erage Reference (AR ) . present different elect rical activity, the reference point used to measure a voltage has a significant impact on the nature of the voltage observed. In fact, since the conduction of these electrical signals through the brai n is a highly nonlinear and noisy process, grounding plays a very important role i n the qualit y of the observed signal s. A diffe renti al view of the data, known as a montage, which c onsist s of di ffer encin g the s ignal s coll ected from two electrode s (e.g., Fp1 - F7), is very common . In fact, neurologists are very parti cular about the type of montage use d whe n interp reti ng an EEG. At Temple Univer sity Hospit al (TU H) , for example, a Temporal Central Parasagitt al (TCP) mont age [10] is very popu lar. Of course , one might think th at th is pro blem is of little importanc e since most EEG analysis is done using differential voltages (e .g. Fp 1 - F7 ). In th eory, the effects of a reference point would be cancelled vi a subtract ion of two channels with th e s ame reference point. In prac tice, the lo cation of the reference point changes the nature of the wav eforms c onsiderabl y because the brain and scalp conduction paths are highly nonl inear [11] . The American Clinica l Neuroph ysiol ogy Socie ty (ACNS) reco gnizes that there is a grea t variety of montage s among EEG laboratories. Even though the ACNS has proposed guidel ines for a minimum se t of montage s [10] , several reference sites a re still used depending on the purpose of the EEG recording [8] . Some commonly used reference schemes include : • Common Vertex Reference (C z ) : uses an electrode in the middle of th e head ; • Linked Ears Reference (A1+A2, LE, RE) : based on the assumption that sites like the ears and mastoid bone lack electrical activity , often implem ented using only one ear; • The Average Reference (AR) : uses the average of a finite number of electrodes as a reference . The robustness of a state of the art machine learnin g system that deco des EEG signals depends highly on the ability of the system to maintain its performa nce wit h different variations of the data. The specific montage of a recording could potent ially affect the operation of such systems in a negative way , wh ich constitutes a fundamental proble m, given the fact that EEG signals tend t o present high varia bility in cli nical setting s [8] . This investi gation will explor e the statistic al variation s and effects that are produced b y two different referential montage s obs erved in t he T UH EEG Corpus [8] , L E and AR , on a machine learning system based on HMM s [12] . II. E XPERIMENTAL D ESIGN T he TUH EEG Corpus Error! Referenc e source not found. is the largest, publicly availabl e sour ce of clinical data in the world. The referencin g systems that are compared in this study are the ones that predominate in t his corpus: Linked Ears Referenc e (LE) and Averaged Referenc e ( AR ) and ( 43.8% and 46.5% of the data respectively ). The large amounts of data available in TUH EEG ( approximately 16,500 files each ), was the main moti vatio n for the sele ction of the se particular referential systems . The study of t he two referential systems was divi ded in to three types of analys es : (1) simple descriptive statistic s , (2) analysis of variance using Principal Component Analys is (PCA) [13] and (3) a comparison of the performance obtained from our standard HMM baseline system t hat uses models tra ined separately for each class . F eature ex traction for EEG signals was performed using a standard approach described in [12] and shown in Figure 2. T he frame and window durations for feature extraction are 0.1 and 0. 2 seconds respectivel y . The base features were used in a calculation that produced their first an d second d erivatives. It is important to no te that the second derivative was not calculated for the differential energy fe ature , be cause it was p roven to be redundant in prev ious studies [12] . T he final feature vector that was used as a n input for the experiments had a dimension of 26, with 9 of those features being the base , or absolute, features , and the rest being de rivatives of the original features . The number of features used was varie d depending on the experiment . In some experiments , only absolute features (9 features) were used because these are more appropria te for studying basic statistica l p roperties since they map directly to spectral chara cteristics of the signal. The descri ptive sta tisti cs of the dat a were calc ulated through a simple com putation of the mean and va riance for each class ( LE and AR ). The global mean and variance for a ll the data w ere also ca lculated in o rder to determine the significance and direction of the bias. For this particular part of t he study , 16, 840 LE fil es and 17,858 AR files were used, meani ng that 48.5% of the data were reference d to LE whil e 51. 5% of the da ta was referenced to AR . Note that for thi s part of th e study, only ! Figur e 2 . Bas e fea tur es c al cula ted thro ug h a c epst ra l coe ff i ci ent - based appr oa ch that uses fra me and window dura t ions of 0. 1 and 0. 2 sec onds re s pecti vel y. the base fea tures were us ed. Following the descripti ve stati stical ana lysis, a PCA was p erformed on the features. The 9 - dimensional mean vector, µ , and covariance matrix S of the data were computed, which was followed by the calculation of the eigen values and vectors of the covariance matr ix. The eigenvalues and ei genvectors we re th en an alyzed and compared to the comparable eigen vector in the opposite class. This was done to assess the importance of each component in the overall weighting of t he feature vector . A machine lear ning system was used to evaluat e the mismat ch betwee n featur e vector s from each class. This baseline system was a traditional HMM system described in [12] . This specific s ystem, howeve r, was trained to detect two different types of events: (1) seizures (SEIZ), and (2) b ackground (BCKG). To assess the mismatch between feature vectors, we tra ined statistical mod els with only LE features (LE model) , o nly AR features ( AR model) and the combin ation of both types of features combined ( LE+AR model ). The models were evalu ated in similarly divided evaluation sets (LE data o nly, AR data only and LE+AR data) . The traini ng sets were comprised of 4 4 EEG records for each class ( LE and AR ) and the evaluation set had 10 EEG records per class. All of the record s in both th e trainin g and evalu ation s ets came from unique patients , which implies that 108 patients were r epresented in t he total dat aset. Speech recogniti on systems have been generally successful in mitiga ting the influence of chann el variations . Feature normalization technique s , such as Cepstra l Mean Normalizat ion (CM N) [14] , are well - established techniques that enhance the robustness of these systems . We also report on a pilot ex periment using CMS to of fset any bi ases be tween mon tages. III. R ESULTS AND D IS CUSSION D escriptive stati stics were calculated for bot h cla sses pe r feature type as an initial analysis . Tabl e 1 presents a summary of the findings . The se statistics demonstrate that there is a grea t v ariation in the m eans and v ariances for each base feature, indicating that the characteristics that describe these two sets are very different in the frequency dom ain. We also examine d indivi dual channels and o bserved a comparable amount of variati on. PCA analysis provides a more complete analysis of the differences between montag es. The percent variance explained by each eigenvalue is presented in Figure 4 for each of the montages . Figure 6 c ompares the eigenvectors . W e observe that the first PCA component explains a m uch higher portion of the variance for the LE data than for t he AR data. This analys is was supported i n Figure 6 . The eigenvectors show similar behavior in the energy features and the lower cepstral coefficients. T he lower order e igenv ectors, which correspond to large eigenvalues, weight the higher cepstral coefficients more heavily. These features, whose eigenvector s show opposite polarity, correspond to beta waves (13 Hz – 30 Hz) freq uently present in normal recordings. The recogniti on experiments on seizure detection w ere much more revea ling. A Detec tion Error Tra deoff (DET) curve fo r each of the se exp eriments is presented in Figure 7 while t he detection rate is summarized i n Tabl e 2 . Be st performance is obtained by training on the entire dataset (LE+AR) and evalua ting only on LE. However, the performance of this model on the AR data set is degraded, causing the overall performance on the combined data to suffer. The AR model is the one with the least amount of variability when tested on dif ferent evaluat ion sets. The resul ts pres ented i n Train/Eval LE AR LE+AR LE 77.19% 72.89% 78.52% AR 55.92% 61.41% 60.89% LE+AR 68.60% 68.25% 71.40% Table 2 support the fact that the three models, AR , LE and LE+AR are fundam entally different. The bias between th e montages that can be s een in Feat ure Mean Varia nce LE AR LE AR Ef 1.685 12.390 49.560 19.368 c1 2.296 1.949 0.891 1.171 c2 0.991 0.677 0.510 0.675 c3 0.320 0.296 0.166 0.250 c4 - 0. 060 - 0. 009 0.107 0.128 c5 - 0. 026 0.037 0.037 0.050 c6 - 0. 007 - 0. 035 0.024 0.027 c7 0.045 0.042 0.017 0.016 Ed 1.887 3.001 23.298 21.824 Tabl e 1 . Summary of t h e descr ipti ve stat is tic s of t he eleme nts of t he fea ture vector by monta ge . ! Figur e 3. Pe rc e nt va ri a nc e e x pl a i ne d by e a c h pr i nc ip a l com p o nen t fo r ea ch refe ren ti al mo n tag e ty p e. Feature Mean Variance LE AR LE AR Ef 1.685 12.390 49.560 19.368 c1 2.296 1.949 0.891 1.171 c2 0.991 0.677 0.510 0.675 c3 0.320 0.296 0.166 0.250 c4 - 0.060 - 0.009 0.107 0.128 c5 - 0.026 0.037 0.037 0.050 c6 - 0.007 - 0.035 0.024 0.027 c7 0.045 0.042 0.017 0.016 Ed 1.887 3.001 23.298 21.824 Table 1 was addressed through the im plementation of CMN , in the hopes o f stabilizing the systems. Unfort unate ly, CMN did not pr ove to be as suc cessfu l with EEG dat a. Figure 5 shows that the performance with CMN is worse for all cases except the AR model evaluated on LE data . IV. S UMMARY EEG machine learn ing tec hnology should be robust to any type of EEG signal . The a bility to train channel - independ ent m odels, or to maintain performan ce a cross different montages, is extre mely important in clinica l settings , whe re there is not one specific standard w ay to conduct the recording s . Our analys is of the two diffe rent referential m ontages that represen t the m ajority of th e data in the TUH EEG Corpus , Linked Ears R eference (LE) and Aver aged Ref erence ( AR ), shows that there are systematic differences in the statistics of the data. Though our existi ng baseline system is capable of addressing these variations, it seems likely tha t some form of chan nel normalization should improve performance and reduce the va riance of the model . Cepstra l mean norma lizat ion (CMN) was impl emente d in order to address the mean bias that is present in the two different referential systems. Our results indicate that this technique was not as successful in the EEG domain as it was in speech. Additional investiga tion into this topic is w arranted. This paper has shown that finding and impleme nting a successful n ormalization approach for clinical EEGs would allo w the dat a to be mi xed, t hereb y making the overa ll corpus more useful for machine learning rese arch. A CKNOWLEDGEMENTS Research repor ted in this publicat ion was supporte d by the National Human Genome Researc h Institute of th e Nation al Institu tes of Heal th under award numbe r U01HG00846 8. The content is solel y the responsibility of the authors and does not necessarily represent the official vi ews of the National Institutes of Health. This material is also based in part upon work supported by the National Science Foundati on under Gran t No. IIP - Figur e 6. ! DET Curves for each of the recogniti on experiments. The fir st monta ge indicat or refer s to the data used for traini ng, while the second one refers t o th e evaluat ion set. For example , LE+AR/ AR refer s to a m od e l tr ain ed w i th LE+AR dat a a nd eval u at ed w ith AR data . Tr a i n / Ev a l LE AR LE+ A R LE 77. 19% 72. 89% 78. 52% AR 55. 92% 61. 41% 60. 89% LE+ A R 68. 60% 68. 25% 71. 40% T a b l e 2 . Re c o g n i t i o n r e s u l t s f o r m i s m a t c h e d tr a i n i n g a n d e v al u at i o n s et s a c co r d i n g t o t h e re fe r e n t i a l m o n t a g e t y p e o f e a ch se t . ! Figur e 4 . The a mplitudes of the ei genvect ors f or ea ch montage are shown. N ote that components 2 - 8 re pr ese nt th e cep st ra l f e atu r es , co mp o n en t 1 rep r e sen t s fr eq uen cy do m ain ene rg y an d co mp o n en t 9 r ep r e sen t s d iff e rent ial en e rg y. ! Figur e 5 . Perfor mance c ompa ris on for the normalize d a nd non - norm ali ze d sys tems . 1622765. Any opini ons, findings, and conclusions or recommen dations expressed in this material are those o f the author(s) and do not necessarily reflect the views of the National Science Found ation. The TUH EEG Corpus work was funde d b y ( 1) the Defen se Advance d Re search Projects Agency (DARPA) MTO under the auspi ces of Dr. Doug Weber through the Contract No. D13AP00065, (2) T emple University’s College o f En gineering and (3) Temple Univers ity’s Offi ce of the Senior Vice - Provost for Research. R EFERENCES [1] C. Panayioto poulos, “Optimal Use of the EEG in the Diagnosis and Management of Epilepsies,” in The Epil epsies: Seizure s, Syndromes and Management , B. M. Pu blishing, Ed. Oxford shire UK, 2005. [2] Lopez, S., Suarez, G ., Jungries, D., Obeid, I., & Picone, J. (2015). Automated Identifica tion of Abnormal EEGs. In IEEE Signal Processing in Medicine and Biology Symposium (pp. 1 – 4). Philadelphia, Penn sylvania, USA. [3] B. Direito, C. Teixeira, B. Ribeiro, M. Castelo - Branco, F. Sales, and A. Dourado, “Modeling epileptic brain states using EEG spectral analysis and topographic mapping,” J. Neurosci. Methods , vol. 210, no. 2, pp. 220 – 229, 2012. [4] A. Temko, E. Thomas, W. Marnane, G. Lightbody, and G. Boylan, “EEG - based neonatal seizure detection with Support Vector Machines,” Clin. Neurophysiol. , vol. 12 2, no. 3, pp. 464 – 473, 2011. [5] S. Xie and S. Krishnan, “Wavelet - based sparse functional linear model with applicati ons to EEGs seizure detection and epilepsy diagnosis,” Med . Bio l. Eng . Compu t. , vol. 51, no. 1 – 2, pp. 49 – 60, 2013. [6] P. H u, “Reducing False Alarms i n Critical Care,” in Working Group on Neurocritical Care Informatics, Neurocritica l Care Society Annual Meetin g, 2015. [7] I. Obeid and J. Picone, “NSF ICORPS Team: AutoEEG,” Department of El ectrical and Comp uter Engineeri ng, Temple University, Philade lphia, PA, USA. (Availa ble at https://www . isip.piconepress.com/pu blications/reports/2016/nsf/ic orps/ ) [8] A. Harati, S. Lopez, I. Obeid, M. Jacobson, S. Tobochnik, and J. Picone, “THE TUH EEG CORPUS: A Big Data Resource for Automated EEG Interpre tation,” in Proceedin gs of the IEEE Signal Processing in Medicine and Biology Symposium , 2014, pp. 1– 5. [9] X. Huang, A. Acero, and H. - W. Hon, Spoken Language Processing: A Guide to Theory, Algorithm and System Development . Up per Saddle Riv er, New Jerse y, USA: Prentic e Ha ll, 2001. [10] J. Acharya, A. Hani, P. Thirumala, and T. Tsuchida, “American Clinical Neurophysiology Society Guideline 3: A Proposal for Standard Montages to Be Used in Clinical EEG,” J. Clin. Neurop hysiol. , vol. 33, no. 4, 2016. [11] E. Hagemann and J. F. Thayer, “The quest for the EEG reference revisited: a glan ce from brain asymm etry research,” Psychophysiology , vol. 38, no. 5, pp. 847 – 857, 2001. [12] A. Harati, M. Golmohammadi, S. Lopez, I. Obeid, and J. Picone, “Improved EEG Event Classifi cation Using Differential E nergy,” in Proceedings of the IEEE Signal Processing in Medicine and Biology Symposium , 2015, pp. 1 – 4. [13] R. O. Duda, P. E. Hart, and D. G. Stork, Pattern classification , 2nd ed. New York City, New York, U SA: John Wiley & Sons, 2003. [14] Liu, F. - H., Stern, R. M., Hu ang, X., & Acero, A. (1993) . Efficient cepstral normalization for robust speech recognition. Proceedings of the Workshop on Human Language Technology - HLT ’93 , 69 .
Original Paper
Loading high-quality paper...
Comments & Academic Discussion
Loading comments...
Leave a Comment