Optimizing Channel Selection for Seizure Detection
Interpretation of electroencephalogram (EEG) signals can be complicated by obfuscating artifacts. Artifact detection plays an important role in the observation and analysis of EEG signals. Spatial information contained in the placement of the electro…
Authors: Vinit Shah, Meysam Golmohammadi, Saeedeh Ziyabari
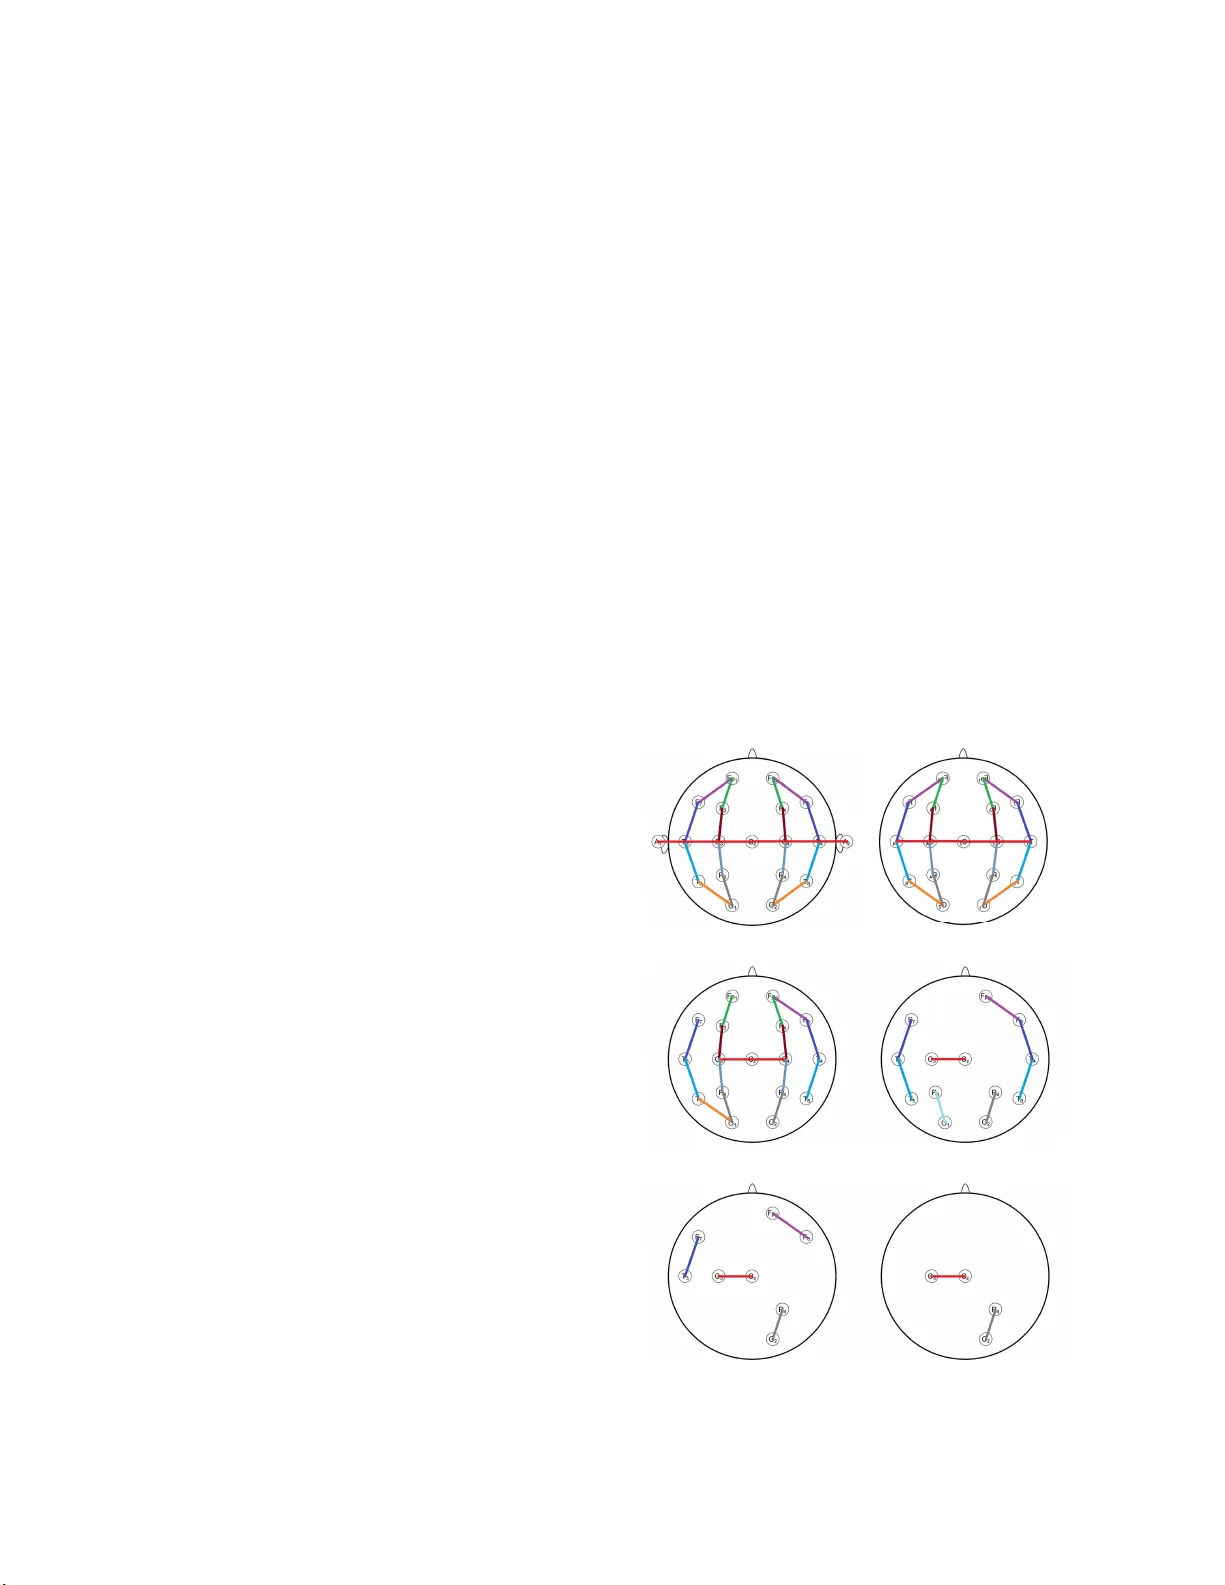
OPTIMIZING CHANNEL SELECTION FOR SEIZURE DETECT ION V. Shah, M. Golmoham madi, S. Ziyabari, E. Von W eltin, I. Obeid and J. Picone Neural Engi neering Data Co nsortium, T emple Univer sity, Philadel phia, Penns ylvania, USA {vinitshah, meysam, saeedeh, eva.vonwelti n, obeid, p icone}@temple.ed u Abstract— Interpretation of el ectroencephalogram (EEG) signals can be complicated by obfuscating artifacts. Artifact detection plays an important role in t he observation and analysis of EEG signals . Spatial i nformation contained in the placement of the elect rodes can be ex ploited to accurately detect a rtifacts. However, when fewer electrodes are used, less spatial informat ion is available, m aking it harder to detect artifacts. In this study, w e inves tigate the performance of a deep learni ng algorithm , CNN-LSTM , on several channel configurations. Each configur ation was designed to minimize t he am ount of s patial information lo st compared to a standard 22-channel EEG. Systems using a reduced number of channels ranging from 8 t o 20 achieved sensitivities between 33 % and 37% with false alarms in the range of [38, 50] per 24 hours. False alarms increased dramatically (e.g., over 300 per 24 ho urs) when th e number of ch annels was further reduced. Baseline p erformance of a system that used all 2 2 channels w as 39% se nsitivity w ith 23 false alar m s. S ince the 22-channel syste m w as the only system that included r eferential channels, the r apid increase i n the false alarm rate as the number of cha nnels w as reduced underscores the importance of retaining referential channels for artifa ct reduction. T his c autionary result is i mportant because one of the bigg est differe nces between various ty pes of EEGs administered is the type of referential channel used. I. I NTRODUCTION An electroe ncephalogra m (E EG) is a ver y popular non- invasive to ol for record ing signals and dia gnosing bra in- related illnesses [ 1]. T he 10-20 electro de c onfiguration is by far the most popular standa rd worldwide for conducting EEG tests [2] and provides clinicia ns a n adequate amount of i nformatio n about the si gnal to m ake a diagnosis. Higher density EEGs are popular in re search communitie s for their super ior loc alization cap abilities, but are still not co mmon in cli nical p ractice. T hough the increased den sity of the elec trode grid doe s provide additional informat ion, this informatio n is no t significantl y more infor mative and do es not j ust ify t he additional d isk space required to archive the d ata. The TUH E EG Corpus (T UEEG) [3], which is the subj ect of this study, is the world’s largest publicly accessib le archive o f c linical EEG recordings. It c ontains over 40 unique c hannel co nfigurations. Many o f these configurations were created t o assist in the diagnosi s o f specific disea ses. T he most str iking di fference in t hese configurations is the manner in which ground and reference is used when a differential montage is constructed [4 ][5]. Since E EG signals a re very low i n voltage and quite nois y , groundin g and/or referenci ng plays a key ro le in one’s ab ility to collec t clean signals. In thi s pa per, w e focus o n an important subset of TUEEG known as the TUH EEG S eizure Corp us (T USZ) [6]. Over 90% of t hese files use th e 19-channel configuratio n shown in Figure 1 [7]. We have applied a com bination of longitudinal a nd transverse bi polar montages, r eferred to as a TCP montage [ 7], to create 22 channel d ifferential- bindings with a foc us on focal re gions o f t he scalp . This montage is al so summarized in Figure 1. TUSZ has been manually annotated for diverse morphologies of seizure e vents. W e have intro duced a deep lea rning arc hitecture [9 ] that ac hieves a ver y lo w false positive rate (FP R). T his s ystem integrates convolutional ne ural network s (CNNs) with recurrent neural n e tworks (RNNs) to d eliver state of the art performance . T his do ubly de ep recurr ent co nvolut ional structure models b oth spatial re lationships ( e.g., cross- channel de pendencie s) and temporal d ynamics (e.g., events suc h as spikes). The integration of CNNs a nd lo ng-short term memory (LSTM) units do es a much be tter j ob rejec ting artifacts. Artifacts and events such as wicket spikes, rectus muscle and electrode-pop artifacts are e asily con fused w ith spike and wave discharges because they often appear on o nly a few channels similar to the way seizure e vents present themselves. The depth of the convolutiona l net work is important since the top convolutional layers tend to l ear n generic features while the deep er layers learn d ataset specific feature s. T he convolutional LSTM architecture with pr oper initia lization and re gularization deliver s 30% sensitivity a t 6 false alar ms per 2 4 hours [10]. Figure 1. Elec trode location s for a standard 10-20 system with a defined 22 -c hannel TCP monta ge. Feature extrac tion typically r elies on time freque ncy representations of t he signal. Though we can replace traditional model-based feature extraction with de ep learning-based a pproac hes tha t o perate directly on the sampled data, i n this work we foc us o n the use of traditional cep stral-based features. In our current system, we use a traditional linear frequency cepstral coefficient- based feature extractio n appro ach ( LFCCs) [5 ][8]. We also use first a nd second de rivatives of the features since these improve perfor m ance. T hough w e can r eplace traditional model-based feature extraction with de ep learning-based a pproac hes tha t o perate directly on the sampled data, or more advance d d iscriminative features, these have not yet prod uced substantial impro vements in performance for this applica tion. Neurologists t y pica lly revie w EE Gs in 1 0 sec windo ws and identify events with a temporal resolution of approximatel y 1 sec. Follo w ing this appr oach, w e chose to analyze the signal in 1 sec epoc hs, and f urther di vide this interval into 10 frames of 0.1 secs each so t hat features ar e comp uted every 0.1 se conds (referred to as the fra me duratio n) using 0.2 sec ond a nalysis windo ws (referred to as the windo w duratio n). The outp ut of our feature extrac tion process is a f eature vector of dimen sion 26 for each of the 22 c hannels, with a frame duratio n of 0.1 secs. This o ptimized system p roduces 3 9% sensitivit y and 9 0% specificit y with 23 false a larms (FA) per 24 hours [9]. T his will be o ur baseline system. Our focus in this stud y is t o optimize the selection of channels. T his serves two purpo ses. First, it reduce s the dimensional ity of t he proble m. Second, a nd more importantly, our goal is to find a minimal numbe r of channels that are common acro ss all EEGs tha t ca n provide reasonab le levels o f p erformance. Otherwise, the system will have t o adapt to the unique channel configuration of ea ch EEG o r clinical site, and this is an extremel y complex pro cess. The results presented in this p aper use the Any Overlap scoring method [1 1] in which true p ositives ar e counted when the hypo thesis overlaps w ith one or more reference annotations. False positi ves cor respond to events in which the hy pot hesis annota tions do not over lap wit h any of the reference annotatio ns. T his method of sco ring is popular in the EEG research co mmunity. The r elative rankings of the s ystems ar e not sensitive to the scor ing method, though the absolute numbers do change s lightl y. II. C HANNEL S ELECTION EEGs are used to diagnose a w id e variety of pathologies. Application s include obvious thi ngs like se izure detection and p rediction. B ut an EEG today is also be ing used to d iagnose psych o logica l disorders, sleep disorders and head injuries. Further, an EEG is used to m o nitor the impact o f dr ug inter ventions. For ea ch speci fic ta sk, spatial i nformation p lays a majo r ro le. For example, electrod es pla ced ne ar the occipital lobe ca pture brain activity re lated to vi sion whe reas mid-parie tal region electrod es collect infor mation re lated to waking consciousness. In thi s study, we have focuse d o n seizure detection. We emphasize the importance of u sing do main k nowledge in the selec tion o f cha nnel co nfigurations instea d of using an ad hoc selection p rocess. An overview of t he c hannel selection process is given in Fi gure 2. W hen reducing the number of chan nels from 22 to 20, we re moved the referential channels A1 an d A2. T hese are attached to the patient’s ears and are generally very susceptib le to noise. Additionall y, all brain events o ccurring on those cha nnels can also be observed on e lectrodes T3 and T4 . Frontal Polar ( FP1 & FP2) channels are mostl y ignored because o nly 36% o f frontal se izures can be o bserved on scalp EEGs maki ng a utomatic detectio n of frontal lobe seizures very difficult [1 2]. The CZ ele ctrode is utilized throughout a ll configurations b ecause, due to i ts location at the c enter of the scalp a nd b ecause i t i s att ached to 6 adja cent electro des in the TCP m onta ge, the CZ electro de is able to detec t seizures occur ring in bo th he mispheres better tha n an y ot her single e lectrod e. Onl y o ne o f t he (a) 22 channels (b) 20 channels (c) 16 channels (d) 8 channels (e) 4 channels (f) 2 channels Figure 2. An overview of the channel selection strategies that were employed to reduce the number of channels. occipita l (O1 & O2) electro des ha ve been c onsidere d in 4 and 2 c hannel configurati ons because the occipital electrod es are always placed clo se to each other. Consequen tly, it is li kely t hat seiz ure eve nts occurr ing near one of the occipital elec trodes will a ppear on the other as well. III. E XPER IMENTA L D ESIGN AND A NALY S I S For this s tudy, we have used a baseline s ystem tha t integrates CN Ns and LST MS, as shown in Fig ure 3. The input tensors a re fed to a CNN stage that t y picall y consists of 3 layers of 2D CN N layers with 16 kernels o f size o f 3×3 and max-pooling l ayers o f size 2×2 to effectively reduce the d imensionalit y of t he input. Dropo ut layers are added at the end of e ach layer except the very las t one to avoid overfitti ng. T he outp ut is then flattened and fed to a 1D CNN network whic h acts as a fully connected net work. The output of this pass is fed to a bidir ectional LST M stage. Exponential Linear U nits (ELU) a re used as the acti vation f unctions for all sta ges except the last sta ge, which use s a sigmo id ac tivation function. A mean -square er ror loss function and Ada m optimizer are a lso used. Postpro cessing is used on the system output to reduce t he false alar m rate. In T able 1 w e summariz e the results for each of the channel c onfiguration s shown in Figure 2 . T he sys tem with t he 22-chan nel conf iguration, a s expected , outperfor ms t he other syste ms. The 20 -channel, 16- channel and 8-chan nel configur ations pro duce mode rate reductions in pe rformance. T he 4-channel and 2-c hannel configurations perfor m poorly because t hese configurations lac k spatial co ntext. Unfortunatel y, the typical syste m defined here cannot be applied identically for all the c hannel con figurations that we ha ve de fined for this stud y because di mensionality reduction on a small number o f cha nnels is a p roblem. Applying m a x-pooling w ith a 2×2 m atr ix on all t he layers when using 2 , 4, and 8, cha nnels is not possible. To m a ke a fai r co mparison and to understand t he b ehavior of a system o n low d imensional te nsors we ha ve used two separate a pproaches for lo w-dimensional channe l configurations. Fir st, w e simpl y keep the dimen sionality of channel tensor intact. Second , w e remove one or more CNN layer s wheneve r we face dimensiona lity reductio n issues. M odification in n umbe r of CNN layers c an be observed in the second co lumn in Tab le 1. An ROC curve, w hi ch depicts the tr ue positive rate (T PR) vs. the f alse positive rate (FPR), is shown i n Figure 4. We compare four systems: 22 , 16, 8 and 4 chan nels. The 2 2- channel system clea rly o utper forms the o ther t hree reduced-cha nnel co nfigurations. The per forman ce differences are greatest for lo w values o f FPR, which is the region of most interest i n this a pplication. On the other hand, when the FPR is high, the perfor mance between these systems is minimal. We also observe that the performance differences between 16 -channel and 8-channel co nfigurations a re small w ith the 8-channel syste m p erformin g slightly better when the FPR is lo w. T his see ms to valid ate the proce ss used to select the se c hannel co nfiguration s that was based on significant amou nts of do main knowledge. Figure 3. A block diagram of the b aseline sys te m. Table 1. Performance vs. channel configuration Ch. 2D CNN Layers Sensitivity (%) Specificity (%) FA/24 Hours 22 3 39.15 90.37 22.83 20 3 34.54 82.07 49.25 16 3 36.54 80.48 53.99 8 3 33.44 85.51 38.19 4 3 33.11 39.32 325.54 8 2 30.66 88.79 28.57 4 1 34.09 39.00 332.15 2 3 31.15 40.82 308.74 Figure 4. ROC curves for 22 , 16, 8 and 4 c hannels Next, we conducted an experiment to investigat e the importance of i ncluding the re ferential c hannels A1 and A2, r eferred to colle ctively as Ax. Ta ble 2 pre sents a compariso n the 2, 4 , 8 and 16 c hannel con figurations to the same configura tions with Ax added. We also provide an R OC curve in Fig ure 5. The ROC curves demonstrate that gap in per formance b etwee n the 18-channel syste m and the 10-channel syste m is much greater than that achieved wit hout the additiona l channels. Further , overall performance with A x is be tter than witho ut. To further prob e this, in Figur e 6 , we co mpare a n 18- channel co nfiguration with A x c hannels to a 16-channel configuration without the A x channel s. The system using referential cha nnels perfor ms better at lo w FPR than the system without referen tial channels, and this improvement i n perfor mance is not simply due to the increased cha nnel count. I nstead it is an indicat ion that the refere ntial channels ar e provid ing meaningful information, e specially at lo w FPRs. IV. S UMMARY In this p aper, we have investi gated t he i mpact of referential c hannels on se izure detec tion p erformance. We have e xplored this using a framework based on a hybrid CNN-LST M deep learning system. Not surprisingl y, u sing a ll channels from a 10-20 EEG configuration gave best pe rformance: 39.15 % sensitivity and 90.3 7% specificity with 22.83 FA per 24 hours. Selection a mode rately reduce d numbe r of c hannels ( e.g., 16 and 8 ) resulted i n a small b ut measur able degrada tion in pe rformance. Adding refere ntial c hannels to t hese configurations i mproved pe rformance par ticularly in the low FPR reg ion of pri m ary in terest in this a pplication. Deep learning s ystems are extremely sensitive to training conditions. Initializa tion of mod els a nd rando mization of the da ta pla y a far too signi ficant ro le in the over all performance . T his co mplicates these t ypes o f par ameter studies be cause the system must be individua lly optimized for each co ndition. T his is a n ongoi ng i ssue that we are a ddressing in f uture researc h. Also, w e de monstrated that net work ar chitecture s needed to change for the l ow-order s ystems. For exa m ple, t he 4- channel s ystem i n Ta ble 1 used only one 2D CNN layer. These t ypes o f op timizations are anot her reason t hese parametric studies must be carefull y designed. Finally, si nce the use of referential channels varies significantl y acr oss EE G type, c linical site, ne urologist, etc. Better techniques to r educe the se nsitivity of performance to these refere ntial chan nels is needed. A CKNOWL EDGMENTS Research repo rted in this publ ication was most re cently supported by the Na tional Human Ge nome Resear ch Institute o f the National Institutes o f Health under award number U01HG00 8468. The content is solel y t he responsibilit y o f the authors a nd does not necessaril y represent the officia l views of the National I nstitutes o f Health. This materia l is also ba sed in par t upo n work supported by the National Science Foundatio n unde r Grant No. IIP-1 622765. Any opinions, findi ngs, and conclusions or rec ommendatio ns e xpressed in this material ar e those of the au thor(s) and d o not necessarily reflect the views of the Na tional Science Fo undation. R EFERENCES [1] T. Yamada and E . Meng, Practical guide fo r clinical neurophysiologic testing: EEG . Philadel phia, Pennsylvania, USA: L ippinc ott Wil liams & Wilkins, 2009. Table 2. A comparison of performance demonstrating th e impact of includin g the A x channels No. Chan. Sensitivity (%) FA/24 Hours w/ A x w/ o A x w/ A x w/o A x w/ A x w/o A x 22 20 39.15 34.54 22.83 49.25 18 16 36.65 36.54 37.33 53.99 10 8 30.94 33.44 283.18 38.19 6 4 34.36 34.09 58.15 332.15 4 2 3 3.06 31.15 47.53 308.74 Figure 5. ROC c urves for 22, 18 and 10 channel configurations that include the A x channels Figure 6. 18- c hannels w/ A x vs. 16-chann els w/o A x [2] W. Tatu m, A. Husain, S. Benbadis, and P. Kaplan, Handbook of EEG Interpretation . New York City, Ne w York, USA: Demos Medical Publishing, 2007. [3] I . Obeid and J. Picone, “The Temple University Hospital EEG Data Corpus,” Front. Neurosci. Sect. Neural Technol. , vol. 10, p. 196, 2016. [4] I . Obeid and J. Picone, “Machine Learning A p proaches t o Automatic Interpretation of EEGs,” in Biomedical Signal Processing in Big Data , 1st ed., E. Sejdik and T. Falk, Eds. Boca Raton, Florida, USA: CR C Press, 2017 (in press). [5] S. L opez, M. Golammadi, I. Obei d, and J. Pic o n e, “An Analysis of T wo Commo n Refe rence Points for EEGs,” Pr oceedings o f the IEEE Signal Processing in M edicine and Biology Symposium , 2016, pp. 1–4. [6] M. Golmohammadi, V. Shah, S. Lopez , S. Ziyabari, S. Yang, J. Camaratta, I. Ob eid, a nd J. Pico ne, “The TU H EEG Seizur e Corpus,” Proceedings of the American Clinical Neurophysiology Society Annual Meeting , 2017, p. 1. [7] A CNS, “ G uideline 6: A Proposal for Standard Montages to B e Used in Clinical E EG,” Milwaukee, W S, USA , 2006 ( avai lable at http://www.acns.org/pdf/g uidelines/Guideline-6.pdf ). [8] A . Harati, M. Golmo hammadi, S. Lopez , I. Obeid, and J. Picone, “Improved EEG Event Classification Using Diffe rent ial Energy,” Proceedings of t he IEEE Signal Processing in Medicin e and Biology Symposium , 2015, p p. 1–4. [9] M. G olmohammadi, S. Ziy abari, V. Shah, I . Obeid, and J. P icone, “Deep Architectures for Automated Seizure Detection in Scalp EEGs,” submitted to the AAAI Conference on A rti fical Intelligence, 2018, pp. 1–8 (av ailable at: https://www.isip. piconepress.com/publicatio ns/unpublished/conferences/2018/aa ai/deep_learning/ ). [10] Golmohammadi, M., Ziyabari, S., Shah , V., Ob eid, I., & Picone, J. (2017). Gated Recurrent Netw orks for Seizure Detection. Submitted to the I EEE Signal Processing in Medicine and Biology Symposium (pp. 1 –5) (a vailab le at https://www.isip. piconepress.com/publicatio ns/unpublished/conferences/2017/iee e_spmb/rnn/ ). [11] Zi yabari, S., Shah, V., Gol mohammadi, M ., Obeid, I., & Picone, J. (20 1 7). A n Analysis of Objective Performance Metrics for Automatic I nterpretation of EEG Signal Eve nts. Submitted to the Journal of Clini cal Neurophysiology (available at: https://www. isip.piconepress.com/publicati ons/unpublished/journals/2017/jc n/metrics/ ). [12] W. Deburchgraeve et al., “Automated neonatal seizure detection mimicking a human obse rver reading EEG,” Clin. Neurophys iol. , vol. 119, no. 11, pp. 244 7–2454, 2008.
Original Paper
Loading high-quality paper...
Comments & Academic Discussion
Loading comments...
Leave a Comment