Bandwidth-Efficient Synchronization for Fiber Optic Transmission: System Performance Measurements
In this article, we first provide a brief overview of optical transmission systems and some of their performance specifications. We then present a simple, robust, and bandwidth-efficient OFDM synchronization method, and carry out measurements to vali…
Authors: Oluyemi Omomukuyo, Octavia A. Dobre, Ramach
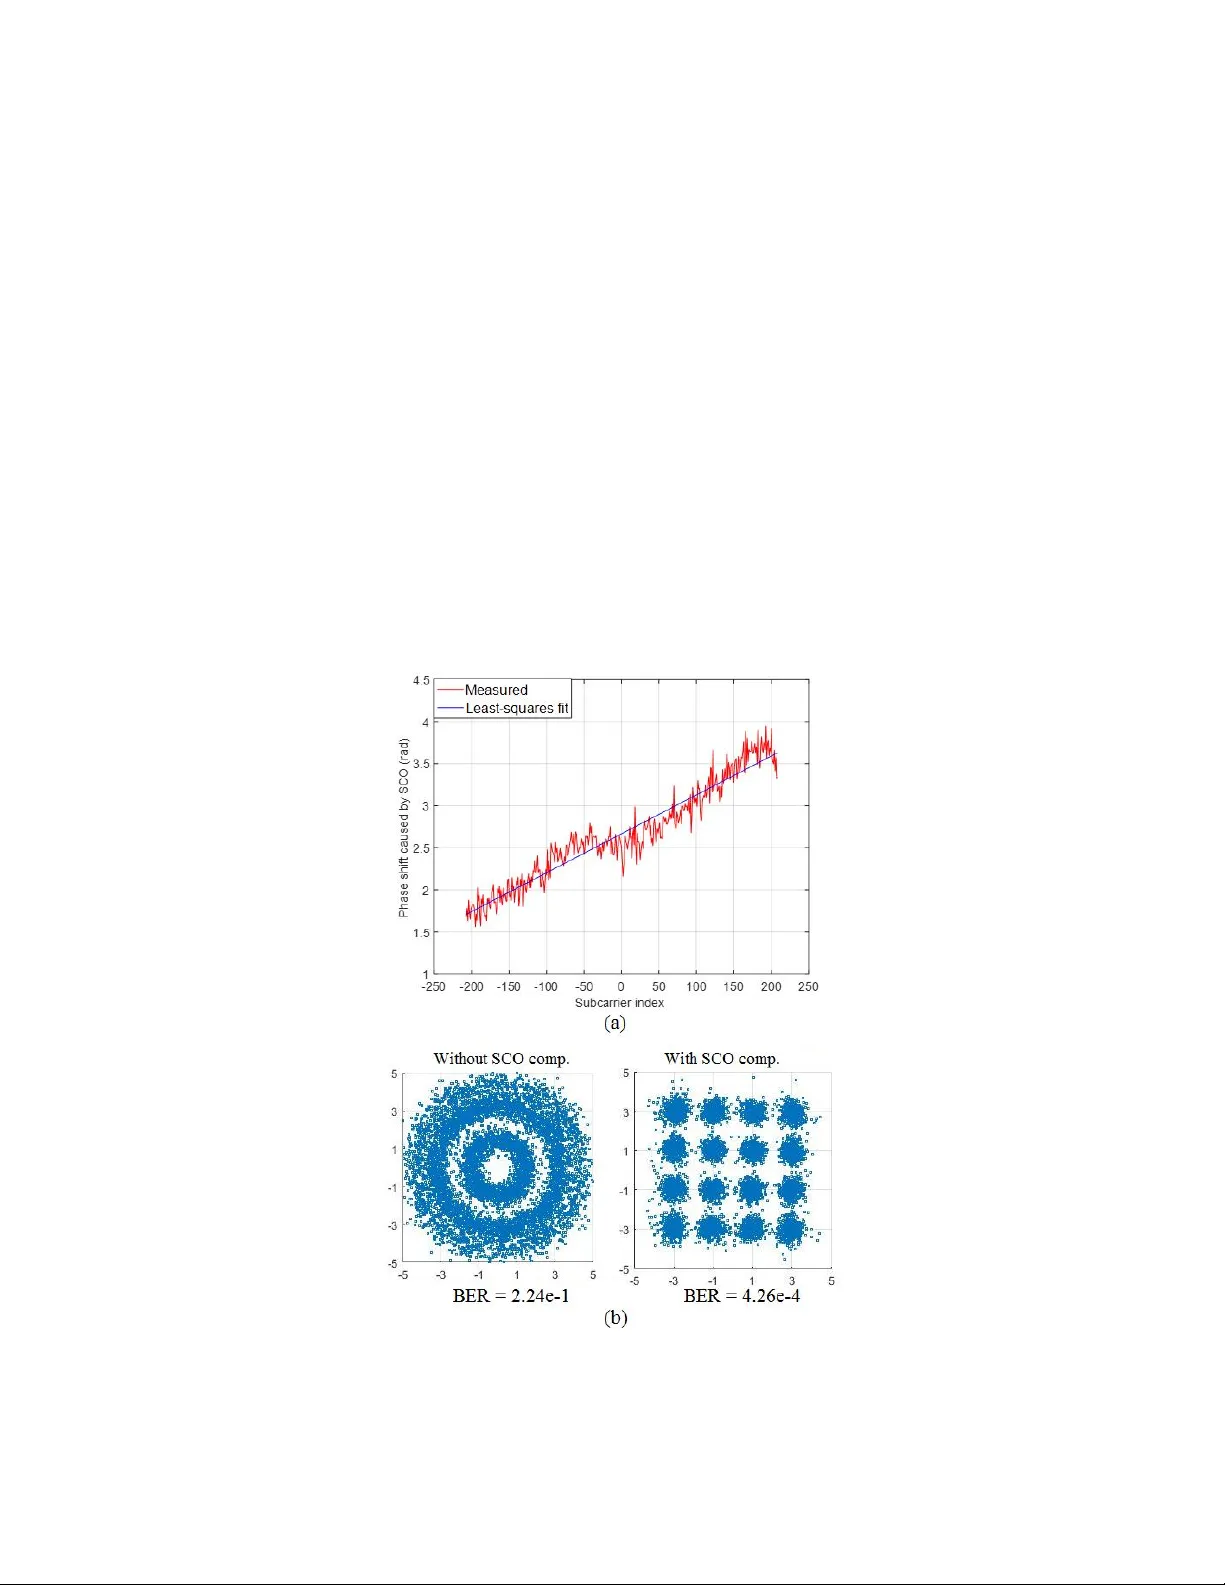
Bandwidth-Efficient Sy nchroni zation for Fiber Optic Trans mission : System Performa nce Measurements Oluyemi Omomukuyo, Octavia A. Dobre, Ramachandran Venkatesan, and Telex M. N. Ngatched By a ny measure, the various services and applic ations which are crucial to today’s soc iety rely on fast, efficient, and reliable information exchange. Nowadays, most of thi s information tr affic is carried over long distances by optical fiber, which has intrinsic advanta ges such as wide transmission bandwidth and low attenuation. However, continuing traffic growth has imposed many challenges, especially for equipment manufacturers who have to develop optical transmission solutions to handle the demand for higher data rates withou t incurring increased capital and opera tional costs. A feasible approach to overcoming these challenges is to scale the channel capacity b y emplo ying orthogonal frequency division mul tiplexing (OFDM) super- channels. However, OF DM i s sensitive to s y nchronization errors, which can result in complete failure of the receiver-based digital signal processing. Measurement re sults of various existing OFDM synchronization methods have highlighted inhere nt limitations with regards to poor system performance, which det ermines the quality-of-service level perceived by the end user, and complexity, which throws doubts a s to their sui tability for implementation in a ctual equipme nt. In this article, we first provide a brief overview of optical transmissi on systems and some of their performance specifica tions . We then present a si mple, robust, and bandwidth-efficie nt OFDM synchronization method, and carry out measurements to validate the presented synchronization method with the aid of an experimental setup. Introduction In its most basic form, an optical transmission s yst em , as shown in Fig. 1 a, consists of an optical source (usually a laser), optical fiber, an optical detector (usually a photodiode), as we ll as va rious other optical components such as modulators between the optical source and detector. In this system, some sort of information, encoded in the form of an electrical signal, is used to modulate the intensit y of an optical carrier either directly using the optical source, or indi rectly via an external modulator. The modulated optical signal travels along the optical fiber, where it is directly detected b y the optical detector and converted ba ck to an electrical signal. S uch a simple s y stem is referred to as an intensity-modulated direct detection (I MDD) system. Fig. 1. (a) Basic IM DD transmission system employ ing a n external modulator; (b) Optical transmission system featuring PDM, WDM, and cohere nt detection. DAC: digital- to -analog converter. PBS: polarization beam splitter. PBC: polarization beam combiner . Ch: channel. IMDD systems are limited by low transmission data rate (measured in bits per second), a nd are typically used for short distance s. I n order to increase the transmission data rate and reach, modern optical transmission systems usually e mploy the following techniques: • Coherent detection, where the modulated optical signal is combined coherently with another optical signal at the receiver. The d eployment of commercial coherent detection optical systems has been facilitated by rapid advances in digital signal processing (DSP). • Polarization division mu ltiplexing (PDM), which is based on the ability of light, as an electromagnetic wave, to oscillate with more than one orientation. B y launching optical signals into the fiber on two orthogonal states of polarization ( x and y ) at an identical wavelength, PDM results in doubling the data rate. • Wavelength division multiplexing (WDM), where several dat a channels are modulated onto opti cal carriers at different wavelengths, mul tiplexed, and then launched into the optical fiber. These channels are demultiplexed at the receiver . Fig. 1b depicts the detailed architecture of a n opti cal transmission s y stem employing the three techniques mentioned above. The increase in transmi ssion data rate a nd reach from using coh erent optical s ystems instead of I MDD s ystems comes at the cost of increased c omplexit y. In addition, performance impairments a t high data rates become significant, such as the fiber chroma tic dispersion, polarization mode dispersion (PMD), and amplified spontaneous emission (ASE) noise generated by the optical amplifiers. Consequently, character izing these impairme nts, and c arrying out measurements usin g specialized instruments is very essential for performance assessment, testing, and troubleshooting. Measurement in Optical Transmission System s As in any communicati on s ystem, the bit error rate (BER) is the fundamental parameter that quantifies the fid elity of data transmission. The BER is a ratio o f the number of bits received in error to the total number of received bits. For hi gh-speed long-haul optical transmission systems, the major sources of bit errors are the ASE noise, and signal distortion induced by linear and non- linear fiber impairments. In such optical s ystems, a BER of 1e-15, achiev ed with forward error correction, is often required. The main linear fiber impairment is dispersion, which occurs when a li ght pulse is spread out during fiber transmission, interfering with neighboring pulses, and resulting in e rrors. Non-linear impairments increase in significance exponentiall y with an increase in the power launched into the fiber, putting a limit on the achievable transmissi on reach. Modern c oherent opti cal s ystems utilize DSP at the receiver to compensate for these impai rments. S ystem performance measurements are thus crucial in ensuring that these DSP algorithms can tolerate the level o f optical impairments that the system will be exposed to. Fo r equipment manufacturers, these measurement results can be exploited to quantif y the qualit y-of-service level per ceived b y end users [1]. I n this article, w e highlight two of the most important optical measurements usually performed. Optical Signal- to -Noise Ratio Measurements For long-haul optical transmission systems that uti lize several in-line optical amplifiers as shown in Fig. 1b , the optical signal- to -noise ratio (OSNR) is an important parameter that indi cates the degree of impairment br ought about by ASE noise. The OSNR is the ratio of the signal opti cal power to the ASE noise power, and optica l receivers are usually specified in terms of the required OSNR (R-OSNR), which is the OSNR level required to obtain a target BER . The OSNR penalt y, obtained as the ratio bet ween the actual OSNR (at which the tar get BER is achieved) and the receiver R-OSNR, is a useful measurement for evaluating the robustness of a DSP algorithm to various impairments. In experimental setups, noi se loading is a technique which is us ed to v ary the OSNR in order to evaluate system performance in the presence o f ASE noise. Th is article describes the noise loading technique in more de tail later on. PMD Measurements PMD arises because of the non- circular symmetry of actual fiber brought about b y ex ternal stress as well as imperfections introduced during manufacturing. This as ymmetry results in a difference in propagation speeds through the fiber of the two orthogonal polarization states. PMD becomes increasingly si gnificant at high data rates, and as such, PMD measurements using specialized laboratory inst ruments are used to evaluate the P MD tolerance. One such instrument is the P MD emulator that generates varying levels o f P MD-induced dela y so as to accuratel y and rapidl y reproduce the variations of PMD in actual fiber. We have made use of a PMD emulator for the experimental validation of the presented synchronization method. Scaling Channel Capacity in Optical Transmission Modern society d emand s increased bandwidth to support a plethora of applications and services such as video streaming, social media, and cloud computing, all of which have contributed to an exponential grow th in data traffic. This growth is also being accelerated by mobile access. Despite the increase in transmission data rate brought about by utilizing WDM and PDM in current commercial coherent optical systems, a pertinent question presents itself, which is: How can this traffic growth be sustained without substantially increasing the cost per bit? Providing an answer to this question is ver y crucial for optical equipment manufacturers, and current research and dev elopment efforts are c entered on scaling the cha nnel capacity of nex t - generation coh erent opti cal transmission sy stems without increasing the op erational complexity or the cost per bit per Hz [2 ]. A feasible solution is to emplo y opti cal super-channels, where the spacing between conventional WDM channels is re duced, improving the bandwidth efficiency (in bits per se cond per Hz). These supe r-channels are then routed to gether over a common optical link , as shown in Fig. 2. Coherent optical OFDM (CO-OFDM) [3] is one of the enabling technologies used in super - channel coherent optical systems. OFDM makes use of several low -rate s inc-shaped subcarriers which are orthogonally multiplexed , as shown in Fig. 2 . This orthogonalit y is what pe rmits the WDM channel spacing to be reduced without suffering crosstalk p enalties. However, OFDM is more sensitive to s ynchronization errors when compared with sin gle carrier modulation schemes [4 ]. These s ynchronization errors can result in loss of orthogonality and si gnificant crosstalk in a CO -OFDM super-channel. Synchronization is therefore cru ci al for practical CO-OFDM receivers. The three key synchronization subsystems are : • Frame synchronization, which is concerned with es timating the correct start of each OFDM symbol in the received frame. • Frequency synchronization, whose functionality is compensating for the carrier frequency offset (CFO) caused by the incoherence of the lasers at the transmitter and receiver. • Sampling clock s ynchronization, which is concerned with estimating and compensating for the mismatch between the sampling clocks of the digital- to - analog converter ( DAC ) in the transmitter and the analog- to -digital converter (ADC) in the receiver. Fig. 2. CO -OFDM super-channe ls made up of tightl y-packed WDM channels. Each WDM channel comprises several sinc-shaped subcarriers. Many s ynchronization methods in the literature are li mited by one or more of the following : poor frame synchronization performance, limited CFO estimation range , and complex ity. Furthermore, because these method s require different tr aining symbols for the different synchronization tasks, see e.g. [ 5], the net bit rate is reduced, which reduces the bandwidth efficiency. In this article, we present a simple, robust, and bandwidth-efficient method to overcome all the above-mentioned limitations without sacrificing performance, power c onsumption or cost. Furthermore, with the aid of ex perimental measurements, w e then discuss a nd e valuate the performance of the method in a PDM CO -OFDM system. Operation Principle of Synchronization Method To achieve a bandwidth-efficient synchronization solution , we use the same training s ymbols to carry out joi nt frame, f requency, and samplin g clock s ynchronization. Golay complementary sequences (GCS) [6], which can achieve mi nimum mean square error p erformance of channel estimation, have been us ed as the training symbols. These training s y mbols are ar ranged in the Alamouti scheme [7 ], whe re there are two training symbols per polarization. Frame Synchronization The trainin g s y mbols an d , of len gth , where is the number of OFDM subcarriers, are zero-padded with zeros, where is the inverse fast Fourier t ransform (IFFT) siz e. The starting point of the frame fo r the x- polarization, , can be determined by utili zing the autocorrelative property of the GCS to construct a timing metric [8 ]: with where and are the discrete received samples fo r the x and y polarizations, respectively, is the PMD-induced d elay (in samples) , is the number of c yclic p refix samples, is the modulo operator, and , with , is a pseudo- random sequence used to ensure the ti ming metric is impulse-shaped with a distinct peak. The interested reader is referred to [8] for similar equations for the y - polarization. Frequency Synchronization Th e frequency synchronization is divided into two sub-stages: fractional frequency synchronization, for estimating the fractional part of the CFO with a mag nitude , and integer frequency s ynchronization, for estimating the integer part of the CFO, where is the OFDM subcarrier spacing. After obtaining the right start of the CO-OFDM frame, the estimate of the fractional CFO is obtained from (1) by setting and , as explained in detail in [ 8]. Once the fractional CFO has been compensated for, the integer CFO is estimated by performing a cross-correlation between the freque ncy domain samples of the first received training symbol and the sum of the samples of the original training symbols. The CFO, obtained by summing the integer and fractional CFO estimates, is then compensated for b y multiplying the received time domain signal samples by an inverse rota tion factor [9 ]. Sampling Clock Synchronization The sampling clock sy nchronization is based on the principle that the sampling clock of fset (SCO) in duces a phase rota tion which va ries linearly with both the OFDM subcarrier and symbol indices [10], [11]. The estimate of the relative SCO, , between the clocks of the DAC and ADC is [1 0]: where is the OFDM symbol index for (which is 2 in this case), and represents the SCO- induced phase shift slope, which is obtained from the phase angles of the complex division of the received samples of b y their corresponding transmitted samples. The SCO estimate is fed-back to a time-domain interpolation, where the SCO is compensated for by resampling. An y residual SC O can be eliminated by repeating the feedback loop. Measurement Setup and Results In ord er to verif y the synchronization method , PDM 16-QAM mea surements have been conducted on a CO-OFDM system using an experimental testbed, whose schematic is shown in Fig. 3. Fig. 3. Experimental setup. RFD: RF driver, PMDE: polarization mode dispersion emulator, PC: polarization controller, EDFA: erbium-doped fiber amplifier, OSA: optical spectrum analyzer, OBPF: optical band-pass filter, VOA: variable optical attenuator, LO: local oscillator. For the experimental demonstrations, the measu rable parameters we have focus ed on include timing err ors, CFO, and SCO-induced phase offset, which have been e valuated using p erformance metrics such as B ER, OSNR penalty, mean squa red error (MSE), and constellation measure ments. In the experimental s ystem, the DSP procedure s f or both transmitter and receiver are carried out offline in MATLAB. At the transmitter, a pseudo-random bit sequence is mappe d onto the OFDM subcarriers into parallel complex data using 16-QAM modulation. The time-domain signal is then generated using a 512-point IFFT with a 46-sample cyclic prefix. Out of the 512 IFFT channels, 416 a re da ta subcarriers, 85 are unmodulated subcarriers used for oversampling, one unmodulated subcarrier is reserved for the DC term, and the re maining 10 are unmodulated subcarr iers centered around DC . The training s ymbols are inserted at the beginning of the OFDM frame to carr y out frame synchronization. The generated CO-OFDM signal is saved as a sin gle-column ASC II text file and then loaded into the volatile memor y of a Tektronix AWG70002A Arbitrar y Wavefor m Generator (AWG) operating at a sampling rate of 25 GSa/s and 9 -bit DAC vertical resolution. The analog in-phase and quadrature-phase signals for both polarizations are then amplified b y a 32 -Gb aud RF driver with 20-dB gain. These amplified signa ls a re then use d as the electrical driv es to a null-biased 30- GHz bandwidth dual-polarization IQ modulator. The optical source to the IQ modulator is a n integrated tunable laser assembly with linewidth of 1 0 kHz and center emission wavelength of 1550 nm. A PMD emulator is employed to investigate the performance of the presented method in the presence of the PMD-induced delay. For the OSNR mea surements, the noise loading is ca rried out by using an erbium -doped fiber amplifier (EDFA) as an ASE noise source. This EDFA is operated without an input, a nd its output is c oupled with the output of the PMD e mulator using a 50:50 coupler. The level of the ASE noise added, and consequently, the OSNR level, is varied by adjusting the attenuation of a variable optical attenuator connected to the ASE noise sour ce. The generated optical signal is then filtered by a 0.6-nm optical band-pass filter to suppress the out-of-band ASE noise, before being a mplified by a second EDFA with 15-dB gain. The output of the second EDFA is split into two paths using a 90:10 coupler. The 10% path of the coupler is fed into an opti cal spectrum anal y zer to monitor the OSNR. The 90% path is filtered by a nother o ptical band-pass filter, before bein g dete cted by a 32-Gba ud integrated coherent receiver with a 10-kHz linewidth loca l oscil lator. The wavelength of the local oscillator is tuned as appropriate to y ield the desired amount of CFO for the frequency synchronization measurements. The coherently-detected signal is then c aptured by a Tektronix DPO 72304DX, 23 -GHz, re al- time digital sampling oscilloscope (DSO) ope rated at a sampling rate of 50 GS/s with 8 -bit ADC resolution. In order to int roduce SCO for sampling clock s ynchronization measurements, a 10 - MHz output reference clock from the AW G is connected to the DSO. This enables the sampling clocks of the D AC and ADC to be s ynchronized, allowing for flex ibility in emulating va rious amounts of SCO by sim ply adjusting the sampling rate of the AWG. The horiz ontal position of the DSO is varied to emulate different time delays for the frame synchronization measurements. Discussion of Measurement Results Fig. 4a shows the measured timing and frequency metrics of the method for a CFO of 2.5 GHz and an SCO of 160 ppm at an OSNR of 15 dB, respectively. It can be seen that both metrics are impulse-shaped, and yield a distinct peak at the ri ght values of the timing and frequenc y of fsets, even in the presence of significant CFO and SCO. Fig. 4. (a) Measured metrics for the x-polarization at 15-dB OSNR (left: timing metric, right: integer CFO metric); (b) Frame and frequency synchronization performa nce in the presence of ASE noise; (c) OSNR penalty in the presence of PMD-induced delay. The results of Fig. 4b demonstrate the robustness of the frame and freque ncy s ynchronization to ASE noise, with no frame s ynchronization errors observed, and a maximum CFO MSE of 6.7e -3 (corresponding to a CFO estimation error of ~4 MHz) observed in all cases. Fig. 4(c) shows the OSNR penalty , based on the R-OSNR to achieve a targe t BER of 1.8e-2 (supported with FEC), as a function of the PMD-induced delay. Th e results show the robustness of the method to PMD, with a maximum OSNR penalty of 0.5 dB obtained for a PMD-induced delay of up to 280 ps. Fig. 5a shows the actual and least-squares fit of the phase rotation caused b y an SCO of 160 ppm, and for a CFO of 2. 5 GHz, confirming that the SCO-induced phase rotation varies linearl y with the OFDM subcarrier index. From the least-squares fit, the slope can be obtained, and the SCO estimated using (2 ). Fi g. 5b shows the measured 16-QAM conste llations after channel equalization without, and with SCO compensation for an SCO of 160 ppm. Fig. 5. (a) SC O-induced phase rotation versus subca rrier index; (b) measure d c onstellations for an SCO of 160 ppm: without and with SCO compensation. It can be seen from the c onstellation that when no mechanism for SCO compensation is in place, the system suffers si gnificant performance d egradation from the SCO -induced phase rotation, resulting in a poor BER of 2.24e-1. When the SCO is compensated using the method, the system performance improves remarkably, with the B ER dropping to 4.26e-4. Conclusion Optical fiber communications has revolutionized the entire telecommunications industry, and technological advances to date have a llowed the commercial deployment of high-speed lon g-haul optical transmission s y stems. Given the continued growth of data tr affic, these technologies are fast approachin g their practical limits. CO -OFDM super-channels offer a feasible solution to this problem without significantly increasing cost. I n this article, we have provided an overview of optical transmission systems and some of the important optical measurement parameters and techniques, which play a vital role in performance assessment, troubleshooting a nd improvement. Through measurements, we then experimentally demonstrated a bandwidth-efficient synchronization method for a CO-OFDM system. The measurements per formed on the s ystem demonstrate the robustness of the m ethod to ASE noise and PMD, where no ti ming errors have been observed, and accurate CFO and SCO estimation are achieved. References [1] L. Angrisani, D. Petri, and M. Yeary, “Instrumentation and measurement in communication systems,” IEEE Instrum. Meas. Mag ., vol. 18, no.2, pp. 4 – 10, Apr. 2015. [2] Optical Internetworking Forum, “Technolog y options for 400G implement ation,” OIF-Tech- Options-400G-01.0 (July 2015). [3] W. Shieh, H. Bao, and Y. Tang, “Coherent optical OFDM: theory and design,” Opt. Express , vol. 16, no. 2, pp. 841 – 859, Jan. 2008. [4] F. He and L. Wu, “ Timing and ranging models b ased on OFDM s ynchronization ,” in Proc. IEEE Int. Instrum. Meas. Technol. Conf. (I2MTC) , pp. 1-6, 2007. [5] O. Omomukuy o et al. , “Joint timing and frequency s ynchronization based on weig hted CAZAC sequences for r educed-guard-interval C O- OFDM s ystems,” Opt . Express , vol. 23, no. 5, pp. 5777-5788, Mar. 2015. [6] M. Golay, “Complement ary series,” IR E T rans. Inf. Theory , vol. IT-7, no. 2, pp. 82 -82, Apr. 1961. [7] S. Alamouti, “A simple transmit diversity t echnique for wireless communications,” IEEE J. Sel. Areas Commun . vol. 16, no. 8, pp. 1451-1458, Oct. 1998. [8] O. Omomukuyo et al. , “Robust frame and fr eq uency s ynchronization based on Alamouti coding for RGI- CO - OFDM,” IE EE Photon. Tec hn. Lett. , vol. 28, no. 24, pp. 2783-2786, Dec. 2016. [9] J.-W. Kim et al. , “Adaptive carrier f requency offset comp ensation for OFDMA systems,” in Proc. IEEE Int. Instrum. Meas. Technol. Conf. (I2MTC) , pp. 1-4, 2012. [10] O. Omomukuyo et al. , “Simple sampling clock synchronization scheme for r educed -guard- interval coherent optical OFDM s ystems,” IET Elect. Lett , vol. 51, no. 24, pp. 2026-2028, Nov. 2015. [11] A. Makki et al ., “Indoor localization using 802.11 time differences o f arrival,” IE EE Trans. Instrum. Meas. , vol. 65, no. 3, pp. 614-623, Mar. 2016.
Original Paper
Loading high-quality paper...
Comments & Academic Discussion
Loading comments...
Leave a Comment