Evaluation of PPG Biometrics for Authentication in different states
Amongst all medical biometric traits, Photoplethysmograph (PPG) is the easiest to acquire. PPG records the blood volume change with just combination of Light Emitting Diode and Photodiode from any part of the body. With IoT and smart homes' penetrati…
Authors: Umang Yadav, Sherif N Abbas, Dimitrios Hatzinakos
Evaluation of PPG Biometrics for A uthentication in differ ent states Umang Y adav Sherif N. Abbas Dimitrios Hatzinakos The Edward S. Rogers Sr . Department of Electrical and Computer Engineering, Uni versity of T oronto 10 Kings College Road, T oronto, ON, Canada, M5S 3G4. { umang,sseha,dimitris } @ece.utoronto.ca Abstract Amongst all medical biometric traits, Photoplethysmo- graph (PPG) is the easiest to acquir e . PPG recor ds the blood volume chang e with just combination of Light Emit- ting Diode and Photodiode fr om any part of the body . W ith IoT and smart homes’ penetration, PPG r ecor ding can eas- ily be integr ated with other vital wearable devices. PPG r epr esents peculiarity of hemodynamics and car diovascu- lar system for each individual. This paper pr esents non- fiducial method for PPG based biometric authentication. Being a physiological signal, PPG signal alter s with physi- cal/mental str ess and time. F or r ob ustness, these variations cannot be ignor ed. While, most of the pr evious works fo- cused only on single session, this paper demonstrates e xten- sive performance evaluation of PPG biometrics against sin- gle session data, differ ent emotions, physical e xer cise and time-lapse using Continuous W avelet T ransform (CWT) and Dir ect Linear Discriminant Analysis (DLDA). When evalu- ated on dif fer ent states and datasets, equal err or rate (EER) of 0 . 5% - 6% was achie ved for 45 - 60 s average training time . Our CWT/DLDA based technique outperformed all other dimensionality r eduction tec hniques and pr e vious work. 1. Introduction Risk of impersonation and violation in security of any system is e ver lasting threat. This risk can cause finan- cial ruins and, is also life threatening in today’ s Internet of Things (IoT) and Smart Home Era. Hence, need of low cost and non-in v asi v e authentication system has ne ver been greater . This is why in last two decades, biometrics re- search has emerged as very important area of research. Pho- toplethysmograph (PPG) is a non-in v asi ve electro-optical method which measures the volume of the blood flo wing through the body part under testing. It reflects the pulsati ve actions of the arteries through the interaction of the oxyge- nized hemoglobin and photons. It is belie v ed that e v ery per- son has unique hemodynamics and cardio v ascular system. Since, PPG captures this unique characteristics, this paper Figure 1: PPG recording with LED and Photo- Diode (PD) Time 0 0.2 0.4 0.6 0.8 Amplitude Dicrotic Notch Diastolic Peak Diastolic Point Systolic Peak Inter Pulse Interval Figure 2: Sample PPG Signal presents method to le v erage it for biometric authentication. PPG being a biological signal, it is harder to steal or repli- cate. It has advantages of inherent anti-spoofing and liv e- ness detection over traditional biometrics modalities. Also, as sho wn in Fig. 1 , PPG can be recorded with just combi- nation of LED and Photo-Diode (PD) from any part of the body , which provides greater flexibility for systems design. Since, PPG recording only requires LED and PD, it is very cost ef fecti ve compared to other biometric traits. In context of medical biometrics, PPG recording doesn’ t require any kind of gel (EEG), external stimulus (TEOAE) or multiple electrodes (ECG) and can be con v eniently recorded from virtually any part of body . All such factors give PPG bio- metrics extra edge on other medical biometrics traits. Apart from authentication, PPG can be used for many clinical applications such as measuring oxygen saturation, blood pressure, detecting peripheral vascular diseases etc. W earable device companies such as Fitbit TM are already us- ing PPG signals for Heart Rate(HR) measurements. PPG based biometric system can be integrated into such devices and smart homes’ IoT . Thus, PPG has inherent advantage of being portable and can giv e user unobtrusi v e experience. In practice, PPG signal is generally impaired by many common noise sources during acquisition such as motion artifacts, sensor movements, respiration, premature v entric- ular contraction (PVC) and ambient light. In addition, since PPG embodies proper functioning of heart, under physi- © 2018 IEEE. Accepted at 11th IAPR/IEEE International conference on Biometrics, 2018. This work has been supported by NSERC. cal and emotional stress, it changes along with Heart Rate (HR). Empirical comparison of PPG signal under rest con- dition and exercise shows considerable change in shape of PPG signal and its spectrum. Although indiscernible, it is also important to assess system performance under dif ferent emotions as they influence functioning of autonomic ner- vous system and heart. Furthermore, like any other biomet- ric traits, it is crucial to take into account long-term beha vior with time-lapse. In this paper , system performance is ev al- uated against all such v ariations using 3 different datasets. For PPG based authentication, many fiducial and non- fiducial based approaches ha v e been proposed in past. Fidu- cial based methods rely on detecting fiducial points of PPG signals sho wn in Fig. 2 such as systolic peak, diastolic peak, dicrotic notch, inter -pulse interval, amplitudes of peaks, etc. Giv en variability in PPG shape in different states, fiducial detection on raw PPG signal might be unsuccessful or incor - rect. Therefore, many researchers extended the idea to first deriv ati v e (FD) and second deri v ati ves (SD) of ra w PPG sig- nals and used similar points on FD and SD as features for authentication. For example, Kavsaoglu et.al. extracted 40 features from raw PPG, its FD and SD with kNN showed 94 . 44% accuracy [ 6 ]. On non-fiducial side, Spachos et.al. showed feasibility of PPG as biometrics identifier reporting 0 . 5% and 25% EER on two different datasets using tempo- ral features and LDA [ 10 ]. In most recent study , Karimian et.al. showed non-fiducial approach with D WT and kNN, reported 1 . 31% mean EER for 42 subjects [ 4 ]. Sarkar et.al. ev aluated variations with emotions using DEAP dataset by approximating PPG beat with sum of gaussians and showed accuracy of 90 . 53% for cross-emotions ev aluation [ 9 ]. Many of the previous methods ha ve been focused on fiducial approach. But fiducial points detection in every condition is error-prone. Therefore, in this paper non- fiducial approach is adopted. Also, most of the prior work has been focused on single session ev aluation. For robust- ness, it is important to check variability in different states. W e present Continous W av elet T ransform (CWT) and Di- rect Linear Discriminant Analysis (DLD A) based method for authentication. CWT re veals unique time-frequency be- haviour of each individual while DLD A selects CWT coef- ficients that gi v e maximum class separabillity . Such feature selection is necessary for better results against variations. Additionally , taking more pragmatic approach and training of model was limited to 45 − 60 seconds of signal and sys- tem performance was e v aluated for different length of au- thentication time. Section 2 and 3 present methodology and detailed de- scription of system comprising pre-processing, template creation and template matching. Section 4 presents e xper- imental results in different emotional states, exercise, rest condition and under time lapse. Section 5 concludes the paper with observations and future w ork. F i l t e r i n g P e a k D e t e c t i o n F a l s e P e a k R e m o va l Se g m e n t a t i o n P r e - p r o c e s s i n g C W T C o e f f i c i e n t s D i r e c t - L D A b a s e d D i m e n s i o n a l i t y r e d u c t i o n T e m p l a t e C r e a t i o n P e a r s o n s D i s t a n c e S ys t e m D a t a b a s e T e m p l a t e M a t c h i n g D e c i s i o n D a t a A c q u i s i t i o n Figure 3: System Flow Diagram 2. PPG A uthentication System and Methodology System flow is similar to many biometrics authentica- tion system. As shown in Fig. 3 system consists of the three main blocks; pre-processing, template creation and tem- plate matching. 2.1. Pre-processing • Filtering : Butterworth IIR Band pass filter of cutoff fre- quencies 0 . 5 - 5 Hz and order 38 has been applied on whole signal for the remo val of the po wer line interference, mo- tion artifacts, baseline wanders. After filtering amplitude was normalized to ha ve dynamic range of one. • Peak Detection : Successful application of pattern recog- nition techniques depends on reliable peak detection. Un- like ECG, there is no standard proven algorithm for sys- tolic peak detection in PPG. In practice, most of the lo- cal maxima finding algorithms work reasonably well with PPG. T o find peak locations, signal is first squared to em- phasize amplitude dif ference between local maxima and other points. Thereafter , peaks were detected based on amplitude prominence. • F alse Peak Removal : Many times motion artif acts, res- piration, ambient light falls into passband of filter . In such cases, filtering doesn’ t help. Also, filtering degrades the amplitude of PPG peaks and causes false peak detections. T o tackle this issue, simple false peak remov al technique based on distance w as employed. For an y healthy subject based on his/her age and physical acti vity state if heart rate (HR) found using distance between two peaks was outside of normal range of HR, then those peaks were re- mov ed. • Segmentation : For the features extraction, signal is seg- mented around detected peaks. Length of each segments is set using median HR found from signal. For giv en peak location i , segment can be represented as follo ws: S ( j, 1 ..... 2 r + 1) = S I G ( i − 2 r ....i + 2 r ) (1) where r is median HR calculated from signal, j is peak number , SIG is signal and S is segment. Since, each pulse segment covers, 3.5 to 4 pulses, it is larger in length and giv es better frequency resolution with CWT . Hence, this choice of length was found to be producing good results. Furthermore, each two consecutiv e segments in S were av eraged. This was necessary to improve SNR, damping any unwanted random noise as se gment size was larger . 2.2. T emplate Creation • F eatures Extraction : CWT has been selected for the fea- tures e xtraction. Unlike discrete wav elet transform, CWT giv es finer resolution without skipping samples. CWT re- veals unique details of time-frequency v ariations in a sin- gle person. In time domain, W a velet transform of signal is giv en by W T x ( a, b ) = 1 √ a ∞ Z −∞ x ( t ) . ψ ∗ t − b a dt (2) In our case, x ( t ) is a PPG segment. ψ ( t ) is mother wa velet which is basically bandpass filter that changes with scale factor a and translation b . By such trans- lation and scaling, mother wav elet separates mixed fre- quency components of given PPG segment. Since an- alytic wa velets are more suitable for oscillatory signal and morse wavelet can approximate many other analytic wa velets by selecting appropriate parameters, in exper - iments ‘ Analytic Morse’ wa velet was used as mother wa velet. • Dimensionality Reduction : Linear discriminant analy- sis (LD A) based dimensionality reduction was applied on features vectors generated in previous stage. CWT along with LD A emphasizes time-frequency behavior in such a way that it increases the inter subject variability and re- duces the intra subject v ariability . Such features selection is also important because PPG being physiological signal changes with time. Prior to dimensionality reduction, fea- tures were normalized on time axis using zero padding. Giv en a training set Z = { Z j } K j =1 containing K classes each having Z k = { z ki } N k i =1 where N k is number of feature vectors for each class k , LD A finds projection weight W that maximizes the fisher criterion function J ( W ) , J ( W ) = ar g max W | W T S b W | | W T S w W | (3) here S b and S w are the between class and within class scatter matrix respectiv ely defined as, S b = K X k =1 N k ( µ k − µ )( µ k − µ ) T (4) S w = K X k =1 N k X i =1 ( z ki − µ k )( z ki − µ k ) T (5) where µ k = 1 N k P N k i =1 z ki is mean of class Z k and µ is ov erall mean v ector . LD A finds W as m = K - 1 most sig- nificant eignev ectors of ( S w ) − 1 ( S b ) that corresponds to first m largest eigen v alues. After obtaining weight W , all the input training PPG segments are subjected to linear projection of ˜ z = W T z . In practice, number of features might be larger than number of training samples. In that case, LD A suf fers from small sample size problem. W e used Direct-LD A (DLD A) to address this issue[ 11 ]. Pro- jected training vectors ˜ z together with weight W is sav ed in gallery for template matching. 2.3. T emplate Matching Prior to template matching of test data, it is passed through all the blocks i.e. pre-processing and template cre- ation. W eights of the LD A is pre-saved from the training session and test feature vectors are projected in similar way . T emplate matching is carried out using Pearson’ s distance between training templates and test vectors. Pearson’ s dis- tance S p between two vectors a and b is defined as: S p ( a, b ) = 1 − cov ( a, b ) p cov ( a, a ) .cov ( b, b ) (6) where cov ( a, b ) is the cov ariance matrix of a and b . T est vector is accepted if S p ≤ thr eshold . 3. Other Implemented Methods Apart from DLD A, fe w other techniques were also im- plemented to reproduce and compare the results. • D WT/kNN : It is based on method presented in [ 4 ] by Karimian et.al. It is a non-fiducial method which uses D WT coefficients extracted using coiflet wav elet from PPG segment as features. It implements two steps pro- cess based on kolmogrov smirnov based correlation filter (ksCBF) and K ernel PCA (KPCA) to remov e correlated features and to reduce dimensionality . Classification is carried out using local density factor based kNN. • A C/LDA [ 3 ]: It is widely used in ECG based recognition system. It doesn’ t require peak detection in PPG. Instead, signal is blindly segmented into overlapping windo ws of predefined length. Then, normalized auto-correlation (A C) of each window is calculated as follo wing: ˆ R xx [ m ] = P N −| m |− 1 i =0 x [ i ] x [ i + m ] ˆ R xx [0] (7) where, x [ i ] represents windowed PPG sing al, x [ i + m ] de- layed PPG singal with time lag of m = 0 , 1 , 2 .....M − 1 and M << N . These A C windows are projected on lower dimensional space using LD A. Finally template matching is done with euclidean distance. T able 1: Capnobase dataset results with DLDA when ev aluated with different number of randomly selected consecutive test segments ( nT est ) and trained using only first 45 seconds. nT est 2 5 10 20 30 40 50 100 All mean EER 1.12% 1.09% 0.96% 0.85% 0.80% 0.80% 0.74% 0.58% 0.46% std. EER 0.44% 0.45% 0.38% 0.29% 0.27% 0.25% 0.21% 0.14% 0.00% T able 2: Capnobase dataset results with different methods when e valuated with All test se gments. Here std.EER is zero. Method CWT/DLD A CWT/KDD A Openset CWT/KPCA CWT/LD A CWT/PCA Karimian et.al. A C/LD A EER 0.46% 2.32% 2.50% 2.38% 2.32% 4.01% 1.51 ± 0.48% 4.82% • Openset V alidation : It follo ws same system as de- cribed in Fig. 3 except doing dimensionality reduction. In openset validation, CWT PPG feature segments are stored in gallery without subjecting them to dimensionality re- duction. During template matching, same process is fol- lowed and CWT features of claimed person is compared against CWT feature segments stored in gallery without projecting them to any lo wer dimensional space. • Other Subspace Lear ning T echniques : Apart from DLD A other subspace learning techniques such as PCA, LD A, KPCA and Kernel Direct Discriminant Analysis (KDD A) [ 8 ] were also implemented. For all of these tech- niques same system as Fig. 3 w as followed with DLD A di- mensionality block replaced with dif ferent technique. For both KPCA and KDDA, Gaussian k ernel was used. Re- duced dimensionality of all these techniques was set to N − 1 , where N is number of subjects in dataset. 4. Experimental Results and Discussion 4.1. Performance Metric The performance of all techniques was e valuated in ver - ification mode (1 to 1 matching). In this configuration, subject can claim an enrolled ID and based on matching score system rejects or accepts the claim. In this setting, error can be characterized by False Rejection Rate (FRR) and False Acceptance Rate (F AR). ROC (Recei ver Oper- ating Characteristic) curve plots FRR vs F AR for dif ferent operating points. Operating points are matching score or threshold v alues. Trade off appears between F AR and FRR. EER (Equal Error Rate) is an operating point on R OC where F AR=FRR. For experiments, EER is chosen as a metric to compare dif ferent techniques. In practice, choice of operat- ing point is application dependent. 4.2. Results In experiments, ev aluation strategy was designed such that it addressed the issues of robustness against different stress conditions, against time and speed. T o assess the system performance against all such conditions, three dif- ferent datasets were used. All of three datasets contained data recorded in single session, in different emotional stress, physical stress and data recorded after time-lapse. In exper- iments, we ran multiple simulations varying different pa- rameters such as CWT scale, segment length, distance met- ric etc. It was also found that using lar ger segment length gav e better results in general, since CWT gav e better fre- quency resolution. Se gment length was set based on me- dian HR such that it cov ered 3.5-4 cycles of PPG. In addi- tion, two consecuti ve time segments were a veraged. This reduced variance due to noise in larger segment and across whole period for one subject. Experimental results also sup- ported this hypothesis. One more engineering problem was to select number of scales from CWT to maximize discrim- ination while keeping feature vector small. It was found that choosing coefficients from only one scale, which filters signal between 1-2 Hz gav e better results. 1-2 Hz is also most prominent frequency range of PPG signal. Ho we ver due to div erse nature and different sampling frequency of each of three dataset, best CWT scale for classification was different for each of the three dataset. Another challenge is of speed. PPG is slower signal compared to traditional biometric traits and requires larger training and testing time. In e xperiments taking more prag- matic approach, average training time was limited between 45 − 60 s. On the other side to assess effect of limited au- thentication time, different number of test segments were selected to vary available test time. Experimental results for each of three dataset under various configurations is pre- sented in subsequent discussions. Capnobase dataset was used for single session ev aluation [ 5 ]. It consists of 8 minute single session data recorded in relax condition from 42 subjects. T raining time was fixed to first 45 s of signal, while different number of consecu- tiv e test se gments ( nT est ) were selected randomly o ver 50 iterations. EER was calculated for each iteration. T o select best scale, numerous experiments were carried out varying training time, nT est and CWT Scale. Based on these ex- periments 3 rd highest scale was chosen for further exper - iments. Similar experiments were also carried out to se- lect best scale for other two datasets. Results in T ab. 1 and 2 present mean EER and standard de viation in EER (std. 0 10 20 30 40 50 60 False Acceptance Rate(%) 0 10 20 30 40 50 60 False Rejection Rate (%) ROC curves comparisons for across emotion evaluation, DEAP dataset OpenSet Direct LDA Kernel PCA LDA PCA DWT/kNN AC/LDA Kernel Direct DA Figure 4: DEAP dataset R OC Curves EER) over 50 iterations for training time of 45 seconds only . CWT/DLD A performed better than ev ery other technique. During the experiments, it was found the increasing train- ing time decreased EER. Howe ver , drop wasn’t significant. Also, increasing testing time ( nT est ) also decreased EER. Nev ertheless, EER of 1 . 12 ± 0 . 44% was achie ved using 45 s of training and just 2 segments which required 6 - 7 s in time. Next, system was tested for emotional robustness us- ing DEAP Dataset [ 7 ]. DEAP dataset consists of data recorded in 40 different kinds of emotions spread over va- lence arousal plane for 32 subjects. Data was recorded on same day with short breaks and baseline emotional stim- uli in between. For each subject, model was trained us- ing data recorded in one type of emotion, that is total one minute of training of data and tested it against rest of the dataset. For each subject, dataset consisted of 39 genuine trials and 1240 (40 data samples from rest of the 31 sub- jects) imposter trials. EER was calculated ov er 40 itera- tion, each time model trained with different emotion. Here, nT est were not selected randomly , as test data were from different sessions. T ab . 3 presents mean EER and std. EER for DLD A. Remarkably , EER of 2.61 ± 1.14 % was achiev ed using 60s of training time and 2 test segments or 6 - 7 s of test time. Fig. 4 presents comparison of different techniques us- ing ROC curves. It can be noticed that all other techniques performed poorly compared to DLDA. Also CWT/DLD A produced better result than [ 9 ] on same dataset. Apart from emotions, PPG signal is susceptible to vari- ations due to exercise because of heart rate change. For ro- bust system, these variations can not be overlook ed. In ad- dition, as sho wn in Fig. 5 , PPG being physiological signal, changes with time. Therefore, consequences of ignoring it can be disastrous. Like all other biometrics traits, perma- T able 3: Across session ev aluation of DEAP Dataset using DLD A, nT est is number of selected test segments nT est 2 5 10 20 All Mean EER 2.61% 2.30% 2.13% 2.00% 2.11% std. EER 1.14% 0.97% 0.87% 0.82% 0.87% nence test on PPG is important. Since, no large dataset is av ailable in public to estimate the effect of physical stress and time-lapse, BioSec.Lab PPG dataset was developed at Univ ersity of T oronto [ 1 ]. PPG signals were recorded from fingertip using Plux Sensor o ver two sessions [ 2 ]. First ses- sion was conducted in two parts. First, PPG was recorded in relax condition for 3 minutes. Then subjects were asked to perform some form of intense ex ercise such as climb- ing up the stairs very fast to increase HR. PPG signal was again recorded for 3 minutes just after ex ercise. In total 41 subjects participated in first session. In second session, sig- nals were only recorded in relax condition for 3 minutes. T wo sessions were separated atleast 2 weeks apart in time. Howe ver only 34 subjects out of 41 participated in second session. For ev aluation, Model was trained using only ini- tial 45 seconds of relax data from first session. T o assess, effect of physical stress, model was then tested on exercise data with different nT est selected from the initial signal non- randomly . T o estimate time-robustness, again model was trained using 45 seconds of relax data from first session and then tested on session 2 data non-randomly . T ab . 4 presents results for each case where single session performance on 45 seconds of training data is included for comparison. From T ab . 4 , it can be observed that EER increased by 5% because of time-lapse and ex ercise when tested with whole signal. Howe ver , from Fig. 6 it can be seen that, CWT/DLD A performed far better than any other tech- nique. Surprisingly , D WT/kNN method, which performed very badly for DEAP dataset, had decreasing EER for BioSec.Lab dataset, across different sessions. This can be due to that fact that correlation based filter empolyed in this method does not take into account robustness of features across sessions while removing them. Hence it is possi- ble that because of reduced number of features, DWT/kNN gav e decreasing error across 2 sessions for BioSec.Lab dataset, but on av erage when tested across 40 sessions in DEAP dataset, it performed worst. Also, ideally EER should decrease with increase in nT est . This trend is vis- ible in T ab. 1 . But in T ab. 3 and T ab . 4 , it is not consistent. This is due to the quality of samples. For example in T ab. 4 across exercise, nT est = 20 has lower EER compared to All test segments. Because, it is possible that whole test sig- nal (all segments) would have more deviated samples under physical or mental stress compared to only subset (e.g. 20 segments) of test signal. 0 50 100 150 200 250 0 0.5 1 Data from subject 25 in session1 0 50 100 150 200 250 0 0.5 1 subject 25 in session2 0 50 100 150 200 250 0 0.5 1 Data from subject 5 in session1 0 50 100 150 200 250 0 0.5 1 subject 5 in session2 0 50 100 150 200 250 0 0.5 1 subject 25 after doing exercise 0 50 100 150 200 250 0 0.5 1 subject 5 after doing exercise Figure 5: V ariations in PPG signal with exercise and time- lapse for BioSec.Lab PPG dataset Comparison of performance for different methods for BioSec.Lab PPG dataset DLDA KPCA PCA LDA KDDA AC/LDA DWT/kNN Openset 0 5 10 15 20 25 30 35 40 45 50 mean EER (%) Single Session After Exercise After Time-Lapse Figure 6: Comparison of EER in different cases T able 4: BioSec.Lab PPG Dataset results using CWT/DLD A using only 45s of training data, here nT est is number of selected test segments. nT est 2 5 10 20 All Single Session Evaluation Mean EER 1.05% 1.00% 0.97% 0.86% 0.86% std. EER 0.22% 0.18% 0.17% 0.02% 0.02% Across Exercise Ev aluation EER 2.50% 2.50% 2.95% 2.50% 5.00% Across Session Evaluation EER 6.86% 8.65% 8.82% 8.82% 5.88% 5. Conclusion In this paper, CWT/DLD A based method was presented for PPG based authentication. By nature, CWT rev eals id- iosyncratic time-frequency behavior of PPG for each indi- vidual. T o get holistic understanding, method was ev alu- ated for dif ferent datasets under different conditions. It was found that, system performed better with larger training and testing time. Howe ver by considering more practical sce- nario training time was fixed to only 45-60s. Better results of our method compared to previous works is attributed to the fact that, analytic wav elet are more suitable for oscil- latory signals compared to non-analytic and DLD A boosts system performance by only choosing features that maxi- mizes discriminality in class specific way . It w as found that, physical stress and time-lapse has adverse ef fect on system. In future, we plan to address these issues with more ro- bust feature selection, continuous authentication and train- ing model under many dif ferent conditions. References [1] Biosec.lab ppg dataset. http://www.comm. utoronto.ca/ ˜ biometrics/PPG_Dataset/ . [2] Pulse sensor . https://store.plux.info/ bitalino- sensors/42- pulsesensor.html . Last accessed on 21 Dec 2017. [3] F . Agrafioti and D. Hatzinakos. Ecg based recognition using second order statistics. In 6th Annual Communication Net- works and Services Resear ch Confer ence (cnsr 2008) , pages 82–87, May 2008. [4] N. Karimian, M. T ehranipoor, and D. Forte. Non-fiducial ppg-based authentication for healthcare application. In 2017 IEEE EMBS International Conference on Biomedical Health Informatics (BHI) , pages 429–432, Feb 2017. [5] W . Karlen, S. Raman, J. M. Ansermino, and G. A. Dumont. Multiparameter respiratory rate estimation from the photo- plethysmogram. IEEE T ransactions on Biomedical Engi- neering , 60(7):1946–1953, July 2013. [6] A. R. Kavsaolu, K. Polat, and M. R. Bozkurt. A novel fea- ture ranking algorithm for biometric recognition with ppg signals. Computers in Biology and Medicine , 49:1 – 14, 2014. [7] S. Koelstra, C. Muhl, M. Soleymani, J. S. Lee, A. Y azdani, T . Ebrahimi, T . Pun, A. Nijholt, and I. Patras. Deap: A database for emotion analysis using physiological signals. IEEE T ransactions on Affective Computing , 3(1):18–31, Jan 2012. [8] J. Lu, K. N. Plataniotis, and A. N. V enetsanopoulos. Face recognition using kernel direct discriminant analysis algo- rithms. IEEE T ransactions on Neural Networks , 14(1):117– 126, Jan 2003. [9] A. Sarkar , A. L. Abbott, and Z. Doerzaph. Biometric authen- tication using photoplethysmography signals. In 2016 IEEE 8th International Confer ence on Biometrics Theory , Appli- cations and Systems (BT AS) , pages 1–7, Sept 2016. [10] P . Spachos, J. Gao, and D. Hatzinakos. Feasibility study of photoplethysmographic signals for biometric identifica- tion. In 2011 17th International Conference on Digital Sig- nal Pr ocessing (DSP) , pages 1–5, July 2011. [11] H. Y u and J. Y ang. A direct lda algorithm for high- dimensional data with application to face recognition. P at- tern Recognition , 34(10):2067 – 2070, 2001.
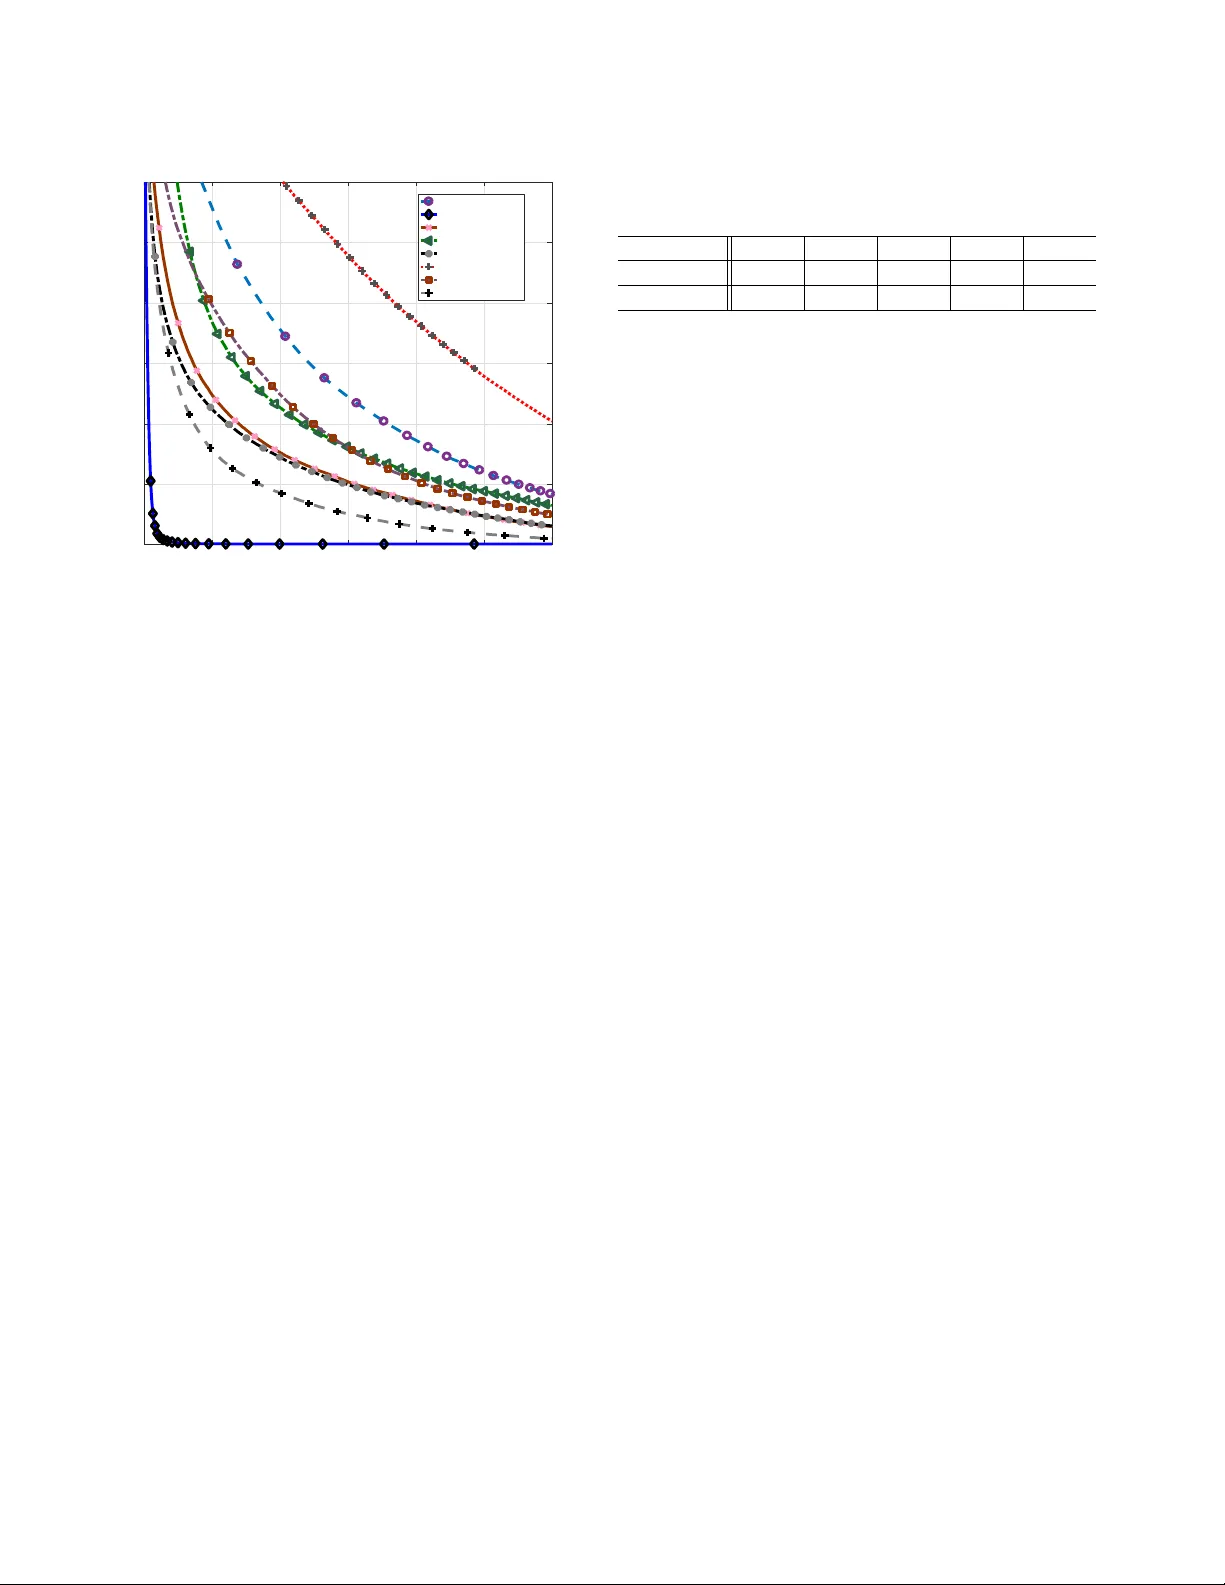
Original Paper
Loading high-quality paper...
Comments & Academic Discussion
Loading comments...
Leave a Comment