A practical guide and software for analysing pairwise comparison experiments
Most popular strategies to capture subjective judgments from humans involve the construction of a unidimensional relative measurement scale, representing order preferences or judgments about a set of objects or conditions. This information is generally captured by means of direct scoring, either in the form of a Likert or cardinal scale, or by comparative judgments in pairs or sets. In this sense, the use of pairwise comparisons is becoming increasingly popular because of the simplicity of this experimental procedure. However, this strategy requires non-trivial data analysis to aggregate the comparison ranks into a quality scale and analyse the results, in order to take full advantage of the collected data. This paper explains the process of translating pairwise comparison data into a measurement scale, discusses the benefits and limitations of such scaling methods and introduces a publicly available software in Matlab. We improve on existing scaling methods by introducing outlier analysis, providing methods for computing confidence intervals and statistical testing and introducing a prior, which reduces estimation error when the number of observers is low. Most of our examples focus on image quality assessment.
💡 Research Summary
The paper presents a comprehensive, practical guide for analyzing data obtained from pairwise comparison experiments, together with an open‑source MATLAB toolbox that implements the described methods. The authors begin by contrasting pairwise comparison with direct rating approaches (e.g., Likert or cardinal scales). Direct rating requires careful training, suffers from large inter‑ and intra‑observer variability, and often yields incomparable scales across sessions or distortion types. In contrast, pairwise comparison offers a simple binary decision task, avoids calibration problems, provides higher sensitivity and lower measurement error, and can be accelerated with adaptive or incomplete designs.
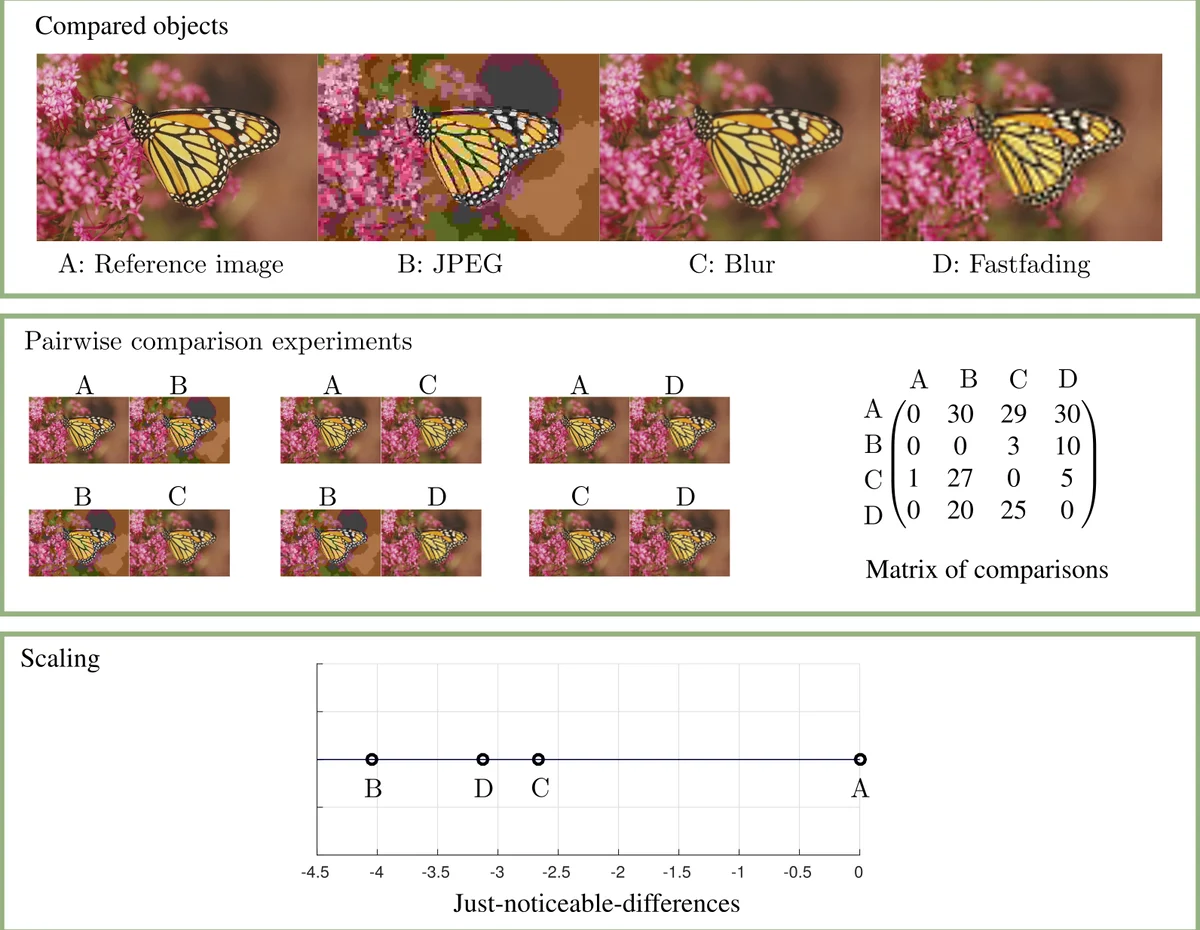
The core of the methodology is the conversion of raw comparison logs into a set of observer‑specific comparison matrices M, where each entry cᵢⱼ records how many times condition i was preferred over condition j. The first condition (often a reference stimulus) is fixed at zero quality, establishing an absolute anchor. Scaling is performed using a Thurstone model (Gaussian latent preference) or equivalently a Bradley‑Terry model (logistic latent preference) via maximum‑likelihood estimation (MLE). To mitigate over‑fitting when the number of observers is small, the authors introduce a Bayesian prior centered at zero with a modest variance; this prior shrinks estimates toward the anchor and markedly reduces estimation error for experiments with fewer than about ten participants.
Three major enhancements over standard scaling pipelines are introduced:
-
Outlier detection – The function
pw_outlier_analysiscomputes the log‑likelihood of each observer’s data and a normalized distance score L_dist. Observers with L_dist above the conventional 1.5 IQR threshold are flagged as potential outliers. Rather than automatically discarding them, the toolbox providescompare_probs_observerto plot the observer’s selection probabilities against the rest of the cohort, allowing a qualitative assessment of consistency. -
Confidence intervals via bootstrapping – The
pw_scale_bootstrproutine performs non‑parametric bootstrap resampling of the comparison matrices, yielding a distribution of quality scores for each condition. From these distributions, 95 % confidence intervals are derived. The authors stress that these intervals convey estimation uncertainty but should not be used directly for hypothesis testing of pairwise differences. -
Statistical testing and visualization – Using the bootstrap statistics,
pw_plot_ranking_trianglesdraws a triangular matrix where solid lines indicate statistically significant differences (non‑overlapping confidence intervals) and dashed lines indicate non‑significant comparisons. This visual cue makes it easy to identify which conditions are truly distinguishable.
The toolbox also gracefully handles incomplete designs (where not every pair is presented) and tie options (allowing a “no preference” response). Incomplete designs are accommodated because the MLE formulation naturally works with missing entries, and ties can be modeled either by splitting a vote or by extending the likelihood with an additional parameter.
A concrete example is provided using a video tone‑mapping evaluation dataset (Eilertsen et al., 2013). The authors demonstrate data import from CSV, outlier analysis (identifying one observer with a high L_dist), scaling with bootstrap confidence intervals, and the final ranking plot. The example shows that the scaled quality scores correlate better with direct rating scores than simple vote counts, confirming the advantage of continuous scaling.
In the related‑work section, the paper surveys a large body of literature on pairwise comparison aggregation, noting classic references (Thurstone 1927, Bradley‑Terry 1952) and modern extensions (ties, covariates, temporal dynamics). It contrasts existing R packages (eba, prefmod, BradleyTerry2, choix) with the proposed MATLAB toolbox, emphasizing that none of the existing packages combine outlier detection, Bayesian priors for low‑sample scenarios, and bootstrap confidence intervals in a single, user‑friendly environment.
Overall, the contributions are: (i) a unified collection of analysis tools (outlier detection, confidence intervals, statistical testing); (ii) a Bayesian prior that improves accuracy for small observer groups; (iii) practical guidance on experimental design issues such as ties and incomplete designs; and (iv) a publicly available MATLAB implementation. By delivering a complete end‑to‑end pipeline, the paper equips researchers in image/video quality assessment, consumer preference, sports ranking, and other domains with a robust, reproducible method for turning binary preference data into meaningful, statistically sound quality scales.
Comments & Academic Discussion
Loading comments...
Leave a Comment