An Extended Kalman Filter Enhanced Hilbert-Huang Transform in Oscillation Detection
Hilbert-Huang transform (HHT) has drawn great attention in power system analysis due to its capability to deal with dynamic signal and provide instantaneous characteristics such as frequency, damping, and amplitudes. However, its shortcomings, includ…
Authors: Zhe Yu, Di Shi, Haifeng Li
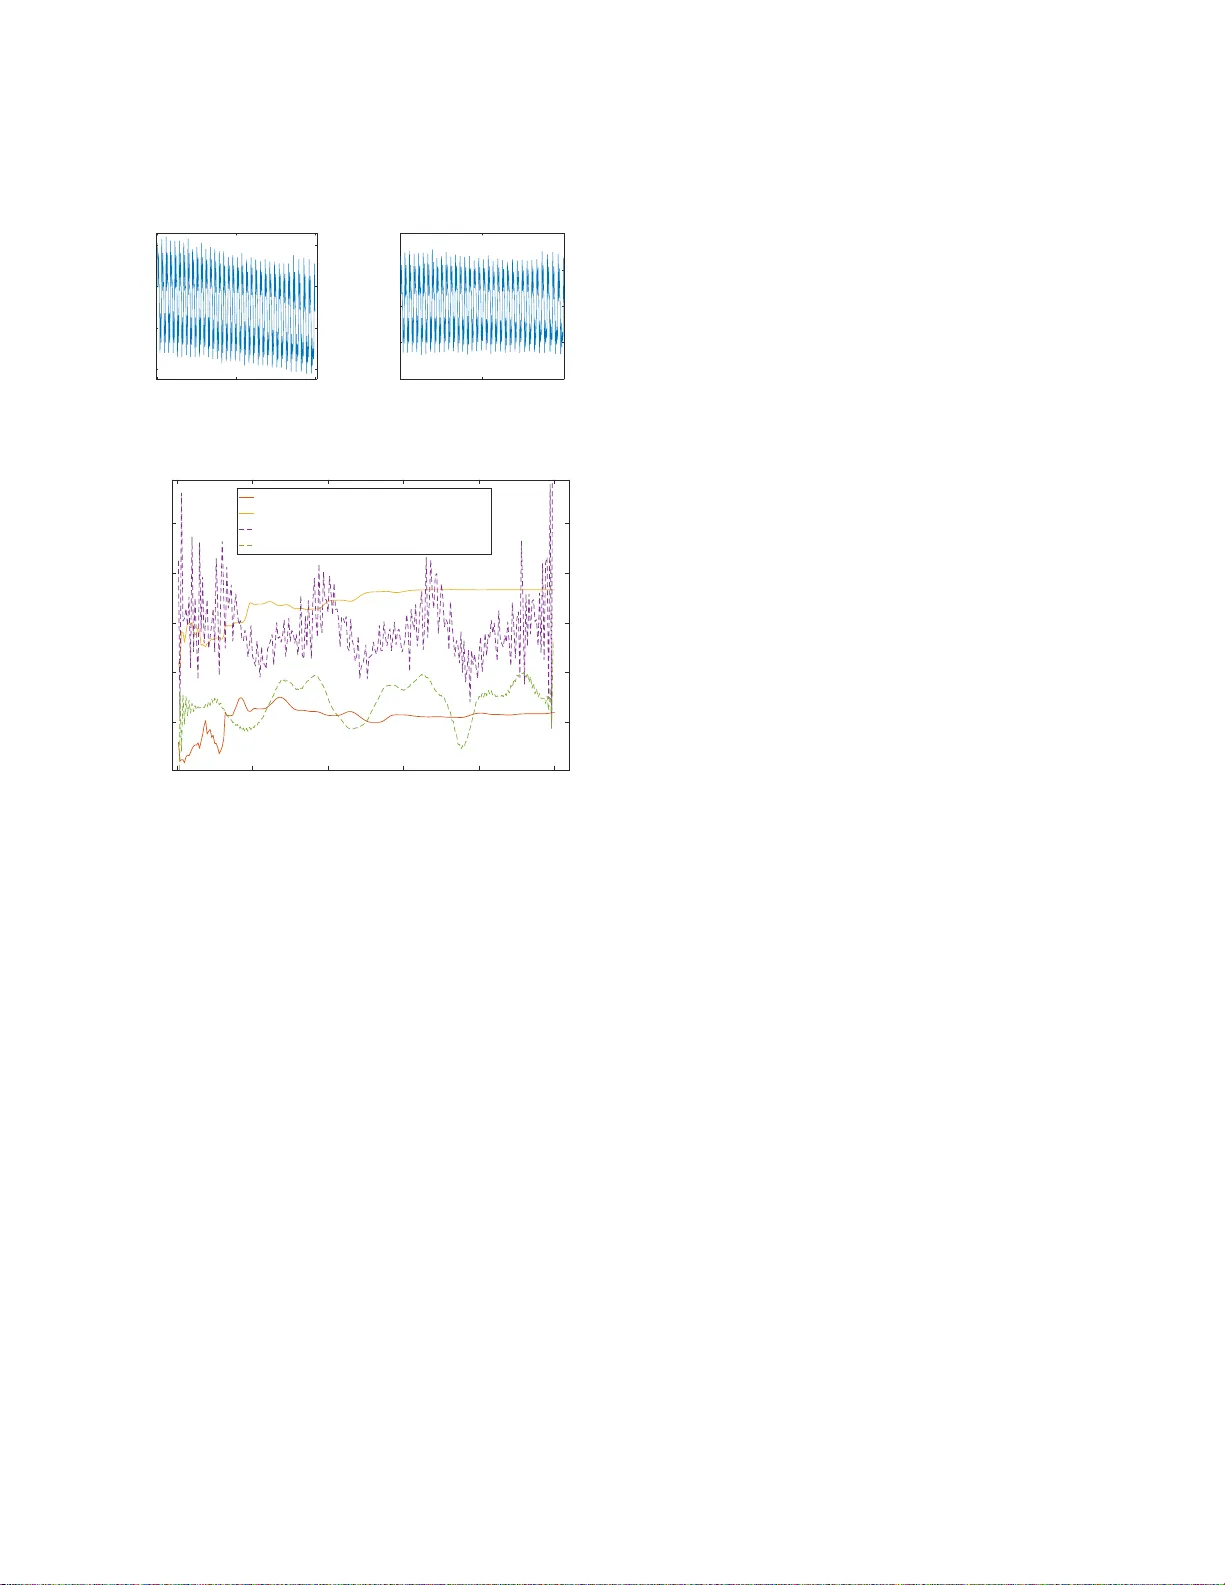
An Extended Kalma n Filter Enhanced Hilbert-Huang T ransform in Oscill ation Detect ion Zhe Y u ∗ , Di Shi ∗ , Haifeng Li † , Y ishe n W a ng ∗ , Zhehan Y i ∗ , Zhiwei W ang ∗ ∗ GEIRI North America † State Grid Jiangsu Electric Power Company zhe.yu@ge ir ina.net Abstract —Hilbert-Huang transfo rm (HHT) has drawn gr eat attention i n power system analysis d ue to its capabi lity to deal with dynamic signal a nd provide instantaneous characteristics such as fr equency , damping, and amplitudes. Ho wever , its short- comings, includin g mode mixing and end effects, are as significant as its advantages. A preliminary result of an extend ed Kalman filter (EKF) method to enhance HHT and hopefully to over come these d isadvantages is presented in this p aper . The proposal fi rst remo ves dynamic DC components in signals using empirical mode decomposition. Then an EKF model is applied to extract instant coefficients. Nu merical results using simulated and real-world low-fre quency oscillation data suggest the proposal can help to ov ercome the m ode mixing and end effects with a p roperly chosen number of modes. Index T erms —Extend ed Kalman filter , Hilb ert-Hu ang trans- fo rm, oscillation detection, phasor measurement unit. I . I N T R O D U C T I O N P O WER systems ha ve enco untered a growing number of abrupt and violent dynamics due to the increasing of devices with fast chan ges, e.g., r e new able energy [1], distributed g enerators [2], energy sto r age [3]. Th is tren d makes new tech nologies w ith higher resolution s and capabil- ity of dealing w ith non -stationary systems essential. Wide- area measureme n t system (W AMS) technolog y u sing phasor measuremen t units (PMUs) provides a p ossibility to monitor fluctuations in power g rids and supply serv ices, e.g., low- frequen cy oscillation detection , th a t conventional supervisory control an d da ta a cquisition (SCADA) systems are not capab le of. W ith the gr owth in size o f intercon nected power s ystems an d participation of unsynchr onized distributed e nergy r esources, the p henome n on o f o scillation b e comes widespr e ad and com- mon, sometimes with non- stationary vibration s. Insufficient damped oscillatio n s reduce the system ma rgin and increase the risk of instability and cascading failure. Fast and pre c ise detection makes it p ossible to take tim ely respo nse. Accur a te estimation of mode co efficients provides vital infor mation to identify event categories and locations. However , the rap id and dramatic dy namics of power sy stems make it challen ging to update the oscillation infor m ation reliably . There is extensiv e literature on oscillation detection and estimation. Some of the well-known method s in clude matrix- pencil m e thod (MP) [4], [5], eigenv a lu e rea liza tio n algorithm This work was funded by SGCC Science and T echnology Program under contrac t No. 5455HJ160007. (ERA) [6], [7], Han kel to tal least-squares (HTLS) [8], Prony methods [9 ], [1 0], an d extend e d Kalman filter [1 1], [ 12], [1 3]. Most o f the se metho ds assume that the o scillatio n signal is stationary , which is n ot practical in ge neral. Dealing with real- world PMU data, these metho ds often suffer f r om tim e-variant frequen cies, sudden jump s in mea su rements, and window size selections, which limit their o nline app lications. Hilbert-Huan g transfo rm (HHT) ha s b een applied to power quality analysis with good p erforman ce [1 4]. It was first propo sed in [15] an d ap plied to oscillation an alysis in power systems by [16]. The cap a b ility of d ealing with non-station a ry and nonline ar systems makes it suitable for fast c hanging signals. H owever , there are several significant dr awbacks of HHT . First, it can n ot sepa r ate closely locate d frequ encies well, while in power systems, frequen cies of oscillations typ ically distribute in a narrow b and[17]. Second, the end effects of empirical m ode decom p osition ( EMD) makes the results on both end s of the data set meaning less. La st but n ot least, HHT is based on lo cal characteristics which makes it sensitive to not on ly signal dynam ics but also no ises. A. Su mmary of results T o overcome the disadvantages of HHT , an extended Kalman filter (EKF) a p proach is co mbined with HHT . Hilbert- Huang tran sform is first app lied to o scillation signa ls to remove the p ossible d ynamic DC compon ents. Then th e sum of IMFs are fed to EKF to extract coefficients of oscillatio n s. The oscillation signal is first formu lated in a nonlin ear mod el with instantaneo us amplitu de, fre q uency , and damp ing as the system states. The initial estimate an d ord er of model can be determined b y th e HHT results. Giv en these coefficients, the instantaneou s frequ encies and damp ing factors can be direc tly estimated. Th e p erforman ce o f p roposal is exam in ed by non - stationary data sets. I I . R E V I E W O F H I L B E RT - H UA N G T R A N S F O R M The Hilb ert-Huang transfor m [15] co mbines the emp irical mode decompo sition an d the Hilbert spectral ana ly sis. It first breaks down signals into various intrin sic mod e function s (IMFs), which for m s a com plete an d near-orthogo nal basis for th e o riginal signals. Th en Hilbert spectral analysis is applied to each IMF to extract instantan eous frequency . HHT is adap ti ve and highly efficient dealing with time series. The decomp o sition is based on the lo c al chara c te r istics of data thus 2 it is suitab le fo r no nlinear and non -stationary processes. The standard EMD pro cess is sum marized in Algor ith m 1. Algorithm 1 Emp irical Mode De c o mposition 1 . Set the origin a l sig n al as r 0 and i = 1 . 2 . While the numb er of extrem a in r i − 1 is larger than 2 • Set j = 1 an d h j = r i − 1 . • While h j does no t satisfy IMF criterias [15] – Find successive peaks and valleys o f h j . – In terpolate peaks and valle ys with a cubic spline to form upper an d lower env elops e u and e l – Obtain a new estimate h j +1 = h j − ( e u + e l ) / 2 and j = j + 1 . end • Get IMF c i = h j and r esidue r i = r i − 1 − c i . Set i = i + 1 . end 3 The o riginal signal is decompo sed as r 0 = P i k =1 c k + r i . In eac h iteration of EMD, interpo lation is used to fo rm upper and lower env elopes of the signal. Howev er , during the interpo lation, at least on e data p oint outside each end of the d ata set is r equired to o b tain stab le spline. If n ot ch osen proper ly , th e extend ing data points would cause vibr ation and distortion in envelopes, refe r red to as end effects, and make the IMF meanin gless. V ariant attempts have be e n mad e to improve th e en d effects in EMD. A linea r interp olation is first used to p r edict the extrema ou tside the data set, af ter which a mirr oring app roach is pro posed in [18]. The mirr oring approa ch reflects the data at b oth end s and forms en velop es using the reflected sign al. Then the tr u ncation o f th e longed envelop is used a s th e ones of the original sign al. A least square po lynomial extending is p r esented in [1 9]. In [20], au thors pro posed a constrained cubic spline to mitigate overshoot phen omenon . Howe ver, the estimation error of the extrema beyond the end still tro ubles HHT . Another pr o blem o f applyin g HHT in oscillation detection is mo de mixing . In each iteration o f EMD, o n ly the h ighest frequen cy co mponen t is design e d to be extracted. Howe ver , the narrow band o f low-frequency oscillation (0. 1-2.5Hz ) in p ower systems m akes HHT hard to distingu ish different frequen cy compo nents. M ultiple freq uency co mponen ts are typically mixed in one I MF , which ma kes the f ollowing Hilbert transform m eaningless. Great efforts h ave bee n in vested in impr oving HHT . In [21], [ 22], au th ors prop osed EMD with masking tech niques. It analyz es th e origin al signal using FFT and ad ds a mask in g signal u sin g the hig hest freq uency in the orig in al one. Then EMD is carried out to th e modified signal, and th e hig hest frequen cy comp onent is extracted . Similar app roaches are presented in [2 3] and [24]. Another appro ach is ensemble empirical mode d ecompo sition (E EMD) [ 25]. Th e gen eral idea is to add white n oise to the original signal and g enerate more samples. Then EMD is app lied to each new sample, and the (en sem ble) means of correspo nding I MFs are ob tained as the final result. The added white no ises cance l each o ther and sign ificantly red uce the mod e mixing . Howe ver, these approa c h es are not de sig n ed p a rticularly fo r p ower system oscillation detec tion, where the fr equencies locate clo sely and the dynamic is relatively slow . Thus the perform ance is far from satisfaction. I I I . A N E X T E N D E D K A L M A N F I LT E R E N H A N C E M E N T T o overcome the mo de mixin g and end effects p roblems o f HHT while inh eriting the cap ability of dealin g with dy namics in sign als, an extend ed Kalman filter app roach is pro posed. The extende d Ka lm an filter metho d of oscillation detection was first pr oposed in [11] unde r the stationary assump tio n. A multi-ch a nnel extensio n was dev e loped in [26]. Here, we extend the a lgorithm in a dynam ic context an d exam in e its perfor mance in instantaneo us coefficients estimation. The EKF algorithm provides more smooth an d a c curate instanta n eous estimations a nd is able to distingu ish closely lo cated f requen- cies. W ith pro perly chosen co e fficients, the EKF can also provide convergent estimation thus overcomes the end effects. The algo rithm is sh own in Algo rithm 2. Algorithm 2 An Extended Kalman Filter enhanced HHT 1 . App ly EMD to th e oscillation signal and g et IMFs. 2 . Su m all IM Fs besides the DC compo nent ( < 0 . 1 Hz ) to construct a new signal y = P i k =1 c k . 3 . Determine the number of mode and initial estimate of EKF . 4 . App ly the EKF to ana lyze the new sign al y . In this section, we present h ow to model a n oscillation signal into a system state mo del and h ow to use the EKF to estimate the instantan eous frequ encies. A. System State Model Here we consider a d iscrete system where y [ k ] represents signal y at the k th tim e instant. After rem oving the DC com- ponen t, the r econstructed signal y from Step 2 of Algo rithm 2 can be expressed as f ollows. y [ k ] = P L l =1 A l exp( − σ l [ k ] k f s ) cos( ω l [ k ] k f s + φ l ) + ε [ k ] , (1) where L is the n umber of oscillation modes, A l ∈ R the amplitude o f mo de l , σ l [ k ] the d amping factor , ω l [ k ] the instantaneou s freq uency , φ l the phase angle, f s the sam p ling rate, and ε [ k ] the measuremen t err or . The me a surement noise is assumed to b e a white Gaussian noise with zero m ean and standard deviation R k . Inspired by [11], we formulate a no n linear sy stem whose states con tain frequen cies and dampin g factors of the oscilla- tion mo des. Consider a sinuso id signal as follows. s l [ k ] , A l exp( − σ l [ k ] k f s ) cos( ω l [ k ] k f s + φ l ) = exp( − σ l [ k ] k f s ) A l [cos( ω l [ k ] k f s ) cos( φ l ) − sin( ω l [ k ] k f s ) sin( φ l )] = exp( − σ l [ k ] k f s )[ B c l cos( ω l [ k ] k f s ) + B s l sin( ω l [ k ] k f s )] , 3 where B c l , A l cos( φ l ) and B s l , − A l sin( φ l ) . Consider the ev olu tio n of the sinuso id signal as fo llows. s l [ k + 1] = exp( − σ l [ k +1]( k +1) f s ) B c l cos( ω l [ k +1]( k +1) f s ) + exp( − σ l [ k +1]( k +1) f s ) B s l sin( ω l [ k +1]( k +1) f s ) = B c l [cos( ω l [ k +1] k f s ) cos( ω l [ k +1] f s ) − sin( ω l [ k +1] k f s ) sin( ω l [ k +1] f s )] + B s l [sin( ω l [ k +1] k f s ) cos( ω l [ k +1] f s ) + co s( ω l [ k +1] k f s ) sin( ω l [ k +1] f s )] × exp( − σ l [ k +1] f s ) exp( − σ l [ k +1] k f s ) . Define system states as in stantaneous magnitud es, frequ en- cies, an d dam p ing factors as follows. x l [ k ] , x c l [ k ] x s l [ k ] x ω l [ k ] x σ l [ k ] = B c l exp( − σ l [ k ] k /f s ) cos( ω l [ k ] k /f s ) B s l exp( − σ l [ k ] k /f s ) sin( ω l [ k ] k /f s ) ω l [ k ] σ l [ k ] The state transition is presented as follows. x c l [ k + 1] = exp( − x σ l [ k ] f s ) cos( x ω l [ k ] f s ) x c l [ k ] − exp( − x σ l [ k ] f s ) sin( x ω l [ k ] f s ) x s l [ k ] + ǫ c l [ k ] , x s l [ k + 1] = exp( − x σ l [ k ] f s ) x c l [ k ] sin( x ω l [ k ] f s ) + exp( − x σ l [ k ] f s ) x s l [ k ] cos( x ω l [ k ] f s ) + ǫ s l [ k ] , x ω l [ k + 1] = x ω l [ k ] + ǫ ω l [ k ] , x σ l [ k + 1] = x σ l [ k ] + ǫ σ l [ k ] , (2) where ǫ is the system no ise. Here we assume the frequ ency and damp ing o f the oscillation ch ange are slow comparin g to the sample rate, which is reason able in power systems. Define the state of the system as x [ k ] = x 1 [ k ]; · · · ; x L [ k ] which has a dim ension of 4 L - b y-1. W e can write the tr a n sition in a ge n eral form as fo llows. x [ k + 1] = f ( x [ k ]) + ǫ [ k ] , where th e transition fun ction f ( · ) is nonlin ear and can b e derived from equ ation (2). W e assume that ǫ [ k ] is a white Gaussian no ise with zero me an and covariance matrix Q k . The measuremen t equation (1) can be written as y [ k ] = P L l =1 ( x c l [ k ] + x s l [ k ]) + ε [ k ] . In a mo re co mpact form , we o btain the observation function as follows. y [ k ] = H x [ k ] + ε [ k ] , where H = [1 1 0 0 1 1 0 0 · · · ] . The c o nstructed system is summarized as follows. x [ k + 1] = f ( x [ k ]) + ε [ k ] , y [ k ] = H x [ k ] + ǫ [ k ] . (3) B. Exten ded Kalman F ilter Giv en the system eq uations (3), we app ly an extended Kalman filter to e stima te system states. Arou nd the current estimated state, the EKF app roximates the non linear system by a fir st-o rder linearizatio n and app lies a Kalman filter to the lin earized system to find the optimal Kalman gain. The nonlinear system mo del and new measurements are used to calculate ne w state p redictions. This p rocess iter ates and the state space mo del is re- lin earized ar o und u pdated state estimates. Let ˆ x [ k | j ] d enote the minimu m mean squared error estimate of x [ k ] given measuremen ts u p to and includ ing time j and P [ k | j ] the covariance matrix of the estimatio n e r ror . Starting from the initial estimate ˆ x [0 | − 1 ] and P [0 | − 1] , the iteration of th e extended Kalman filter f or the system equation (3) is summarized in Algorith m 3. Algorithm 3 Extende d Kalman Filter (EKF) 1 . In itialize ˆ x [0 | − 1] and P [0 | − 1] . 2 . For k = 0 : N − 1 S = R k + H P [ k | k − 1] H T K = P [ k | k − 1] H T S − 1 ˆ x [ k | k ] = ˆ x [ k | k − 1] + K ( y [ k ] − H ˆ x [ k | k − 1]) P [ k | k ] = P [ k | k − 1] − K H P [ k | k − 1] ˆ x [ k + 1 | k ] = f ( ˆ x [ k | k ]) P [ k + 1 | k ] = F k P [ k | k ] F T k + Q k End Here F k = ∂ f ( x ) ∂ x | x = ˆ x [ k | k ] is the lin e arization of the system, and N is th e time length of measur ements. The p rediction process f ( ˆ x [ k | k ]) is stated as follows. ˆ x c l,m [ k + 1 | k ] = exp( − ˆ σ l [ k | k ] f s )[ ˆ x c l,m [ k | k ] cos( ˆ ω i [ k | k ] f s ) − ˆ x s l,m [ k | k ] sin( ˆ ω i [ k | k ] f s )] , ˆ x s l,m [ k + 1 | k ] = exp( − ˆ σ l [ k | k ] f s )[ ˆ x c l,m [ k | k ] sin( ˆ ω i [ k | k ] f s ) + ˆ x s l,m [ k | k ] cos( ˆ ω i [ k | k ] f s )] , ˆ x ω l [ k + 1 | k ] = ˆ x ω l [ k | k ] , ˆ x σ l [ k + 1 | k ] = ˆ x σ l [ k | k ] . C. Coefficient Cho ice The accuracy of EKF relies heavily o n the choice of initial estimate and ord er o f the system m odel. In the con text of oscillation e stimation, a Fast Fourier Transform (FFT) or other similar technolo gy can b e em ployed as a trigge r , a n d the result can be used as a choice of initial poin ts. FFT can estimate the spe ctra of sinusoids with limited mea su rements and alarm the oper ator with poten tial oscillation s if the energy o f some frequen cy differs from noises significantly . These results can be used as inputs to A lg orithm 3, an d E KF will estimate the fund a mental frequ ency and dampin g factors. Another possible ch oice is to use the results of HHT . The instantane o us frequen cy an d damping results from Hilbert transfor m can b e used as the initial estimate and fed in th e EKF . The p roposed EKF a lg orithm is a model-b ased meth od, a nd its perfo rmance relies o n the pro per cho ice of coefficients. T unin g o f the covariance ma trix of n oise, Q k and R k , is the major appr oach to adjust the per formanc e of EKF . A large Q k or a small R k usually causes fluctua tio n around the actu a l value, while a small Q k or a large R k normally results in poo r tracking. In th is work , the tuning of coefficients is based on heuristics. I V . N U M E R I C A L R E S U LT S In this section, we present numerical resu lts using bo th simulated and real PMU data collected from real-world system 4 T ABLE I C L O S ELY L O C ATE D F R EQ U E N C I E S : Q k = 10 − 9 I , R k = 10 − 3 . Method MSE ω 1 MSE ω 2 Mixing rate HHT 10 . 00 7 . 62 85 . 9% Masking 7 . 84 9 . 00 32 . 2% EKF 1 . 99 2 . 77 14 . 7% oscillation events. W e first a pply the propo sed alg orithms on noisy rin g down sinusoid sign a ls and comp are the accur a cy of the propo sed algo rithms with HHT an d HHT with masking enhancem ent [ 21]. Af ter that, real o scillation d ata from Jian gsu Electric Power Company in China are examined. A. Closely Located F r eq uencies In this case, the measureme n t is two exponentially dam p ed sinusoids with a zero- mean white Gau ssian noise as f ollows. y [ k ] = 2 X l =1 exp( − σ l k f s ) cos( ω l k f s + φ l ) +5 × 1 ( k > N 2 )+ ε [ k ] , where the freq u encies are ω 1 = 2 π rad /s and ω 2 = 3 π rad /s, the damping factors are σ 1 = − 0 . 1 and σ 2 = 0 . 0 1 , the phase angles a re φ 1 = 0 and φ 2 = π / 3 , 1 ( · ) is the in dicator functio n, f s = 30 Hz is the sam ple rates, N = 150 is the data length, and ǫ [ k ] is th e noise. The measu r ements con tain two closely located fre q uencies and also a step jump . For static analysis tools, e.g., PRONY , the perfo rmance is p oor du e to the dynamics. Th us we compa r e the EKF enhan ced HHT with original HHT [15] and HHT with masking en h ancement [21]. In this simulation, we artificially assume that if th e mean of the estimated instantaneo us fr equency deviates from th e real value by 50% , th e mo de is failed to d etect. T a ble I summarizes th e mean sq u ared er rors (MSEs) and the rate of failure of different app r oaches f rom 1 0 00 Monte Carlo runs. I t can be seen that HHT withou t enhan cement almost always mixes two frequencie s. W ith masking techniq u e, the perfor mance is greatly improved, and EKF enh ances the perfor mance furtherm ore. In tho se cases that two fr equencies are successfully detected, EKF approach also delivers more accurate instantaneou s freq uency estimate co mparing existing methods. B. T ime-varia n t F r eq uency In th is case, th e measur ement is a sinu soid with tim e-variant frequen cy and a zero-mean white Gaussian noise as fo llows. y [ k ] = cos( ω [ k ] k f s + φ ) + 5 × 1 ( k > N 2 ) + ε [ k ] , where ω [ k ] = 2 π (1 . 5 + 0 . 5 / N × k ) is a time-variant fr equency . An examp le of the measuremen t a n d the frequency e stima te results ar e shown in Fig. 1 . T able II summ arizes MSEs o f different meth ods from 1000 Monte Carlo r uns. T o consider the end effects o f HHT , we also presen t MSEs o f the m iddle third of the signal. It can be seen that the origina l HHT an d masking enh anced HHT are sen siti ve to noises an d signal changes. On both ends of the signal, the f requen cy estimate is poor due to the end effects tho ugh the time mirror ing a p proach has b een emp loyed f or mitigatio n. On the othe r hand , E KF T ABLE II C L O S ELY L O C A T E D F R E Q U E N C I E S : Q k = 10 − 9 I , R k = 10 − 3 . Method MSE ω 1 MSE ω 1 of the middle third HHT 9 . 81 6 . 97 Masking 10 . 96 7 . 30 EKF 6 . 38 3 . 18 has a mu ch m ore stable perf ormance . At the beginning of the signal, the deviation is significant due to the err o r in initial estimates. Howe ver , the fr equency estimate rap id ly co n verges to the real value an d follows it well all th rough the p rocess. It shou ld be noted tha t EKF has a mem ory beh avior since it takes the past estimates into a c count. This c h aracteristic makes it slower than HHT wh en dealing with fast chan ging signals. Fortunately , in power systems, the change of measurements are relatively slow , an d EKF is expecte d to perf orm well. 0.5 1 1.5 2 2.5 3 3.5 4 4.5 Time (s) 0 2 4 6 (a) Measuremen ts 0.5 1 1.5 2 2.5 3 3.5 4 4.5 5 Time (s) -2 -1 0 1 2 3 4 5 6 7 Frequency (Hz) HHT HHT w. masking HHT w. EKF Real Freq (b) Instantaneous frequenc y estimate Fig. 1. Dynamic freque ncies C. Real PMU Data fr om J iangsu Electric P ower Company Jiangsu Electric Power Company , one of the largest provin - cial power company in China, h as installed g eneration capac ity of 100GW and peak load of 92GW . Over 160 PMUs, with thousand s of measurement channels, h av e be e n in stalled in the Jiangsu system. These PMUs cover all 500 kV sub stations, a majo rity o f the 220kV substation s, major p ower plan ts, and all r e n ew a b le power plants. In this su bsection, PMU data collected f rom real system oscillation events ar e u sed to validate the pro posal. As shown in Fig. 2, th ere is a d eclining tren d in the measuremen ts of the activ e power durin g the oscillation event. After application o f HHT , the tren d is removed, and the sum of IMFs is fed to EKF . The EKF resu lts show that there are 5 two frequ ency compon ents locate d at 0 . 5 Hz and 1 . 5 Hz, which are consistent with the re sults of masking en hanced HHT . Moreover , the estimate of EKF is more stable than th e one of HHT with the m asking tec h nique. 0 50 100 Time (s) 280 290 300 310 Active power (a) Real data from Jiangsu 0 50 100 Time (s) -20 -10 0 10 20 Active power (b) Input to EKF 0 2 4 6 8 10 Time (s) 0.5 1 1.5 2 2.5 Freq (Hz) Est. of the 1st freq component by EKF Est. of the 2nd freq component by EKF Est. of the 1st freq component by masking Est. of the 2nd freq component by masking (c) Instanta neous frequenc y estimate Fig. 2. Real PMU measurements from Jiangsu V . C O N C L U S I O N An E K F enha n cement is p r oposed to im prove the Hilbert- Huang tra n sform. Preliminar y resu lts show that the proposal can overcom e the mode mixing pr oblem and end effects using simulated data and r eal PMU measureme nts. Futu re work includes how to select the order of mode and initial estimates of E K F automatically so the algorithm can be a p plied to an online sy stem. R E F E R E N C E S [1] Z. Y i, W . Dong, and A. H. Etemadi, “ A unified control and po wer management s cheme for pv-battery-ba sed hybrid microgrids for both grid-conn ected and islanded modes, ” IEEE T ransactio ns on Smart Grid , vol. PP , no. 99, pp. 1–1, 2017. [2] D. Shi, X. Chen, Z. W ang, X. Z hang, Z. Y u, X. W ang, and D. Bian, “ A distrib uted cooperati ve control framewo rk for synchroni zed reconne ction of a multi-b us m icrogri d, ” IEEE T ransacti ons on Smart Grid , 2017. [3] Y . W ang, Y . Dvorkin, R. Fern ´ andez-B lanco, B. Xu, and D. S. Kirschen, “Impact of Local Tra nsmission Congestion on Energy Storage Arbitrage Opportunit ies, ” in 2017 IEEE P ower Ener gy Soc. Gen. Meet. , pp. 1–5, IEEE, Jun 2017. [4] T . K. Sarkar and O. Pereira, “Using the matrix pencil method to estimate the parameters of a sum of complex expon ential s, ” IEEE Antennas and Pr opaga tion Magazi ne , vol. 37, no. 1, pp. 48–55, 1995. [5] M. Bounou, S. Lefebvre , and R. Malhame, “ A spectral algorithm for ex- tracti ng po wer system modes from time recordings, ” IEEE T ransact ions on P ower Systems , vol. 7, no. 2, pp. 665–683, 1992. [6] J.-N. Juang and R. S. Pappa, “An eigen system realizati on alg orithm for modal parameter identi ficatio n and model reduction, ” Jou rnal of Guidance , Contr ol, and Dynamics , vol. 8, no. 5, pp. 620–627, 1985. [7] L. D. Peterson, “Ef ficient computati on of the eigensystem realizati on algorit hm, ” Journal of Guidance , Contr ol, and Dynamics , vol. 18, no. 3, pp. 395–403, 1995. [8] J. Sanchez-Gasc a and J. Chow , “Computa tion of power system low- order models from time domain simulations using a Hankel matrix, ” IEEE T ransactions on P ower Systems , vol. 12, no. 4, pp. 1461–1467, 1997. [9] J. F . Hauer , C. Demeure, and L. Scharf, “Initial results in Prony analysi s of power system response signals, ” IEEE T ransacti ons on P ower Systems , vol. 5, no. 1, pp. 80–89, 1990. [10] D. Trudno wski, J. Johnson, and J. Hauer , “Maki ng Prony analysi s more accura te using multiple signals, ” IEEE Tr ansactions on P ower Systems , vol. 14, no. 1, pp. 226–231, 1999. [11] M. Y azdanian , A. Mehrizi-San i, and M. Mojiri, “Estimation of elec - tromecha nical oscill ation paramet ers using an exte nded Kalman filter , ” IEEE T ransactions on P ower Systems , vol. 30, no. 6, pp. 2994–3002, 2015. [12] J. C.-H. Peng and N.-K. C. N air, “Enhancing Kalman filter for tracking ringdo wn electromech anical oscillations, ” IEEE T ransacti ons on P ower Systems , vol. 27, no. 2, pp. 1042–1050, 2012. [13] T . Jiang, I. Matei, and J. Baras, “A trust based distribu ted Kalman filterin g approach for mode estimation in powe r systems, ” in Pro c. of the Fi rst W orkshop on Secure Contr ol Systems , 2010. [14] N. Senroy , S. Suryanarayan an, and P . F . Ribeiro, “ An improved hilbert – huang method for analy sis of time-vary ing wav eforms in po wer quality , ” IEEE T ransactions on P ower Systems , vol. 22, no. 4, pp. 1843–1850, 2007. [15] N. E . Huang, Z. Shen, S. R. Long, M. C. Wu, H. H. Shih, Q. Zheng, N.- C. Y en, C. C. Tun g, and H. H. L iu, “The empirica l mode decomposit ion and the hilbert spectrum for nonlinear and non-stationa ry time s eries analysi s, ” in Proc eeding s of the Royal Societ y of London A: mathe- matical , physica l and engineerin g science s , vol. 454, pp. 903–995, T he Roya l Societ y , 1998. [16] D. Ruiz-V ega, A. R. Messina, and G. E nr ´ ıquez-Ha rper , “ Analysis of intera rea oscillatio ns via non-linear time series analysis technique s, ” in Pr oc. of 15th P ower Systems Computation Conf , 2005. [17] P . Kundur , N. J. Balu, and M. G. L auby , P ower system stabilit y and contr ol , vol. 7. McGraw-h ill Ne w Y ork, 1994. [18] Z. Jinpin g and H. Daji, “Mi rror ext ending and circul ar spline function for empirica l mode decompositi on method, ” Journal of Zhejiang Universi ty- Scienc e A , vol. 2, no. 3, pp. 247–252, 2001. [19] Z. Qingjie , Z. Huayong, and S. Lincheng, “ A ne w method for mitigation of end effec t in empiric al mode decomposition , ” in Informati cs in Contr ol, Automatio n and Robotics (CAR), 2010 2nd Internat ional A sia Confer ence on , vol. 1, pp. 400–403, IEEE, 2010. [20] J. K okes and N. Nguyen, “Using constrain ed cubic spline instead of natural cubic spline to elimina te ove rshoot and undershoot in hht, ” Annals of the F aculty of Engineerin g Hunedoara , vol. 9, no. 3, p. 23, 2011. [21] R. Deerin g and J. F . Kaiser , “The use of a masking signal to improv e em- pirica l mode decomposition , ” in Acoustics, Speech, and Signal Pr ocess- ing, 2005. Pr oceedings.(ICASSP’05). IEEE Inte rnational Confer ence on , vol. 4, pp. iv–485, IEEE, 2005. [22] R. Deering, Fine-sc ale analysis of speech using empirical mode decom- position: insight and applicat ions . PhD thesis, Duke Unive rsity , 2006. [23] N. Senroy and S. Suryana rayanan, “T wo techniques to enhance em- pirica l mode decomposition for power quality applicati ons, ” in P ower Engineerin g Society General Meeting , 2007. IEEE , pp. 1–6, IEEE, 2007. [24] D. S. L aila , A. R. Messina, and B. C. Pal, “ A refined hilbert–hu ang transform with applica tions to interarea oscilla tion m onitoring, ” IEEE T ransactio ns on P ower Systems , vol. 24, no. 2, pp. 610–620, 2009. [25] Z. W u and N. E. Huang, “Ensemble empirical mode decompositi on: a noise-assiste d data analysis method, ” Advances in adaptiv e data analysis , vol. 1, no. 01, pp. 1–41, 2009. [26] Z. Y u, D. Shi, Z . W ang, Q. Zhang, J. Huang, and S. Pan, “Distrib uted Estimation of Oscillations in Po wer Systems: an Ex- tended Kalman Filte ring Approach, ” CSEE Journ al of P ower and Ener gy Systems , 2017. Under rev ie w and ava ilable on Arxiv https://arxiv. org/abs/1706.0535 5 .
Original Paper
Loading high-quality paper...
Comments & Academic Discussion
Loading comments...
Leave a Comment