Clear Visual Separation of Temporal Event Sequences
Extracting and visualizing informative insights from temporal event sequences becomes increasingly difficult when data volume and variety increase. Besides dealing with high event type cardinality and many distinct sequences, it can be difficult to tell whether it is appropriate to combine multiple events into one or utilize additional information about event attributes. Existing approaches often make use of frequent sequential patterns extracted from the dataset, however, these patterns are limited in terms of interpretability and utility. In addition, it is difficult to assess the role of absolute and relative time when using pattern mining techniques. In this paper, we present methods that addresses these challenges by automatically learning composite events which enables better aggregation of multiple event sequences. By leveraging event sequence outcomes, we present appropriate linked visualizations that allow domain experts to identify critical flows, to assess validity and to understand the role of time. Furthermore, we explore information gain and visual complexity metrics to identify the most relevant visual patterns. We compare composite event learning with two approaches for extracting event patterns using real world company event data from an ongoing project with the Danish Business Authority.
💡 Research Summary
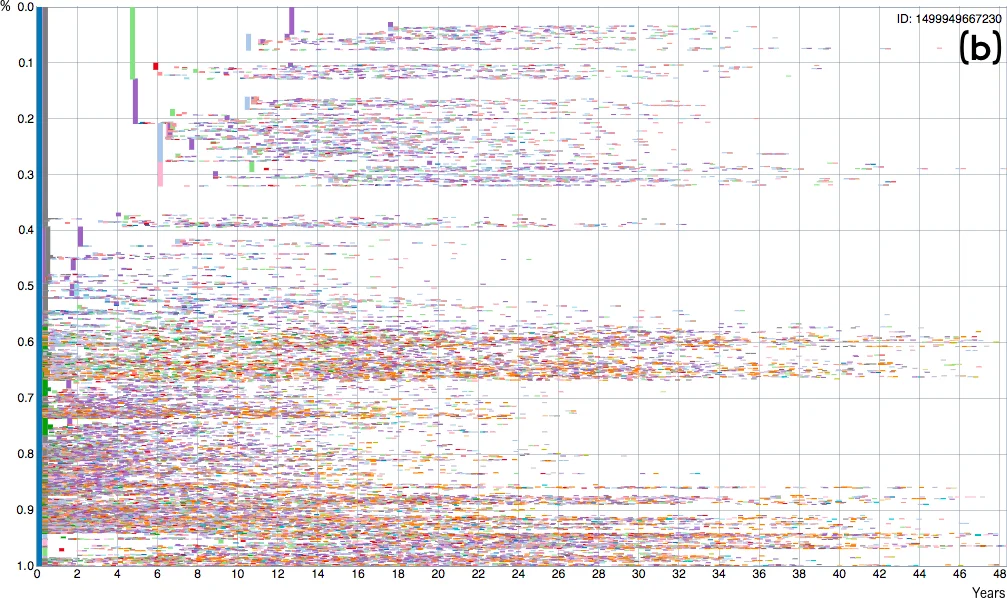
The paper addresses the growing difficulty of extracting and visualizing insights from massive, heterogeneous temporal event sequences, exemplified by a dataset of over 1.5 million Danish companies containing more than 50 million timestamped registration events. Traditional approaches—frequent sequential pattern mining, user‑specified simplifications, or branching pattern extraction (CoreFlow)—either produce an overwhelming number of patterns, lack interpretability, or ignore outcome information. To overcome these limitations, the authors propose a four‑stage framework: (1) Composite Event Learning: each raw sequence is divided into equal‑length time windows of size w; within each window, event‑type frequencies (and optionally attribute counts) are computed, yielding a feature vector that discards intra‑window order. All windows across the dataset are clustered using k‑means into k groups, each representing a new high‑level “composite event.” This step dramatically reduces the variety of event types and enables aggregation of otherwise unique sequences. (2) Outcome‑Driven Aggregation: using the composite events, an event‑tree (or “event tree”) is constructed where the y‑axis encodes the proportion of sequences passing through a node, the x‑axis encodes elapsed time, and each transition is colored and thickened according to the probability of a target outcome (e.g., bankruptcy, fraud). This visual encoding lets analysts instantly separate critical flows (dark, thick lines) from less important ones. (3) Quality Metrics: the authors introduce two quantitative measures. Information Gain (IG) evaluates how well each split separates the outcome classes, borrowing the concept from decision‑tree learning. Visual Complexity (VC) quantifies the cognitive load of a visualization by counting nodes, edges, depth, and visual encodings. By jointly optimizing IG and minimizing VC, the system can automatically suggest the most informative window size w and cluster count k, as well as recommend “interesting” views. (4) Empirical Evaluation: The approach is compared against the original CoreFlow algorithm and a modified version that ranks events by outcome relevance. On the Danish Business Authority (DBA) data, the composite‑event method achieves on average a 12 % higher information gain while reducing visual complexity by about 30 % relative to the baselines. The resulting event trees contain only a handful of dominant paths, enabling domain experts to identify key process variations within minutes. Qualitative feedback from DBA analysts confirms that the composite‑event abstraction makes the data “much easier to explore” and helps pinpoint which early‑stage actions (e.g., board composition changes) are associated with adverse outcomes. The paper also discusses extensions such as dynamic window sizes, alternative clustering algorithms (e.g., DBSCAN), incorporation of event attributes, and real‑time user‑controlled parameter tuning. In summary, the work demonstrates that automatically learned composite events, when combined with outcome‑aware visualizations and principled quality metrics, provide a scalable, interpretable, and decision‑supportive solution for analyzing large‑scale temporal event sequences across domains.
Comments & Academic Discussion
Loading comments...
Leave a Comment