Fast redshift clustering with the Baire (ultra) metric
The Baire metric induces an ultrametric on a dataset and is of linear computational complexity, contrasted with the standard quadratic time agglomerative hierarchical clustering algorithm. We apply the Baire distance to spectrometric and photometric …
Authors: Fionn Murtagh, Pedro Contreras
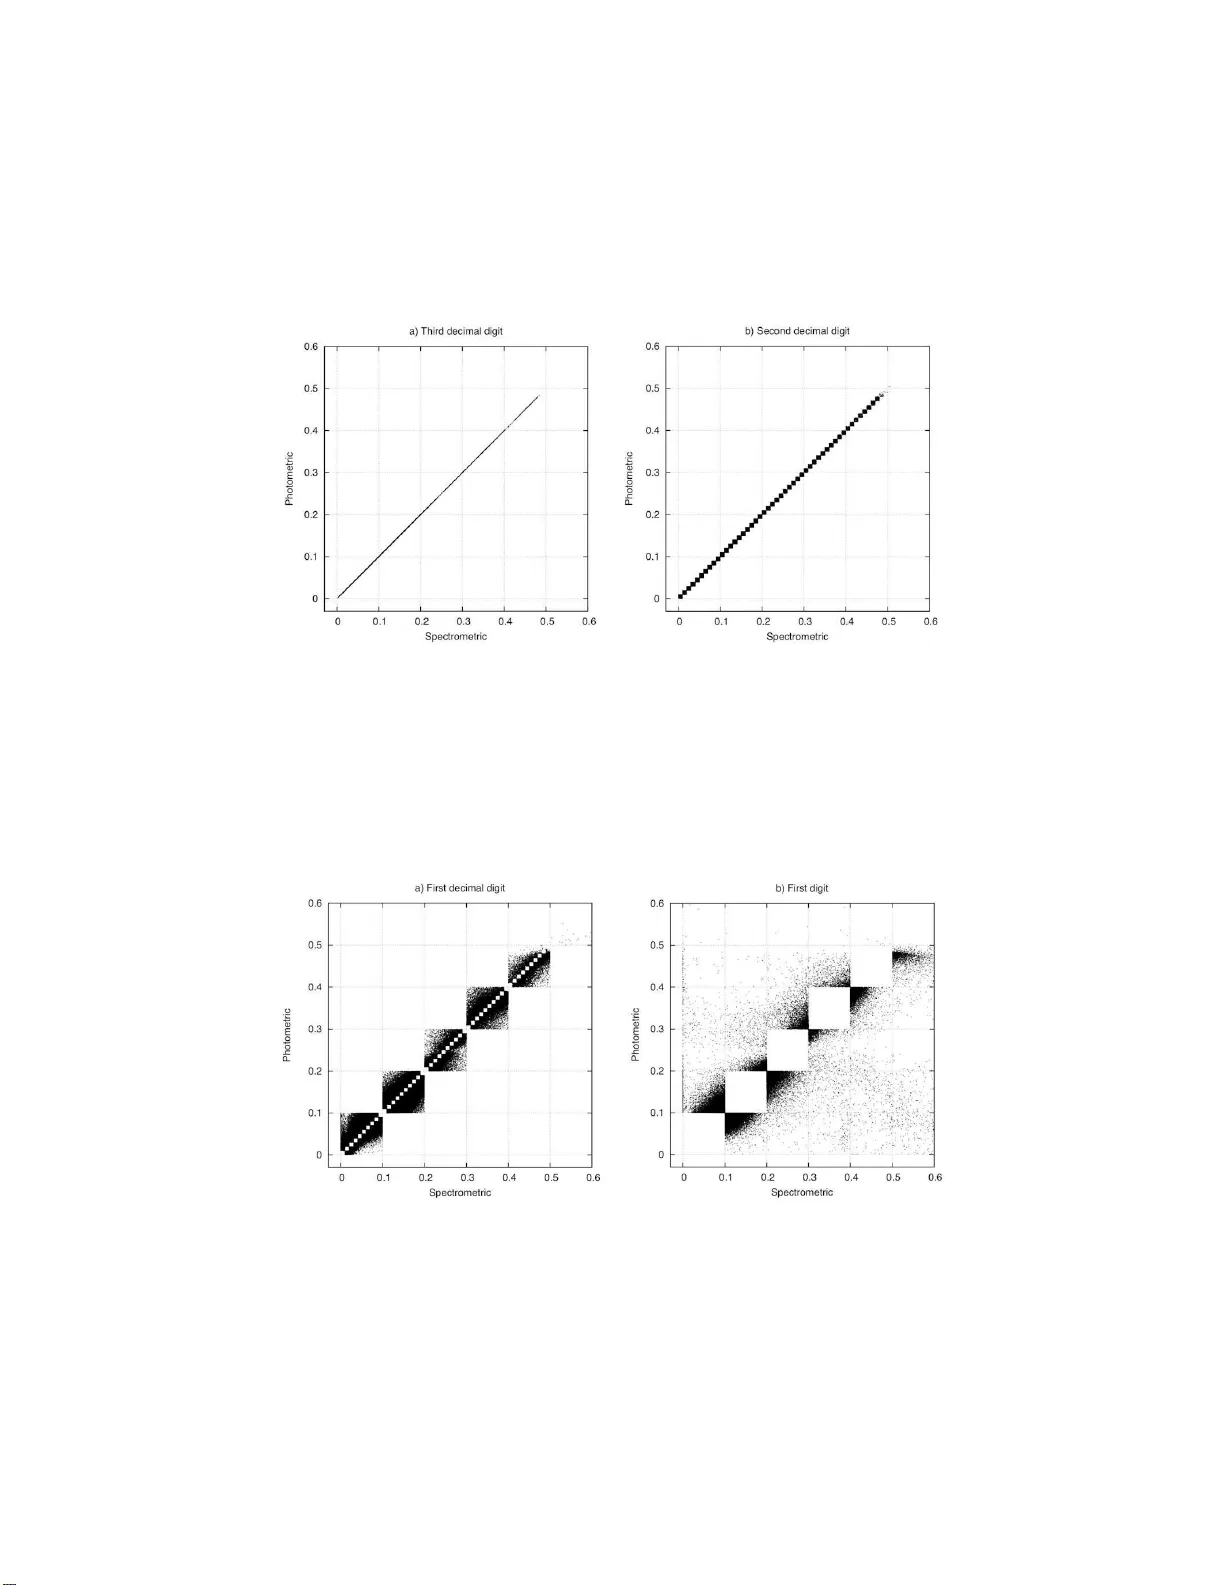
F AST REDSHIFT CLUSTERING WITH THE BAIRE (UL TRA) METRIC F. Murtagh ∗ 1 and P . Con treras ∗ 2 * Departmen t of Computer Science, Roy al Hollo w a y Univ ersit y of London, Egham, Surrey TW20 0EX, UK Email: fm urta gh@acm.org, p edro@ cs.rh ul.ac.uk 1 Science F oundation Ireland, Wilton P ark House, Wilton Place Dublin 2, Ireland 2 Thinking SAFE Ltd., Egha m, Surrey TW20 0EX, UK Abstract The Baire metric induces an ultrametric on a dataset and is of linear computational complexity , con trasted with the standard quadratic time agglomera tive h ierarc h ical clustering algorithm. W e app ly the Baire d is- tance to sp ectrometric and p hotometric redshifts from the Sloan Digital Sky Surve y using, in this w ork, ab out h alf a million astronomical ob jects. W e wan t to know how w ell th e (more costly to determine) sp ectrometric redshifts can predict the (more easily obtained) photometric redshifts, i.e. w e seek to regress the sp ectrometric on the photometric redshifts, and w e develop a clusterwise nearest neighbor regression pro cedure for this. Keyw o rds: Clustering ; Redshift; Ultrametric; Agglomerative hierarchical clus- tering; Bair e distance . 1 In tro duction: Agglomerativ e Hierarc hical Clus- tering A lgorithms A metric space ( X , d ) co nsists of a set X on which is defined a distance function d which assigns to each pair of points of X a distance b etw een them, and satisfie s the following four axioms for any triplet o f p oints x, y , z : A1: ∀ x, y ∈ X , d ( x , y ) ≥ 0 (p ositiveness) A2: ∀ x, y ∈ X , d ( x , y ) = 0 iff x = y (reflex ivity) A3: ∀ x, y ∈ X , d ( x , y ) = d ( y , x ) (symmetry) A4: ∀ x, y , z ∈ X, d ( x, z ) ≤ d ( x, y ) + d ( y , z ) (triang le inequalit y) When co nsidering an ultra metric spa ce we need to co nsider the strong tri- angular inequality or ultrametr ic inequality defined as: 1 A5: d ( x, z ) ≤ max { d ( x, y ) , d ( y , z ) } (ultrametric inequality) and this in additio n to the p o sitivity , reflexivity and symmetry prop erties (prop- erties A1, A2, A3) for a n y tr iple of point x, y , z ∈ X . If X is endow ed with a metric, then this metric can b e mappe d onto an ultrametric. In pr actice, endowing X with a metric can b e r elaxed to a dissim- ilarity . An o ften used mapping from metric to ultrametric is by mea ns of an agglomer ative hier archical clustering algorithm. A success io n of n − 1 pairwise merge steps take plac e b y making use o f the c lo sest pair of s ing letons and/or clusters at each step. Her e n is the num b e r of o bserv ations, i.e. the car dinality of set X . Closeness b etw een s ingletons is furnished by whatever distance or dissimilarity is in use . F or clo seness b etw een singleton or non-singleto n clusters, we need to define an in ter -cluster distance or dissimilarity . This can b e defined with refer ence to the cluster compactness o r other prop erty tha t we wish to optimize at e a ch step of the algorithm. Since agglo mer ative hier archical clustering requir es co nsideration of pa irwise dissimilarities at ea ch stage it can b e shown that even in the case of the mo st efficient alg o rithms, e.g. those based on recipr o cal nearest neigh b ors and neares t neighbor chains [11], O ( n 2 ) o r qua dr atic co mputational time is requir ed. The innov ation in the work we present here is that we ca r ry o ut hierarchical cluster - ing in a different wa y such that O ( n ) o r linea r computational time is needed. As alwa y s in computational theory , these are worst case times. A hierarch y , H , is defined a s a binary , r o oted, no de-ranked tree, also termed a dendr ogram [2, 9, 10, 11]. A hierarchy defines a set o f e m b edded subsets of a given set of o b jects X , indexe d by the set I . T hes e subsets are totally ordered by a n index function ν , which is a stro nger condition than the partia l order required b y the subset relation. A bijection exists betw een a hierarch y and an ultrametric spac e. Let us show thes e equiv a lences b etw ee n embedded subsets, hierar ch y , and binary tree, thr ough the c onstructive approa ch of inducing H on a s et I . Hierarchical ag g lomeration o n n observ ation vectors with indices i ∈ I in- volv es a series o f 1 , 2 , . . . , n − 1 pairwise agglomer ations of observ atio ns or clus- ters, with the following prop erties. A hierarch y H = { q | q ∈ 2 I } suc h that (i) I ∈ H , (ii) i ∈ H ∀ i , and (iii) fo r ea ch q ∈ H , q ′ ∈ H : q ∩ q ′ 6 = ∅ = ⇒ q ⊂ q ′ or q ′ ⊂ q . Here we hav e denoted the p ower s e t of set I by 2 I . An indexed hierar ch y is the pair ( H , ν ) where the p ositive function defined on H , i.e., ν : H → R + , satisfies: ν ( i ) = 0 if i ∈ H is a singleton; and (ii) q ⊂ q ′ = ⇒ ν ( q ) < ν ( q ′ ). Here w e have denoted the p ositive reals, including 0, by R + . F unction ν is the agglo meration level. T ake q ⊂ q ′ , let q ⊂ q ′′ and q ′ ⊂ q ′′ , and let q ′′ be the low est level cluster for which this is true. Then if we define D ( q , q ′ ) = ν ( q ′′ ), D is a n ultrametr ic . In practice, we sta rt with a Euclidea n or alter na tive dissimilarity , use some criterion such as minimizing the c ha nge in v ariance r esulting fro m the agglom- erations, and then define ν ( q ) as the dissimila r ity asso cia ted w ith the agglo m- eration carr ied out. 2 2 Baire or Longest Common Pr efix Distance Agglomera tive hier archical clustering algo rithms are co ns tructive hiera rch y-c onstructing algorithms. Such algor ithms hav e the aim of mapping data in to an ultrametric space, or sea rching for an ultra metric embedding , or ultrametrizatio n [20]. Now, inherent ultrametricity leads to an iden tical result with most commo nly used agglo merative criteria [11]. F urthermor e, da ta co ding can help gr eatly finding how inherently ultra metric data is [12]. In certa in resp ects the hierarch y determined by the Baire distance can b e viewed as a pa rticular co ding of the data beca use it seeks longest common prefixes in pair s of (p ossibly numerical) strings. W e could claim tha t deter mining the longest commo n prefix is a form of data compressio n b ecause we can partia lly expr ess one string in terms of another. 2.1 Ultrametric B aire Space A B a ire s pace consists of countably infinite sequences with a metric defined in terms of the long est common pre fix: the lo ng er the commo n prefix, the clos e r a pair of sequences. What is of in ter est to us here is this longest common prefix metric, which we call the Baire distance [17, 6]. Consider rea l-v alued or floating p oint data (expresse d a s a string o f digits rather than some other form, e.g . using expo nent notation). The longest com- mon prefixes a t iss ue are those o f precision of any v alue. F or exa mple, let us consider tw o such v a lues, x i and y j , with i and j ranging ov er n umeric digits. When the co ntext easily a llows it, we will call these x and y . W e take x and y to b e b ounded by 0 a nd 1. Each are of s ome precisio n, a nd we take the in teg er | K | to b e the maximum precision. Thu s we cons ide r ordered sets x k and y k for k ∈ K . I n line with our notation, we can write x k and y k for these nu mbers, with the set K now or dered. So, k = 1 is the first decimal place of precision; k = 2 is the seco nd decimal place; . . . ; k = | K | is the | K | th decimal place. The cardinality of the se t K is the precision with which a num b er , x k , is mea s ured. T ake as examples x k = 0 . 4 78; and y k = 0 . 472 . In these cases, | K | = 3. Start from the fir st dec ima l p osition. F o r k = 1, w e find x k = y k = 4. F or k = 2, x k = y k . But for k = 3 , x k 6 = y k . W e now int ro duce the fo llowing dista nce (case of vectors x and y , with 1 attribute, hence unidimensio nal): d B ( x K , y K ) = 1 if x 1 6 = y 1 inf 2 − k x k = y k 1 ≤ k ≤ | K | (1) W e ca ll this d B v alue Bair e distance, which is an ultrametric [12, 13, 1 4, 15, 17] distance. Note that the bas e 2 is given fo r conv enience. When dealing with binary data x, y , then 2 is the chosen base. When working with r eal num b e rs the ba se can b e r edefined to 1 0 . 3 2.2 Agglomerativ e H ierarc hical Clustering Algorithm v er - sus H ierarc hical Enco ding of Data The Bair e distance w as introduced and descr ibed b y Br adley [4] in the co nt ext o f inducing a hierarch y on string s ov er finite alphab ets. This work further pursued the go al of embedding a dendrog ram in a p-adic Bruhat-Tits tree, informally characterized as a “univ ersal dendrog ram”. By conv e n tion w e denote a prime by p, and a mo re genera l, prime or non- prime, p ositive integer by m. A geometric foundation for ultrametric structures is presented in Bra dley [3]. Starting from the p oint of view that a dendrog ram, or ranked or unra nked, binary or more general m -wa y , tree, is an ob ject in a p-adic g eometry , it is noted that: “The cons equence of using p-a dic metho ds is the shift o f fo cus from imp osing a hie r archic structure on data to finding a p-adic enco ding which reveals the inheren t hierarchies.” This summarizes well our aim in this work. W e see k hierar ch y and ra ther than using an agglomerative hierar chical cluster ing algorithm whic h is of quadratic computational time (i.e., for n individua ls or o bserv ation vectors, O ( n 2 ) co m- putational time is required) we instead seek to read off a p-adic or m-adic tree. (W e recall that n is the n umber of observ a tions, or cardinality of the observ ation set X .) In terms of a tr ee, p-adic o r m-adic mean p-wa y or m-wa y , resp ectively , or that each no de in the tree has at mos t p o r m, resp ectively , s ub-no des. F urthermor e, by “reading off ” w e are ta r geting a linea r time, or O ( n ) al- gorithm inv o lving one sc an over the dataset, a nd we are imp osing thereby an enco ding of the data. In practice we will b e more interested in this work in the hier arch y , and the enco ding a lgorithm used is a means tow ards this end. F or a fo cus on the enco ding task, s ee Murtagh [16]. 2.3 A B aire-Based Hierarc hical Clustering Algorithm A straightforw ard algor ithm fo r hier a rchical clustering based on the Baire dis- tance, as describe d in section 2.1 is as follows. Beca use of w orking with r eal nu mbers in our case study b elow, we define the base in relatio n 1 as 10 rather than 2. F or the first digit of pre cision, k = 1, consider 10 “bins” c o rresp onding to the digits 0 , 1 , . . . , 9. F or each of the no des cor resp onding to these bins, consider 10 subno de bins cor resp onding to the second digit of precision, k = 2 , asso ciated with 0 , 1 , . . . , 9 a t this s e cond le vel. W e can contin ue for a third and further levels. In practice we will neither p ermit not wish for a v ery dee p (i.e., with many lev els) stora g e tree. F or the ba se 10 case, level one (co rresp onding to k = 1) gives rise to up to 10 clusters. F or level tw o (corr esp onding to k = 2) we hav e up to 100 clusters. W e see that in practice a small n umber of levels will suffice. In one pa ss ov er the data we ma p each o bserv ation (reca ll that it is univ ariate but we are using its order ed set of digits, i.e. or dered set K ) to its bin or cluster a t each level. F or ℓ levels, the computation r e quired is n · ℓ op era tions. 4 F or a g iven v a lue of ℓ we there fo re hav e O ( n ) computation – and furthermor e with a very small constant of prop or tionality since we are just r eading off the relev ant digit and, by design, up dating a no de o r cluster mem b ership list a nd cardinality . 3 Inducing a Hierarc h y on the SDSS Data using the B aire Ultrametric The Slo an Dig ita l Sky Survey (SDSS) [19] is systematically ma pping the sky pro ducing a detailed image of it and determining the po sitions and absolute brightnesses of more than 100 million celestial ob jects. It is also measuring the distance to a millio n o f the nearest ga laxies and to a hundred thousand q uasars. See Adelman-McCarthy e t al. [1] for a description of the data av ailable in this catalog. The aim here is to build a mapping from z spec → z phot to help calibrating the r edshifts, based on the z spec observed v alues. T raditiona lly we could ma p f : z phot − → z spec based o n trained da ta. The mapping f could b e linear (e.g. linear reg ression) or no n-linear (e.g. multila yer per ceptron) as used by D’Abrusco [8]. These techniques are g lobal. Here our interest is to develop a locally adaptive approa ch based on n umeric al pr ecision. That is the direct bene fit of the (v er y fas t, hierarchical) clustering based on the B aire distance. W e use four pa rameters: r ight a scension (RA), declination (DEC), spectr o- metric ( z spec ) and photometric ( z phot ) redshift. The spectr ometric technique uses the spectr um of electromag ne tic r a diation (including visible light) which radiates fr om stars and o ther celes tial o b jects. The photometric technique uses a faster a nd economical way of measur ing the redshifts. 3.1 Clustering SDSS Data In order to p erform the clustering pro cess intro duced in section 2.1 and fur- ther describ ed in 2.3, we compa re every z spec and z phot data po int s e arching for common pr efixes based on the longest common prefix (see sectio n 2.1). There- after, the data po int s that have digit co incidences are group ed together to fo rm clusters. Data c haracter ization is presented in Figur e 1. The left panel shows the z spec and z phot sky co ordinates o f the da ta currently used b y us to cluster redshifts. This se c tio n of the sky pres ent s a pproximately 0.5 million ob ject co ordinate po int s. As ca n b e observed, v ario us sections of the sky are repr esented in the data. W e find this useful since prelimina ry data explora tio n has shown that correla tion b etw een z spec and z phot is consistent in differen t par ts of the sky . This leads us to co nc lude that digit coincidences of the redshift measure s are distributed approximately uniformly in the sky and are not concentrated spatially . The same o ccurs for all the other clusters. W e will co ncentrate on the very near astro nomical ob jects, represented by redshifts b etw een 0 and 0 . 6. When w e plot z spec versus z phot we obtain a highly cor related signal as shown 5 in Figure 1, r ight panel. The num be r of o bserv ations that we ther efore analyze is 443,0 14. Figure 1: Left: right ascension (RA) versus declination (DEC); Rig ht : z spec versus z phot . SDSS da ta selection used for redshift analysis. Figure 2: Heat plo t and histog ram for z spec versus z phot . Histogram at the top shows the z spec frequencies, histog ram at the right shows z phot frequencies. Lo oking at Figure 2 it ca n b e s een clear ly that most data p o ints fall in the ra nge b etw een 0 and 0.2. Here the histogram on the top shows the z spec 6 data p oints distribution, and the histogr am on the right the z phot data p oints distribution. The heat plot (left panel) als o highlights the ar ea where data po int s ar e concentrated, where the yellow color (white region in mono chrome print) shows the ma jor dens it y . Consequently , now we know that most c lus ter da ta points will fall within this ra nge (0 and 0.2 ) if c o mmon prefixes o f digits in the re dshift v alues, taken as strings , ar e found. Figures 3 a nd 4 show graphica lly how z spec and z phot corres p o ndenc e s loo k at different levels of decimal precisio n. On one hand we find that v a lues o f z spec and z phot that hav e equal pr ecision up to the 3 rd decimal digit a r e hig hly correla ted. On the other ha nd when z spec and z phot hav e only the firs t digit in common, correla tion is weak. F or example, let us consider the following situations for plo ts 3 a nd 4: • Figure 3 left: let us take the v alues of z spec = 0 . 437 and z phot = 0 . 437 . W e hav e that they s ha re the first dig it, the fir st decima l digit, the sec ond decimal digit, a nd the thir d decimal digit. Thus, w e hav e a hig hly cor- related signa l of the da ta p o ints that share only up to the third decimal digit. • Figure 3 rig h t: let us take the v alues of z spec = 0 . 43 7 and z phot = 0 . 43 9 . W e hav e that they shar e the first digit, the first decimal digit, and the second decimal digit. Therefor e, the plot shows data po int s that share only up to the seco nd de c imal digit. • Figure 4 left: let us take the v alues of z spec = 0 . 437 and z phot = 0 . 474 . W e have that they share the first digit, and the first decimal digit. Thus, the plot sho ws data p oints that shar e o nly up to the first decimal digit. • Figure 4 rig h t: let us take the v alues of z spec = 0 . 43 7 and z phot = 0 . 57 1 . W e hav e that they s hare only the in teger part of the v alue, and that alone. F urthermo r e, this implies reds hifts that do not matc h in succ ession of decimal dig its. F or example, if w e take the v alues 0.437 and 0 .577, the fact that the third digit is 7 in e ach case is not of use. T able 1 (see a lso Figure 5) shows the clusters found for a ll different levels o f precision. In other words this table allows us to define empirica lly the confidence levels fo r mapping of z phot and z spec . F or exa mple, we can exp ect that 82 . 8 % of v alues for z spec and z phot hav e at lea st tw o co mmon prefix digits. This per centage of confidence is derived as follows: the data p oints that shar e s ix, five, four, three, tw o, and one decimal digit (i.e., 4 + 90 + 912 + 8 , 9 82 + 85 , 999 + 270 , 920 = 366 , 907 data p o ints. Ther e fore 8 2.8% of the data ). Additionally we observe that around a fifth of the observ ations share at least 3 dig its in common. Namely , 4 + 90 + 912 + 8 , 982 + 85 , 999 = 95 , 987 data p oints, which equals 21 . 7% of the data. In prev io us work [7] we have shown that the clus ter s genera ted by means of the Bair e ultrametric ar e similar to the clusters generated by k -means, also see Contreras [5]. 7 Figure 3: Prefix - wise clustering frequencies depicting 3rd decima l digit coinci- dences (left panel), a nd tw o decimal dig it coincidences (righ t panel). Figure 4: Prefix-wise clustering frequencies depicting the 1st decimal digit c o- incidences (left panel), and first dig it coincidences (righ t panel). 8 Digit No. % 1 76,187 17.19 Decimal digit No. % 1 270,920 61.14 2 85,999 19.40 3 8,982 2.07 4 912 0.20 5 90 0.02 6 4 — 443,094 100 T able 1: Data p oints ba sed on the longest common prefix for differ ent levels of precision. Figure 5: F requency distr ibution for T able 1. The a bscissa shows the digit po sitions, where 1 is the firs t digit, 2 the first decimal digit, 3 the second dec ima l digit and s o on. 9 4 Sp ectrometric and Photometric Digit Distri- bution W e ha ve seen that the B aire ultra metric pro duces a strict hier archical cla ssi- fication. In the cas e of z spec and z phot this can be seen a s follows. Let us take a ny obser ved measurement of either ca se of z spec = z phot . Let us say z spec = z phot = 0 . 1 257. Here we hav e that for | K | = 4, z spec = z phot . Hierar - chically s pea king we hav e that the ro ot no de is 0 , for the firs t level where ther e po tent ially exist 6 no des (i.e. 0,1,...,5); for the sec o nd level potentially there are 60 nodes; and so on un til k = | K | = 4 , and z spec = z phot , where potentially there are 6 · 10 · 10 · 10 = 6 000 no des. Of course no t a ll nodes will b e p opulated. In fact we can exp ect that a la rge nu mber of these p otential no des will b e empt y if the num ber of observ a tions n is low er tha n the p otential num b er of no des for a certain precision | K | (i.e. n ≤ | K | 10 ). Note that this p oints to a big stora ge cost, but in practice the tree is very s parsely p opulated and | K | small. A particula r interpretation can b e given in the case of an obser ved da ta po int . F ollowing up the ab ove example if we take z spec = z phot = 0 . 1 257, a tree can b e pro duced to stor e all observed data that falls within this no de. Doing this has many adv a nt ages from the viewp oint of sto ring. Access and retriev al, for example, are very fast and it is easy to retrieve all the observ a tions that fall within a given no de a nd its children. With this tr e e it is a trivial task to build bins for data distribution. Figur e 6 depicts the frequency distr ibution fo r a given digit a nd precis ion. There ar e 10 0 data p oints that have b een conv olved with a Ga ussian kernel to pro duce sur fa ce planes in o rder to asse m ble three-dimensiona l plots. This helps to build a cluster-wise mapping of the data. F o llowing the Figure 6 top panel we observe that for the first decima l digit most data observ a tio ns are concentrated in the digits 0, 1, 2, and 3. T he n the rest of decimal precision data is uniformly distributed, g radually go ing tow ards zero when the lev el of precision increases. There is the ex c eption of t wo peak s, for precision equal to 8. This turns out to be use ful b eca use when co mparing the z spec and z phot digit distribution we do not find the same p eak s in z phot . This is very useful b ecause now we can discriminate whic h observ ations a re more reliable in z phot through different characteristics of the data asso ciated with the pea ks. 10 Figure 6: Digit distribution for z spec and z phot ; T op: Spectro metric digit dis- tribution; Bo ttom: Photometric digit distribution. Note that digit distribution for z spec has three p eaks , but z phot has only o ne. 11 5 Conclusions In this work the distance ca lled the Baire distance is pres ent ed. This distance has b een very r ecently in tro duced in to data analysis. W e show ho w this dista nce can b e used to gener ate clusters in a wa y that is co mputationally inexp ensive when compared with more tr aditional tec hniques. The distance is a lso an ultra- metric and therefor e furnishes a n ultrametric to o. Hence the new Baire distance lends itself very well to the new hierar chical clustering metho d that we hav e in- tro duced here. In the astro nomy case clusters gene r ated with the Bair e distance can be useful when calibrating redshifts. In general, applying the Bair e metho d to cases where digit precision is imp ortant can b e of r elev ance, sp ecifically to highlight data “bins” and so me of their proper ties. Note that when tw o num b ers shar e 3 pr efix digits, and base 10 is used, we hav e a Baire dis tance of d B = 10 − 3 . W e may not need to define the actual (ul- tra)metric v alues. It may be, in fact, mor e conv enient to work on the hie r arch y , with its differen t le vels. In section 3.1 we showed how w e could derive that 8 2 . 8% of v alues for z spec and z phot hav e a t least tw o common pr e fix digits. This is a p ow erful result in practice when we recall that we can find very efficiently where these 82 . 8% of the astr o nomical ob jects are. Using the Baire distance we show ed in section 4 that z spec and z phot signals can be stored in a tree lik e structure. This is adv antageous w he n measur ing the digit distribution for ea ch signa l. When compar ing these distributions, it can easily b e seen wher e the difference s arise. The Ba ir e distance has proved very useful in a num b er of cases , for instance in Murtagh et al. [1 7] this distance is used in conjunction with r andom pro- jection [2 1] as the ba sis for clustering a lar g e dataset of chemical comp ounds achieving results comparable to k -means but with better p erformance due to the low er computational co mplex it y of the B aire-bas e d clustering method. Other applicatio n ar eas include text mining a nd semantic preserv atio n [18]. F or mor e details refer to Contreras [5 ] where a num ber of examples are discussed. References [1] J. K. Adelma n- McCarthy et a l. The fifth data releas e of the Sloan Digital Sky Survey. The Astr ophysic al Journ al Supplement Series , 172(2 ):634–6 44, 2007. [2] J.-P . Benz´ ecri. L a T axinomie . Duno d, Paris, 2nd edition, 1 979. [3] P . E . Bradley . Dege ner ating families of dendr ograms. Journal of Classifi- c ation , 25:27–42 , 2008. [4] P . E. B r adley . Mumf ord dendrogra ms. Computer Journal , 5 3:393– 404, 2010. 12 [5] P . Contreras. Se ar ch and R etrieval in Massive D at a Col le ctions . PhD thesis, Royal Hollow ay , Universit y of London, 2010 . [6] P . Con treras and F. Murtagh. E v aluation of hierarchies based on the longest common prefix, or Baire, metric, 2 007. Classification So ciety of North America (CSNA) meeting, University of Illinois. Urbana -Champaign. IL, USA. [7] P . Co nt rera s and F. Murtagh. F a st hierarchical clus ter ing from the Bair e distance. In Hermann Lo c a rek-Jung e and Claus W eihs, editors, Classifi- c ation as a T o ol for Re se ar ch , pages 235 – 243, Dresden, Germany , 2009 . Springer Ber lin Heidelb erg. [8] R. D’Abrusco, A. Staia no, G. Longo , M. Paolillo, and E . De Filippis. Steps tow ar d a class ifier for the virtual observ ator y . I. Cla ssifying the SDSS photo- metric ar chiv e. 1 s t W orksho p of Astronomy and Astrophysics for Studen ts- Naples, April 2006. http: //arx iv.org /abs/0706.4424 . [9] S. C. Johnso n. Hierarchical clustering schemes. Psychometrika , 3 2:241 – 254, 1967. [10] I. C. Le r man. Classific ation et Analyse Or dinale des Donn´ ees . Dunod, Paris, 19 8 1. [11] F. Murta g h. Multidimensional Clustering Algo rithms . Physica-V erlag, 1985. [12] F. Murtag h. On ultrametr icit y , data coding, and co mputation. Jou rn al of Classific ation , 21:167– 184, Septem be r 20 04. [13] F. Murtag h. Qua ntifying ultrametricity . In J. An to ch, editor, COMPST A T 2004 – Pr o c e e dings in Computational St atist ics , pages 1561– 1568, Pr ague, Czech Republic, 2004. Spr inger. [14] F. Murtag h. Thinking ultrametrica lly . In D. Banks, L. Hous e, F. R. Mc- Morris, P . Ara bie, and W. Ga ul, editor s, Classific ation, Clust ering, and Data Mining Applic ations. Pr o c e e dings of the Me eting of the International F e der ation of Classific ation So cieties ( IF CS) , pag es 3–1 4, Illino is Institute of T e chnology , Chicago , July 2004. Springer. [15] F. Mur tagh. Identifying the ultr a metricity o f time ser ies. The Eur op e an Physic al Journal B , 4 3(4):573– 579, F ebruary 2005. [16] F. Murtagh. Symmetry in data mining and analysis: a unifying view based on hiera rch y . Pr o c e e dings of Steklov Inst itute of Mathematics , 2 65:177 –198 , 2009. [17] F. Murtag h, G. Downs, and P . Contreras. Hierarchical clustering o f mas- sive, high dimensional data sets by exploiting ultrametr ic embedding. SIA M Journal on Scientific Computing , 30(2 ):707–7 30, F ebruary 2 0 08. 13 [18] J. Pereira , F. Schmid t, P . Co ntreras, F. Mur tagh, a nd H. Astudillo. Clus- tering and semantics preserv a tion in cultural heritage information spa c e s. In RIAO’201 0, 9th International Confer enc e on A daptivity, Personaliza- tion and F usion of Heter o gene ous Information , Paris, F ra nce, 20 10. [19] SDSS. Sloan Digital Sky Sur vey, 200 8. http: //www. sdss.org . [20] A. C. M. v an Ro oij. Non-Ar chime de an F unctional Analysi s . Ma rcel Dekker, 1978. [21] S. S. V empala. The R andom Pr oje ction Metho d. DIMACS: Series in Dis- cr ete Mathematics and The or etic al Computer Scienc e , volume 65. American Mathematical Society , first edition, 2004. 14
Original Paper
Loading high-quality paper...
Comments & Academic Discussion
Loading comments...
Leave a Comment