Predicting and Understanding Law-Making with Word Vectors and an Ensemble Model
Out of nearly 70,000 bills introduced in the U.S. Congress from 2001 to 2015, only 2,513 were enacted. We developed a machine learning approach to forecasting the probability that any bill will become law. Starting in 2001 with the 107th Congress, we…
Authors: John J. Nay
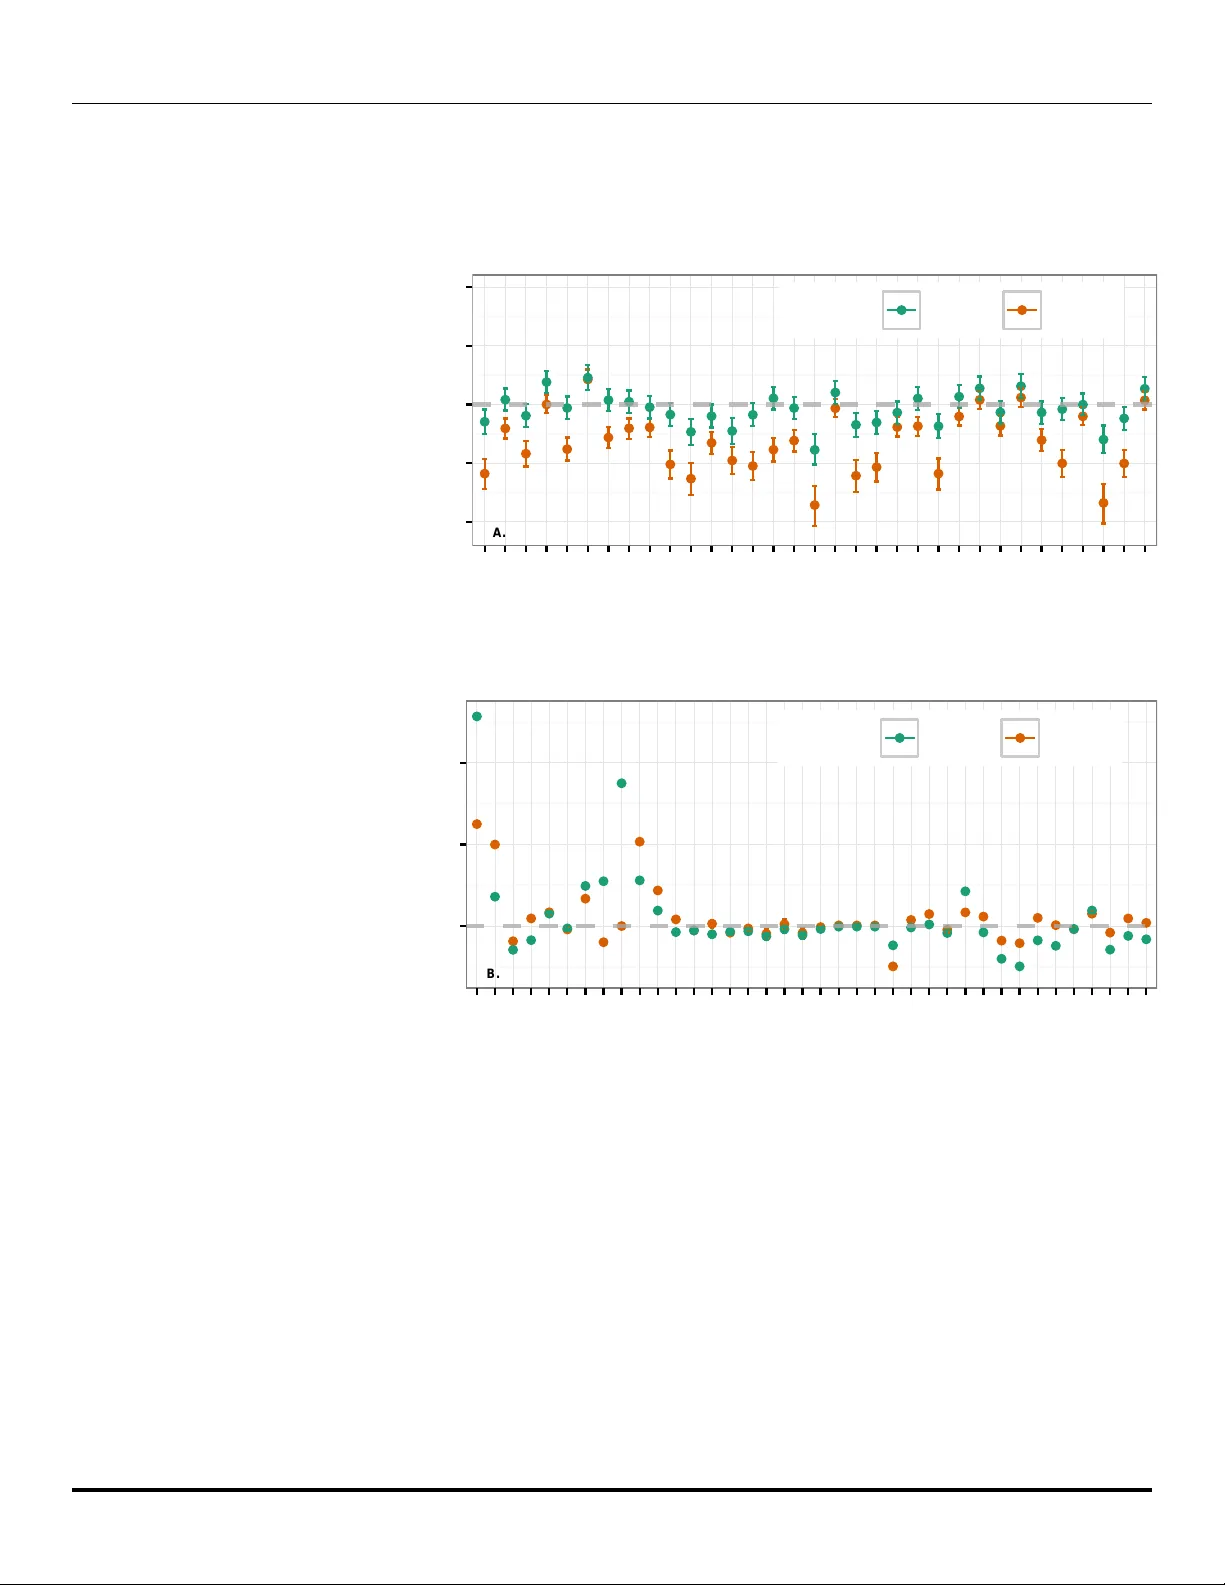
Predicting and Understanding La w-Making with W ord V ectors and an Ensem ble Mo del John J. Na y* 1,2 1 Sc ho ol of Engineering, V anderbilt Universit y , Nashville, TN, United States of America 2 Program on La w and Innov ation, V anderbilt La w School, Nashville, TN, United States of America * john.j.na y@gmail.com Abstract Out of nearly 70,000 bills in tro duced in the U.S. Congress from 2001 to 2015, only 2,513 w ere enacted. W e developed a machine learning approach to forecasting the probability that an y bill will b ecome la w. Starting in 2001 with the 107th Congress, we trained mo dels on data from pr evious Congresses, predicted all bills in the curr ent Congress, and rep eated until the 113th Congress served as the test. F or prediction we scored each sen tence of a bill with a language mo del that em b eds legislativ e vocabulary into a high-dimensional, seman tic-laden vector space. This language representation enables our in vestigation into which words increase the probability of enactment for any topic. T o test the relative imp ortance of text and context, we compared the text mo del to a con text-only mo del that uses v ariables such as whether the bill’s sp onsor is in the ma jority party . T o test the effect of changes to bills after their introduction on our abilit y to predict their final outcome, we compared using the bill text and meta-data a v ailable at the time of introduction with using the most recent data. A t the time of in tro duction context-only predictions outp erform text-only , and with the newest data text-only outp erforms context-only . Com bining text and context alwa ys p erforms b est. W e conducted a global sensitivity analysis on the combined mo del to determine imp ortan t v ariables predicting enactment. 1 In tro duction The U.S. legislative branch creates laws that impact the lives of hundreds of millions of citizens. F or example, the Patien t Protection and Affordable Care Act (ACA) significan tly affected the health care industry and individuals’ health insurance cov erage. Bills often consist of h undreds of pages of dense legal language. In fact, the ACA is more than 900 pages long. There are thousands of bills under consideration at any given time and only ab out 4% will b ecome law. F urthermore, the num b er of bills introduced is trending upw ard (see S1 App endix), exacerbating the problem of determining what text is relev ant. Given the complexit y , length, and v ast quantit y of bills, a machine learning approac h that leverages bill text is well-suited to forecast bill success and identify the imp ortan t predictive v ariables. Despite rapid adv ancement of machi ne learning metho ds, it’s difficult to outp erform naive forecasts of rare even ts b ecause of inherent v ariabilit y in complex so cial pro cesses [1] and b ecause relationships learned from historical data can c hange without warning and inv alidate mo dels applied to future circumstances. Due to the complexity of law-making and the aleatory uncertaint y in the underlying so cial systems, we predict enactment probabilistically . It’s imp ortan t to make 1/14 pr ob abilistic predictions for high consequence even ts b ecause even small changes in probabilities for ev ents with extreme implications can hav e large exp ected v alues. F or instance, the 2009 stim ulus bill cost $ 831 billion so even a 0.1 change in the predicted probabilit y of this bill corresp onds to a $ 83.1 billion dollar change in the exp ected v alue (the probability of an even t multiplied b y its consequences). Probabilities pro vide muc h more information than a simple “enact” or “not enact” prediction. Model p erformance metrics that don’t use probabilities, such as accuracy , are not suitable measures of rare ev ent predictive ability . F or instance, a blunt “never enact” mo del has a seemingly impressiv e 96% accuracy rate on this data but incorrectly classifies all the enacted bills with incalculable effects on so ciet y . F orecasting mo del p erformance should b e estimated using multiple metrics on large amoun ts of test data measured after the data that was used to train the mo del. W e trained mo dels on Congresses prior to the Congress predicted, which simulated real-time deploymen t across 14 years and 68,863 bills. Starting with the 107th Congress (2001–2003), mo dels were sequentially trained on data from pr evious Congresses and tested on all bills in the curr ent Congress. This was rep eated sev en times until the most recen tly completed Congress – the 113th (2013–2015) – served as the test. T o estimate p erformance, we compared a baseline mo del to our mo dels across three p erformance measures that lev erage predicted probabilities. Although previous researc h found that bill text was useful for predicting whether bills will surviv e committee [2] and for predicting roll call votes [3, 4], these authors tested their mo dels on muc h less data than w e do and predicted more frequently observ ed even ts: getting out of committee is more common than b eing enacted and bills up for vote are a small subset of all bills introduced. It’s not clear whether utilizing text mo dels trained on previous Congresses will improv e predictions of enactmen t of bills in tro duced in future Congresses b eyond the predictive p o wer of sp onsorship, committee and other non-textual data. T ext is noisy and completely different topics can b e found within the same bill [5]. How ever, we hypothesized that there are unique semantic and syn tactic signatures that consistently differentiate successful bills. Our second h yp othesis w as concerned with the changes to bills ov er their liv es. Some bills, e.g. the A CA, are only a few pages when introduced but are hundreds of pages when enacted. Ho wev er, 87% of bill texts don’t change after b eing introduced b ecause they don’t progress further in the la w-making pro cess. W e hypothesized that using the most recen tly av ailable version of bill text and metadata would lead to stronger predictive p erformance for text and context mo dels. T o test these hypotheses, we designed an exp erimen t across t wo primary dimensions: data typ e (text-only , text and context, or con text-only) and time (using oldest or new est bill data). Analyzing a mo del that makes successful ex an te predictions can b e more informative than ex-p ost interpretations of so cio-p olitical even ts (outside exp erimen t-lik e settings) due to the o ver-fitting that plagues most mo deling of observ ational data [6]. How ever, b ecause highly predictiv e mo dels are often designed with only predictive p o wer in mind, they rarely provide clear insights into relationships b etw een predictor v ariables and the predicted outcome. When estimates of these relationships are provided for non-linear mo dels, they are almost alwa ys measures of only magnitudes of the effects of predictor v ariables and not also the directions of the effects. Our work is not limited to raw predictiv e p o wer. W e estimate the dir e ction and magnitude of the effect of eac h predictor v ariable in the mo del on the predicted probability of enactment. F urthermore, the text mo del reveals which words are more asso ciated with enactmen t success. 2/14 2 Metho ds and Data 2.1 Mo del T raining 2.1.1 W ord V ectors and Inv ersion of Language Mo dels Con tinuous-space vector representations of words can capture subtle semantics across the dimensions of the vector [7]. T o learn these representations, a neural net work mo del predicts a target w ord with the mean of the representations of the surrounding words (e.g. v ectors for the tw o words on either side of the target word in Fig. 1A.). The prediction errors are then bac k-propagated through the netw ork to up date the represen tations in the direction of higher probability of observing the target word [8, 9]. After randomly initializing represen tations and iterating this pro cess o ver many word pairings, w ords with similar meanings are even tually lo cated in similar lo cations in v ector space as a by-product of the prediction task, which is called word2v ec [8]. Word e.g. : ‘obtain’ Word e.g. : ‘a’ Word e.g ., ‘for’ Word e.g. : ‘loan’ Average Context V ectors Predict T arget Word d- dimensional vectors, e.g. d=100 Word e.g ., ‘education’ e.g., middle word in 5-word sequence A. T raining Data Congress 103-106 T rain Base Learners starting with 104 T rain w2v T esting Data Congress 107 Predict w2v Past Future Cross-validate Base Learners T rain Super- Learner Predict Base Learners Predict Super Learner Full Model Predictions Predict w2v starting with 104 Model Training Only Predictions Sequential Train-T est Splitting with 103-106 B. Fig 1. A. The neural netw ork-based training algorithm used to obtain word v ectors [10]. Parameters are up dated with sto c hastic gradien t descent and we use a binary Huffman tree to implemen t efficient softmax prediction of words. See S1 App endix for description of hyper-parameters. B. Mo del training and testing. This pro cess is completed and then we adv ance one Congress. The only pre-pro cessing we applied to text was remov al of HTML, carriage returns, and whitespace, and con version to low er-case. Then inv ersion of distributed language mo dels was used for classification as describ ed in [11]. Distributed language mo dels – mappings from w ords to R d obtained b y leveraging word co-o ccurrences – were separately fit to the sub-corp ora of successful and failed bills by applying word2v ec. Eac h sentence of a testing bill was scored with each trained language mo del and Bay es’ rule w as applied to these scores and prior probabilities for bill enactment to obtain p osterior probabilities. The prop ortions of bills enacted in the same cham b er as the predicted bill in all pr evious Congresses were used as the priors. The probabilities of enactmen t were then av eraged across all sentences in a bill to assign an ov erall probabilit y . 2.1.2 T ree-based Mo dels T rees are decision rules that divide predictor v ariable space into regions by c ho osing v ariables and their threshold v alues on which to make binary splits [12]. A tree mo del can learn interactions b et ween predictors, unlike linear mo dels where in teractions must b e manually sp ecified, and is generally robust to the inclusion of v ariables unrelated to the outcome. A gr adient b o oste d machine (GBM) improv es an ensemble of weak er base mo dels, often trees, by sequentially adjusting the training data based on the residuals of the preceding mo dels [13]. A r andom for est randomly samples observ ations from training data and gro ws a tree on each sample, forcing each tree to consider randomly 3/14 selected sets of predictor v ariables at eac h split to reduce correlation b et ween trees [14]. GBMs and random forests can b oth learn non-linear functions but hav e differen t strengths: in general, random forests are more robust to outliers while GBMs can more effectiv ely learn complex functions. A regularized logistic regression (elastic-net) with h yp er-parameters ( α = 0.5 and λ = 1e-05) is also estimated to gain a complementary linear p erspective [15]. Using the predictions from the in version of the word vector language mo del (as describ ed in Section 2.1.1.) as features allows the training pro cess to learn interactions b et w een contextual v ariables and textual probabilities. Additionally , the sensitivity analysis can then estimate the impact of text predictions on enactment probabilities along with the con textual predictors, controlling for the effect of the probability of the bill text when estimating non-textual effects. 2.1.3 Ensem ble Stac king Random forests and GBMs com bine weak learners to create a strong learner. Stacking com bines strong learners to create a stronger learner. A cross-v alidation stacking pro cess on the training data is used to learn a combination of the three base mo dels to form a meta-predictor [16, 17]. Out-of-fold cross-v alidation predictions are made on the training data with the three base learners describ ed ab o ve in Section 2.1.2 (the gradient b oosted machine mo del, the random forest mo del, and the regularized logistic regression mo del). These predictions and the outcome vector are used to train the meta-learner, a regularized logistic regression with non-negativ e weigh ts. W eights are forced to b e non-negativ e b ecause we assume all predictors should p ositively contribute. This entire learning pro cess is conducted on data from prior Congresses. The mo del is applied to test data b y making predictions with base learners and feeding those into the meta-learner (Fig. 1B.). 2.2 Mo del P erformance W e use the tw o most frequen tly applied binary classification probability scoring functions: the log score and the brier score (see S1 App endix). F or b oth, if a mo del assigns high probabilit y to a failed bill it’s p enalized more than if it w as less confident and if a mo del assigns high probability to an enacted bill it is rewarded more than if it w asn’t confident. A receiver op erating characteristic curve (ROC) is built from p oints that corresp ond to the true p ositiv e rate at v arying false p ositive rate thresholds with the mo del’s predictions sorted by the probability of the p ositive class (enacted bill) [18]. Starting at the origin of the space of true p ositiv e rate against false p ositiv e rate, the prediction’s impact on the rates results in a curve tracing v ertically for a correct prediction and horizon tally for an incorrect prediction. A p erfect area under the R OC curv e (AUC) is 1.0 and the worst is 0.5. AUC rewards mo dels for b eing discriminative throughout the range of probabilities and is more appropriate than accuracy for im balanced datasets. 2.3 Analysis 2.3.1 T ext Mo del Similarit y Analysis W e train language mo dels with word2v ec for enacted House bills, failed House bills, enacted Senate bills, and failed Senate bills and then inv estigate the most similar w ords within eac h of these four mo dels to w ord vector combinations representing topics of in terest. That is, for each of the four mo dels, return a list of most similar w ords: arg max v ∗∈ V 1: N cos ( v ∗ , 1 W P W i =1 w i × s i ), where w i is one of W word vectors of in terest, 4/14 V 1: N are the N most frequent words in the vocabulary of M words (rare words are retained to train the mo del, but N is set to less than M to exclude rare words during mo del analysis) excluding words corresp onding to the W query vectors, s i is 1 or -1 for whether we are p ositiv ely or negatively weigh ting w i , and cos ( a, b ) = P d i =1 a i × b i √ P d i =1 a 2 i √ P d i =1 b 2 i . F or ease of comparison across enacted and failed categories we also remov e words the t wo hav e in common. 2.3.2 F ull Mo del Sensitivit y Analysis W e conduct a sensitivity analysis on our mo del of the legislative system by v arying inputs to the mo del and measuring the effect on the output. If input v alues are v aried one at a time, while keeping the others at “default v alues,” se nsitivities are conditional on the chosen default v alues [19]. There are no sensible default v alues for the predictor v ariables. Instead of using default v alues of v ariables, we use empirically observed predictor v ariables and we predict the enactment of all the bills from Congresses 104-112. These predictions are a v ector of predicted probabilities. The empirical predictors v ariable data and these asso ciated predicted probabilities create a sufficiently large y et realistic set of observ ations for a global sensitivity analysis to determine the mo deled effects of the predictors v ariables on the probabilit y of enactment. Next, w e expand the factor v ariables out so each level is represented in the design matrix as a binary indicator v ariable. This allows us to estimate the effect of each level of a factor, e.g. the 39 sub ject categories. W e add interaction terms b et ween the Cham b er and bill characteristics, e.g. whether the bill originated in the Senate and the n umber of characters, to estimate these interaction effects p oten tially automatically learned b y the tree mo dels. Finally , we estimate the relationship b et ween the resulting matrix of input v alues and the vector of predicted probability outputs with a partial rank correlation co efficien t (PR CC) analysis, which estimates the correlation b et ween an input v ariable and the predicted probability of bill enactment, discounting the effects of the other inputs and allo wing for p oten tially non-linear relationships by rank-transforming the data b efore mo del estimation [20, 21]. Partial correlation controls for the other predictor v ariables, Z , by computing the correlation b etw een the r esiduals of regressing the predictor of in terest, x , on Z and the r esiduals of regressing the outcome (predicted probabilit y of enactment) on Z . The PR CC analysis is b ootstrapp ed 1,000 times to obtain 95% confidence interv als. 2.4 Data W e include all House and Senate bills and exclude simple, joint, and concurrent resolutions b ecause simple and concurrent resolutions do not hav e the force of la w and join t resolutions are very rare. W e do wnloaded all bill data (from the 103rd Congress through the 113th Congress) other than committee membership from go vtrack.us/dev elopers/data, which is created by scraping THOMAS.gov. W e do wnloaded committee membership data from w eb.mit.edu/17.251/www/data page.html [22, 23]. There is often more than one version of the full text for each bill. In order to create a forecasting problem that predicts enactment as so on as p ossible, the earliest dated full text is used, whic h is, for more than 99% of the bills in the testing data, the text as it w as introduced. T o understand how m uch predictive p o wer newer versions add, we collect the most recen t version of each bill, which is, for 87% of the bills in the testing data, the version as introduced. Bills can change dramatically b et ween the time of their in tro duction and the time of the last action tak en on them. H.R. 3590 in the 111th Congress, w as a short bill on housing tax changes for service members when it was 5/14 in tro duced, and shortly b efore it was enacted it was the 906-page Affordable Care Act. H.R. 34 in the 114th Congress w as originally introduced as the Tsunami W arning, Education, and Researc h Act and was ab out 30 pages long. Shortly b efore it was enacted, H.R. 34 w as the 312-page 21st Century Cures Act. The full text of all introduced bills is only av ailable starting with the 103rd Congress (1993–1995) and therefore this is the first Congress used to train language mo dels. The 104th Congress is the first used to train the base mo dels of the ensemble b ecause they require the language mo del predictions and the language mo dels need the 103rd for training. The 107th Congress (2001–2003) is the first to serve as a testing Congress b ecause the full mo del needs mul tiple Congresses worth of data for training. W e used the list of predictor v ariables from [2] as a starting p oint for designing our feature set. The follo wing v ariables capture characteristics of a bill’s sp onsor and committee(s): • r e gion : region corresp onding to state the sp onsor represents (5 levels). • sp onsorPartyPr op : prop ortion of cham b er in sp onsor’s party (min: 0, median: 0.51, max: 0.59). • sp onsorT erms : num b er of terms sp onsor has served in Congress (only up to Congress b eing predicted to ensure mo del is only using data that would hav e b een a v ailable at that time, min: 1, median: 6, max: 30). • c ommitte eSeniority : mean length of time sp onsor has b een on the committees the bill is assigned to (min: 0, median: 0, max: 51). If not on committee, assigned 0. • c ommitte ePosition : out of any leadership p osition of sp onsor on any committee bill is assigned to, lo west num ber on the “leadership co des” list in S1 App endix (11 lev els, e.g. Chairman). • NotMajOnCom : binary for whether sp onsor is ( i ) not in ma jorit y party and ( ii ) on first listed committee bill is assigned to. • MajOnCom : binary for whether sp onsor is ( i ) in ma jority party and ( ii ) on first listed committee bill is assigned to. • numCosp onsors : num b er of co-sp onsors (for oldest - min: 0, median: 2, max: 378; for new est - min: 1, median: 6, max: 432). The follo wing v ariables capture p olitical and temp oral context of bills: • session : Session (first or second) of Congress that corresp onds to full text date, almost alwa ys the date bill was introduced for oldest data (for oldest - prop ortion in first session: 0.64; for new est - prop ortion in first session: 0.6). • house : binary for whether it’s a House bill. • month : month bill is introduced. The follo wing v ariables capture asp ects of bill conten t and characteristics: • subje ctsT opT erm : official top sub ject term (36 levels). • textL ength : n umber of characters in full text (for oldest - min: 119, median: 5,340, max: 2,668,424; for new est - min: 113, median: 5,454, max: 3,375,468). 6/14 T able 1. Mo del p erformance comparison (n=68,863). Lo wer mean brier score (MeanBrier) and mean log loss (MeanLogLoss) is b etter and higher AUC is b etter. w2vTitle has infinite log loss due to making predictions with 0 and 1 probabilities. Tw o-sample t-tests with alternative hypotheses that w2vGLM outp erforms its closest comp etitors are significant with p-v alues of 3.02e-53 (log loss newest data), 3.65e-26 (brier loss new est data), 9.73e-04 (log loss oldest data) and 5.36e-03 (brier loss oldest data). Mo del A UC MeanBrier MeanLogLoss w2vGLM 0.96 0.021 0.083 w2v 0.93 0.027 0.127 GLM 0.87 0.028 0.118 w2vTitle 0.81 0.049 Inf Null 0.58 0.035 0.157 w2vGLMOld 0.85 0.029 0.122 w2vOld 0.76 0.035 0.154 GLMOld 0.83 0.031 0.131 w2vTitleOld 0.8 0.047 Inf 3 Results 3.1 Prediction Exp erimen ts Fiv e mo dels are compared across the tw o time conditions. w2v is the scoring of full bill text with an in version of word2v ec-learned language representations [11]. W e take this approac h to textual prediction b ecause it pro vides the capacity to conduct a semantic similarit y text analysis across enacted and failed categories and can predict which sen tences of a bill contribute most to enactment. w2vTitle is title-only scoring with the same metho d. GLM is a regularized non-negative generalized linear mo del (GLM) meta-learner ov er an ensemble of a regularized GLM, a gradient b o osted mac hine and a random forest, whic h each use only the contextual v ariables (see Data section). w2vGLM is the same as GLM except the w2v and w2vTitle predictions are added as t wo more predictor v ariables for the three base learners. These are compared to a baseline, nul l , that uses the prop ortion of bills enacted in the same c hamber as the predicted bill across all previous Congresses as the predicted probability . F or instance, the prop ortion of bills enacted in the Senate from the 103rd to the 110th Congress was 0.04 and so this is the nul l predicted probability of enactment of a Senate bill in the 111th Congress. It’s imp ortan t to use Cham b er-sp ecific rates to improv e nul l p erformance b ecause bills originating in the House hav e a higher enactment rate. Using only text outp erforms using only context on tw o of three p erformance measures (A UC and Brier) for the newest data, while using only context outp erforms only text on three measures for the oldest data (Fig. 2). Using text and context together, w2vGLM , outp erforms all comp etitors on all measures for newest and oldest data (T able 1). When predicting enactment with the newest bill text and the up dated n umber of cosp onsors, text length and session, b oth mo dels improv ed but w2vGLM and w2v improv ed dramatically . w2vGLM has the highest A UC, w2v has the second highest for predictions with new data and GLM has the second highest for predictions with old data. Predicted probabilities of w2vGLM range from 0.01 to 0.99. In fact, the ma jority of the predicted probabilities are near 0 and 1 (S1 App endix). This is impressive given that it still main tains ov erall high p erformance on log and brier scoring, which significan tly p enalize mo dels for high probability predictions on the wrong side of 0.5. 7/14 0 20 40 60 A UC MeanBrier MeanLogLoss P erformance Measure % Improvement o ver Null Model Model w2vGLM w2v GLM w2vGLMOld w2vOld GLMOld Fig 2. P ercent improv ement of each mo del ov er nul l (n=68,863). Dashed lines separate new est and oldest data within each measure. Because w2vTitle has infinite log loss it’s not included in the figure. A. 0.00 0.25 0.50 0.75 1.00 enact not_enact Actual Enactment Outcome w2vGLM Predicted Probability of Enactment B. 0.00 0.25 0.50 0.75 1.00 enact not_enact Actual Enactment Outcome w2v Predicted Probability of Enactment C. 0.00 0.25 0.50 0.75 1.00 enact not_enact Actual Enactment Outcome w2vTitle Predicted Probability of Enactment D. 0.00 0.25 0.50 0.75 1.00 enact not_enact Actual Enactment Outcome GLM Predicted Probability of Enactment Fig 3. Bo xplots (n=68,863) of predicted probabilities of enacted and failed bills for w2vGLM ( A. ), w2v ( B. ), w2vTitle ( C. ), GLM ( D. ). The b o xes are the inter-quartile ranges (IQRs) of the predicted probabilities, the b old line is the median, the whiskers extend from ends of IQR to + / − 1 . 5 ∗ I QR . The central tendencies of the predicted probabilities (mean = 0.05, and median = 0.01) are close to the observed frequency of bill enactment, 0.04. The median of the predicted probabilities where the true outcome w as not enact (0.01) is muc h low er than the median of the predicted probabilities where the true outcome was enact (0.71) (Fig. 3A.). The w2v predicted probabilities (Fig. 3B.) demonstrate that with just the text of the bills, the mo del can make probabilistic predictions that discriminate b etw een enacted and failed bills, providing credibility to our textual semantic similarity analysis. In con trast, the title-only (Fig. 3C.) and context-only (Fig. 3D.) mo dels p oorly discriminate. W e conduct an error analysis (see S1 App endix) and find that, across all bill sub jects, w2vGLM and w2v b oth hav e the highest log loss on tw o categories of low economic imp ortance: Commemorations; and Arts, Culture, Religion. As a final in vestigation of mo del p erformance, we explore the w2vGLM predictions for the tw o most significan t bills in the past century: the ACA and the American Recov ery and Rein vestmen t Act of 2009 (ARRA). The density of the predicted probabilities for all 8/14 T able 2. Predicted probabilities of enactment for key bills. Probabilities increased b et w een old and new forecasts for the tw o enacted bills, and the mean of the probabilities for the failed bills decreased. ShortTitle F orecastNew F orecastOld BaselineF orecast A CA 0.6 0.23 0.05 F ailed Amend Rep eal 0.02 0.03 0.05 ARRA 0.55 0.52 0.05 bills is p eak ed around 0.01 (S1 App endix) and the predicted probabilities for the ACA and ARRA w ere > 0 . 5 (T able 2). None of the 296 other bills with “Patien t Protection and Affordable Care Act” in the title were enacted. These bills (all official titles listed in S1 App endix) attempted to amend or rep eal the ACA, whic h could hav e had significant economic effects. In 2012, the Congressional Budget Office estimated that H.R. 6079, the Rep eal of Obamacare Act, would cause a $ 109 billion net increase in federal deficits [24]. w2vGLM ’s predicted probabilities for these failed attempts are muc h more useful than nul l ’s (T able 2). 96% of the (unsuccessful) bills to rep eal and amend the A CA hav e lower predicted probabilities of enactment from w2vGLM than from nul l . 3.2 Analysis No w that we ha ve a mo del v alidated on thousands of predictions, we analyze it to b etter understand law-making. With our language mo dels, w e create “syn thetic summaries” of h yp othetical bills b y providing a set of words that capture any topic of interest. Comparing these syn thetic summaries across cham ber and across Enacted and F ailed categories unco vers textual patterns of how bill conten t is asso ciated with enactment. The title summaries are derived from inv estigating similarities within w2vTitle and the b ody summaries are derived from similarities within w2v . Distributed representations of the w ords in the bills capture their meaning in a wa y that allows semantically similar w ords to b e disco vered. Although bills may not hav e b een devoted to the topic of in terest within any of the four training data sub-corp ora, these synthetic summaries can still yield useful results b ecause the queried words hav e b een embedded within the seman tically structured vector space along with all vocabulary in the training bills. This is imp ortan t for a topic, suc h as climate change, with little or no relev an t enacted legislation. T o demonstrate the p ow er of our approac h, we inv estigated the words that b est summarize “climate c hange emissions”, “health insurance p o vert y”, and “technology paten t” topics for Enacted and F ailed bills in b oth the House and Senate (Fig. 4). “Impacts,” “impact,” and “effects” are in House Enacted while “warming,” “global,” and “temp erature” are in House F ailed, suggesting that, for the House climate change topic, highligh ting p oten tial future impacts is asso ciated with enactmen t while emphasizing increasing global temp eratures is asso ciated with failure. In b oth cham b ers, “efficiencies” is in Enacted and “v ariability” is in F ailed. In the Senate, “anthropogenic” (h uman-induced) and “sequestration” (removing greenhouse gases) are in F ailed. F or the health insurance p ov erty topic, “medicaid” and “reinsurance” are in b oth House and Senate F ailed. The Senate has words related to more sp ecific health topics, e.g. “imm unization” for F ailed and “psychiatric” for Enacted. F or the patent topic, b oth c hambers hav e a word related to water (“fish” and “marine”) in the F ailed Titles and “geospatial” in the F ailed Bo dies. Given recent legal developmen ts regarding patenting soft ware, it’s notable that “softw are” and “computational” are in F ailed for the House and Senate, resp ectiv ely . Our language mo del provides sentence-lev el predictions for an ov erall bill and thus 9/14 impacts diversion potential nitrogen impact effects wildfires future degradation mitigate posing efficiencies cosmetic growth expansion additional administration warming global leakage risk, temperature constraints bycatch congestion variability mercury negative reliability suspend exchange terminate products lending contamination mitigating disruption flooding fishery , ear th economy , spills efficiencies threat targets growth, models, privacy programs authorities control pilot sequestration mercury emission warming volume anthropogenic variability economy penetration temperature congestion impacts, nuclear recreational cooperative area, space benefits benefit quality catastrophe employer−sponsored co verage welfare disability market make deposit rev enue exclude trade pension reinsurance medicaid dental uninsured medical hospital medicare child insurers, uncompensated medicaid patient assure supplemental act defender hospice means−tested long−term respite index, institutional illness, themselves, kinship psychiatric illness imminent pain spouses block needs efficiency institutions employer−sponsored reinsurance health−related choice uninsured elderly elderly , medicaid welfare chronic immunization hapi dental adequate choice long−term about plans dissemination registry complaint laboratory space reliable invention research petition dissemination, registration corporation personal convicted basis enhance species copyright scientific sensor manufacturing technologies, technique technological confidential software geospatial commerce fish agency authorities further budget, systems registration capability , breach, munitions processes, included, processes registration, processing, naturalization processed support with 2004 mental delivery patents patents, copyright telecommunications, inv ention technologies, computational technological geospatial telecommunications state−of−the−art great marine commission, restoration implementation climate change emissions House climate change emissions Senate health insurance poverty House health insurance poverty Senate technology patent House technology patent Senate Body Title Body Title Body Title Enacted Failed Enacted Failed Fig 4. Syn thetic summary bills for three topics across Enacted and F ailed and House and Senate categories. predicts what sections of a bill may b e the most imp ortan t for increasing or decreasing the probabilit y of enactment. Fig. 5 compares patterns of predicted sentence probabilities as they evolv e from the b eginning to the end of bills across four categories: enacted and failed and new est and oldest texts. In the newest texts of enacted bills, there is m uch more v ariation in predicted probabilities within bills. W e conducted a partial rank correlation co efficient sensitivity analysis to estimate the effect of eac h predictor v ariable on the predicted probability of enactment. These are not biv ariate correlations b etw een v ariables and the predicted probabilities, rather, they are estimates of correlation after c ontr ol ling for the effect of all other predictor v ariables, e.g. the effect of a bill b eing introduced in the House is negative after con trolling for the other effects in the mo del (Fig. 6B.) but bills in tro duced in the House are enacted at a 0.043 rate while Senate bills are enacted at a 0.025 rate. If we stopp ed with the simple descriptive statistic we could hav e incorrectly concluded that in tro ducing a bill in the House will increase its o dds, all else equal. The t wo sub jects with the largest negative effects are F oreign T rade and In ternational Finance, and T axation (Fig. 6A.). Some bills fail b ecause their conten t is in tegrated into other bills and this is esp ecially true for tax-related bills [2]. With the oldest data mo del, increasing bill length decreases enactment probability but with the new est data the opp osite relationship holds (Fig. 6B.). W e rep eated the sensitivity analysis on the mo del where no text predictions are included ( GLM , see S1 App endix), and found that, under b oth time conditions, when we don’t control for the probability of the text b y including our language mo del predictions ( GLM ), longer texts are more negativ e than when w e control for the text ( w2vGLM ), and that this difference is m uch larger for the new est data. This suggests that the b etter w e capture the probability of the text and control for its effects, the b etter w e isolate estimates of non-textual effects. If the bill sp onsor’s party is the ma jorit y party of their cham b er, the probability of the bill is muc h higher, esp ecially with the oldest data where the mo del relies on this as a k ey signal of success. Increasing the num ber of terms the sp onsor has served in Congress also has a p ositiv e effect. The predictiv e mo del learned in teractions as well: the n umber of co-sp onsors has a stronger p ositiv e effect in the Senate for the new est 10/14 A. 0.1 0.2 0.3 2.5 5.0 7.5 10.0 Relative P osition in Bill Probability of Enactment for First T e xts Enacted Failed B. 0.1 0.2 0.3 2.5 5.0 7.5 10.0 Relative P osition in Bill Probability of Enactment for Last T e xts Enacted Failed Fig 5. Sen tence probabilities across bills for oldest data ( A. ), newest data ( B. ). F or eac h bill, we conv ert the v ariable length vectors of predicted sentence probabilities to n -length vectors by sampling n evenly-spaced p oin ts from each bill. W e set n=10 b ecause almost every bill is at least 10 sentences long. Then we lo ess-smo oth the resulting p oin ts across all bills to summarize the difference b et w een enacted and failed and new est and oldest texts. data and in the House for the oldest data. If the bill text scored by the language mo del is in the second session of the Congress, for the newest data mo del, this can serve as a signal that a bill is b eing up dated and thus it has a higher chance of enactment. F or the oldest data, this means the bill w as introduced in the second session, which is not particularly indicativ e of success or failure. 4 Discussion W e compared five mo dels across three p erformance measures and tw o data conditions o ver 14 years. A mo del using only bill text outp erforms a mo del using only bill context for new est data, while context-only outp erforms text-only for oldest data. In all conditions text consisten tly adds predictive p o wer. In addition to accurate predictions, we are able to improv e our understanding of bill con tent by using a text mo del designed to explore differences across c hamber and enactmen t status for imp ortan t topics. Our textual analysis serves as an exploratory to ol for inv estigating subtle distinctions across categories that w ere previously imp ossible to inv estigate at this scale. The same analysis can b e applied to an y w ords in the large legislativ e vocabulary . The global sensitivity analysis of the full mo del pro vides insights into the v ariables affecting predicted probabilities of enactment. F or instance, when predicting bills as they are first introduced, the text of the bill and the prop ortion of the cham b er in the bill sp onsor’s party hav e similarly strong p ositive effects. The full text of the bill is by far the most imp ortan t predictor when using the most up-to-date data. The oldest data mo del relies more on title predictions than the new est data mo del, whic h is understandable given that titles rarely change after bill in tro duction. Comparing effects across time conditions and across mo dels not including text suggests that controlling for accurate estimates of the text probability is imp ortan t for estimating the effects of non-textual v ariables. Although the effect estimates are not causal and estimates on predictors correlated with eac h other may b e biased, they represen t our b est estimates of predictiv e relationships within a mo del with the strongest predictive p erformance and are thus useful for understanding the pro cess of law-making. This metho dology can b e applied to 11/14 A. −0.10 −0.05 0.00 0.05 0.10 Agricultureandfood Animals Armedforcesandnationalsecurity Artsculturereligion Civilrightsandliber tiesminorityissues Commemorations Commerce Congress Crimeandlawenforcement Economicsandpublicfinance Education Emergencymanagement Energy Environmentalprotection F amilies Financeandfinancialsector Foreigntradeandinternationalfinance Governmentoperationsandpolitics Health Housingandcommunitydev elopment Immigration Internationalaffairs Laborandemployment Law NativeAmericans Privatelegislation Publiclandsandnaturalresources Sciencetechnologycommunications Socialwelfare Sportsandrecreation T axation T ranspor tationandpub licworks Waterresourcesde velopment P ar tial Rank Correlation Coefficient Data Condition Newest V ersion Oldest V ersion B. 0.00 0.25 0.50 w2vProb w2vTitleProb House House*numCosponsors House*sponsorPartyProp House*textLength numCosponsors textLength T ext2ndSession partyProp sponsorT erms committeeSeniority 1stRankingMinorityMember 2ndChairman 2ndRankingMinorityMember ActingChairman notOnCommittee OnlyChairman OnlyRankingMinorityMember OnlyViceChairman otherCommitteeP osition NotMajOnCom MajOnCom Northeast Other South West Feb Mar Apr May Jun Jul Aug Sep Oct Nov Dec P ar tial Rank Correlation Coefficient Data Condition Newest V ersion Oldest V ersion Fig 6. P artial rank correlation co efficien t estimates b et w een all w2vGLM predictor v ariables and predicted probabilities (n=55,695, the subset of the observ ations used to predict the 113th Congress that had no missing v alues). Bars represen t 95% confidence in terv als. A. Effects of top sub jects. So cial Sciences and History is used as the reference sub ject so no effect is estimated for that factor level. B. Effects of all other v ariables other than sub ject. January and North Central are the reference levels for the month and region factors. This means they are the base level that is not included as a predictor v ariable itself – the standard practice when estimating linear mo dels with factor v ariables. See S1 App endix for same analysis of GLM . 12/14 analyze an y predictive mo del b y treating it as a “black-box” data-generating pro cess, therefore predictiv e p o wer of a mo del can b e optimized and subsequent analysis can unco ver interpretable global relationships b et ween predictors and output. Our work pro vides guidance on effectively combining text and context for prediction and analysis of complex systems with highly im balanced outcomes that are related to textual data. Our system for determining the probabilit y of enactment across the thousands of bills under consideration fo cuses effort on legislation that is likely to matter, allowing users to iden tify p olicy signal amid p olitical and pro cedural noise. Supp orting Information S1 App endix Supplementary Information. References 1. Martin T, Hofman JM, Sharma A, Anderson A, W atts DJ. Exploring Limits to Prediction in Complex So cial Systems. In: Pro ceedings of the 25th International Conference on W orld Wide W eb. WWW ’16. International W orld Wide W eb Conferences Steering Committee; 2016. p. 683–694. Av ailable from: http://dx.doi.org/10.1145/2872427.2883001 . 2. Y ano T, Smith NA, Wilkerson JD. T extual Predictors of Bill Surviv al in Congressional Committees. In: Pro ceedings of the 2012 Conference of the North American Chapter of the Asso ciation for Computational Linguistics: Human Language T ec hnologies. NAACL HL T ’12. Asso ciation for Computational Linguistics; 2012. p. 793–802. Av ailable from: http://dl.acm.org/citation.cfm?id=2382029.2382157 . 3. W ang E, Liu D, Silv a J, Carin L, Dunson DB. Join t Analysis of Time-Evolving Binary Matrices and Asso ciated Do cumen ts. In: Lafferty JD, Williams CKI, Sha we-T aylor J, Zemel RS, Culotta A, editors. Adv ances in Neural Information Pro cessing Systems 23. Curran Asso- ciates, Inc.; 2010. p. 2370–2378. Av ailable from: http://papers.nips.cc/paper/ 4152- joint- analysis- of- time- evolving- binary- matrices- and- associated- docum ents. pdf . 4. Gerrish SM, Blei DM. Predicting legislative roll calls from text. In: In Pro c. of ICML; 2011. 5. Wilk erson J, Smith D, Stramp N. T racing the Flo w of Policy Ideas in Legislatures: A T ext Reuse Approach. American Journal of Political Science. 2015-10-01;59(4):943–956. doi:10.1111/a jps.12175. 6. Katz DM, Bommarito MJ, Blackman J. Predicting the Behavior of the Supreme Court of the United States: A General Approach . 2014-07-21;(ID 2463244). 7. Na y JJ. Gov2V ec: Learning Distributed Representations of Institutions and Their Legal T ext. In: Pro ceedings of 2016 EMNLP W orkshop on Natural Language Pro cessing and Computational So cial Science. Asso ciation for Computational Linguistics; 2016. p. 49–54. Av ailable from: http://www.aclweb.org/anthology/W16- 5607 . 8. Mik olov T, Sutskev er I, Chen K, Corrado GS, Dean J. Distributed Represen tations of W ords and Phrases and their Comp ositionalit y . In: Burges 13/14 CJC, Bottou L, W elling M, Ghahramani Z, W ein b erger KQ, editors. Adv ances in Neural Information Pro cessing Systems 26. Curran Asso- ciates, Inc.; 2013. p. 3111–3119. Av ailable from: http://papers.nips.cc/paper/ 5021- distributed- representations- of- words- and- phrases- and- their- compositi onality. pdf . 9. Bengio Y, Duc harme R, Vincent P , Jan vin C. A Neural Probabilistic Language Mo del. J Mach Learn Res. 2003-03;3:1137–1155. 10. Reh urek R, So jk a P . Softw are F ramew ork for T opic Mo delling with Large Corp ora. In: Pro ceedings of the LREC 2010 W orkshop on New Challenges for NLP F ramew orks. ELRA; 2010. p. 45–50. 11. T addy M. Do cument Classification b y Inv ersion of Distributed Language Represen tations. In: Pro ceedings of the 53rd Ann ual Meeting of the Asso ciation for Computational Linguistics. vol. Short Papers. Asso ciation for Computational Linguistics; 2015-07-31. p. 45–49. 12. Breiman L, F riedman J, Stone CJ, Olshen RA. Classification and Regression T rees. 1st ed. Chapman and Hall/CRC; 1984-01-01. 13. F riedman JH. Greedy F unction Approximation: A Gradient Bo osting Machine. The Annals of Statistics. 2001;29(5):1189–1232. 14. Breiman L. Random F orests. Machine Learning. 2001-10-01;45(1):5–32. doi:10.1023/A:1010933404324. 15. www h2o ai. H2O.ai. 2016;. 16. Breiman L. Stack ed Regressions. Machine Learning. 1996-07;24(1):49–64. doi:10.1023/A:1018046112532. 17. v an dLMJ, Polley EC, Hubbard AE. Sup er Learner. Statistical Applications in Genetics and Molecular Biology . 2007;6(1). doi:10.2202/1544-6115.1309. 18. Altman DG, Bland JM. Diagnostic tests 3: receiver op erating characteristic plots. BMJ : British Medical Journal. 1994-07-16;309(6948):188. 19. Saltelli A, Annoni P . How to av oid a p erfunctory sensitivity analysis. En vironmental Mo delling & Softw are. 2010-12;25(12):1508–1517. doi:10.1016/j.en vsoft.2010.04.012. 20. Pujol G, Io oss B, Janon A, Boumhaout K, Da V eiga S, Delage T, et al. sensitivit y: Sensitivity Analysis. 2014-08-26. Av ailable at: h ttp://cran.r-pro ject.org/w eb/pac k ages/sensitivity/index.h tml 21. Saltelli A, Chan K, Scott EM. Sensitivit y Analysis. 1st ed. Wiley; 2009-03-16. 22. Stew art I II C, W oon J. Congressional Committee Assignments, 103rd to 112th Congresses, 1993-2013: Senate [April 11, 2011]; 2011. 23. Stew art I II C, W oon J. Congressional Committee Assignments, 103rd to 113th Congresses, 1993-2015: House [Marc h 9, 2016]; 2016. 24. Office CB. Letter to the Honorable John Bo ehner providing an estimate for H.R. 6079, the Rep eal of Obamacare Act; 2012. Av ailable from: https://www.cbo.gov/publication/43471 . 14/14
Original Paper
Loading high-quality paper...
Comments & Academic Discussion
Loading comments...
Leave a Comment