Probabilistic Inference of Twitter Users Age based on What They Follow
Twitter provides an open and rich source of data for studying human behaviour at scale and is widely used in social and network sciences. However, a major criticism of Twitter data is that demographic information is largely absent. Enhancing Twitter …
Authors: Benjamin Paul Chamberlain, Clive Humby, Marc Peter Deisenroth
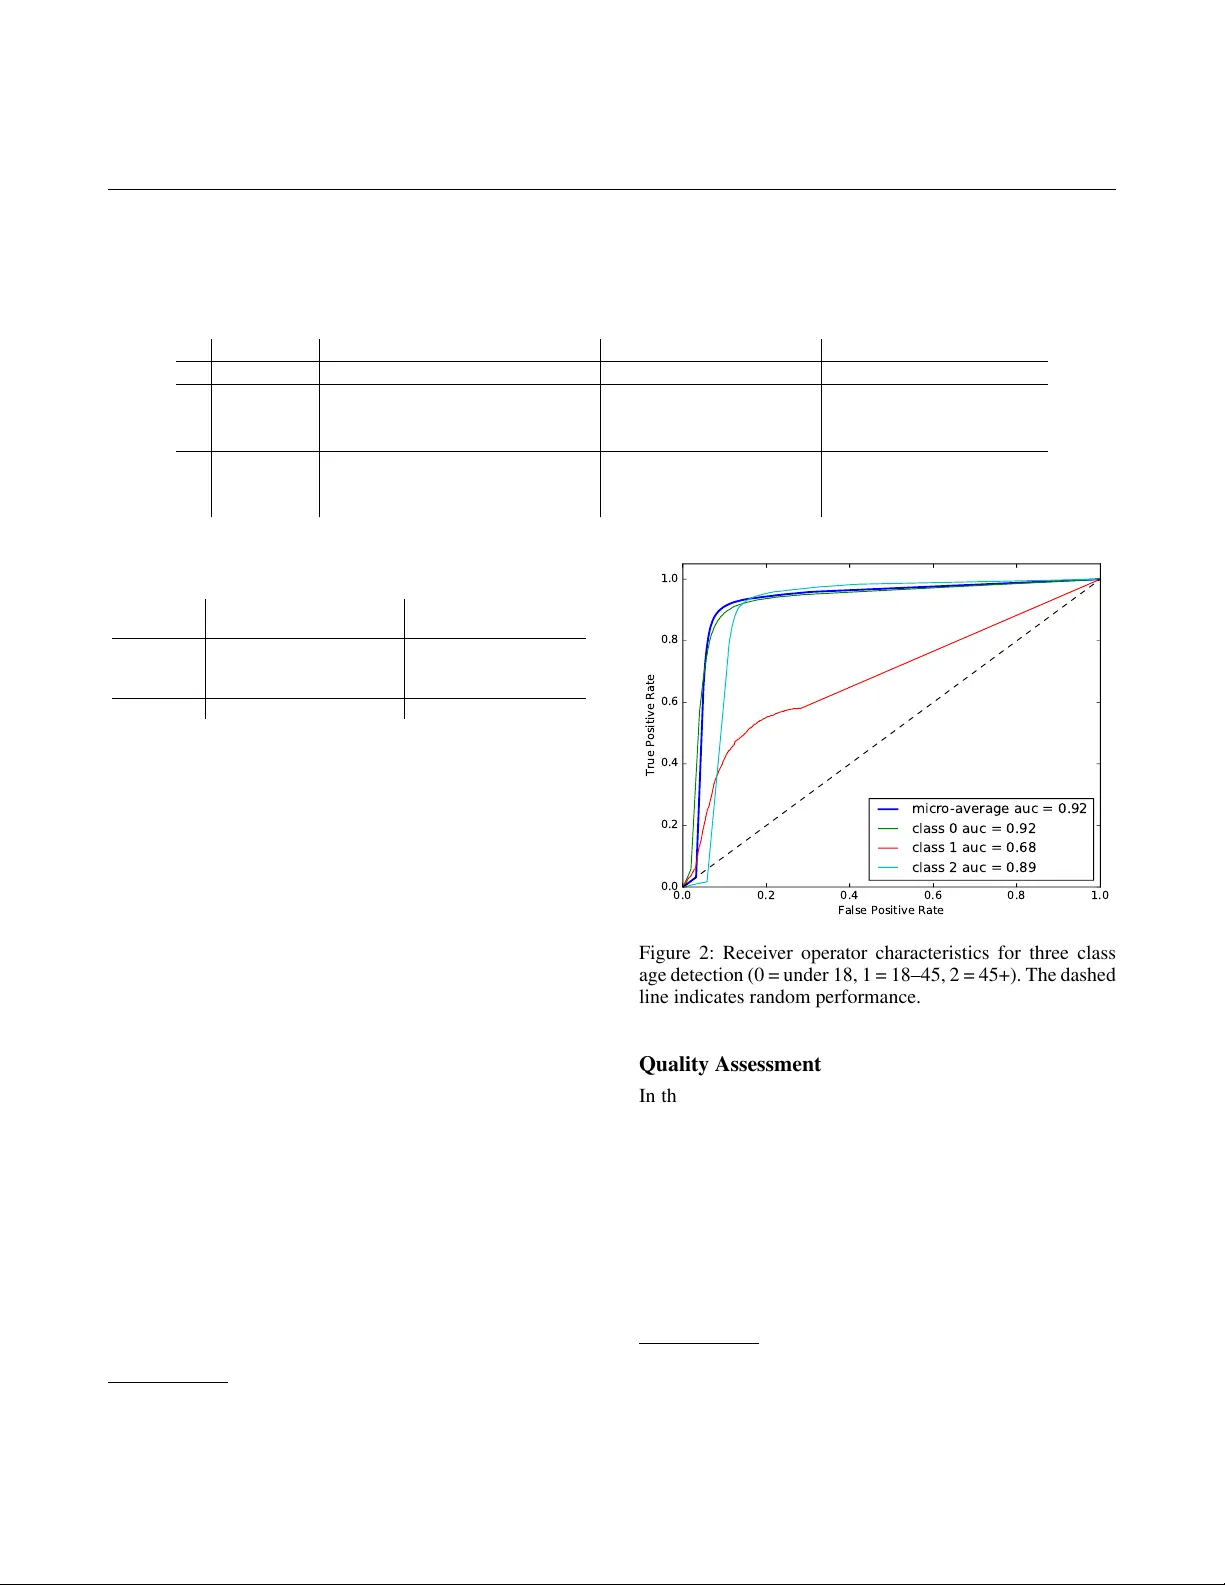
Pr obabilistic Infer ence of T witter Users’ Age based on What They F ollow Benjamin Paul Chamberlain 1 Clive Humby 2 Marc P eter Deisenr oth 1 1 Department of Computing, Imperial College London, London, UK 2 Starcount Insights, 2 Riding House Street, London, UK Abstract T witter provides an open and rich source of data for study- ing human behaviour at scale and is widely used in social and network sciences. Howe ver , a major criticism of T witter data is that demographic information is largely absent. Enhancing T witter data with user ages would adv ance our ability to study social network structures, information flo ws and the spread of contagions. Approaches to w ard age detection of T witter users typically focus on specific properties of tweets, e.g., linguis- tic features, which are language dependent. In this paper, we devise a language-independent methodology for determining the age of T witter users from data that is nati v e to the T witter ecosystem. The k ey idea is to use a Bayesian framework to generalise ground-truth age information from a few T witter users to the entire network based on what/whom they follo w . Our approach scales to inferring the age of 700 million T wit- ter accounts with high accuracy . Introduction Digital social networks (DSNs) produce data that is of great scientific value. They have allowed researchers to study the flow of information, the structure of society and major polit- ical ev ents (e.g., the Arab Spring) quantitati v ely at scale. Owing to its simplicity , size and openness, T witter is among the most popular DSNs used for scientific research. On the T witter platform users generate data by tweeting a stream of 140 character (or less) messages. T o consume con- tent users follow each other . Follo wing is a one-w ay interac- tion, and for this reason T witter is reg arded as an inter est network (Gupta, 2013). By default, T witter is entirely pub- lic, and there are no requirements for users to enter personal information. The lack of reliable (or usually any) demographic data is a major criticism of the usefulness of T witter for research pur - poses. Enriching T witter accounts with demographic infor- mation (e.g., age) w ould be v aluable for scientific, industrial and gov ernmental applications. Explicit examples include opinion polling, product ev aluations and market research. Our assumes that people who are close in age have simi- lar interests as a result of age-related life e vents (e.g., educa- tion, child birth, marriage, employment, retirement, wealth changes). This is an example of the well-known homophily Copyright c 2017, Association for the Advancement of Artificial Intelligence (www .aaai.org). All rights reserved. principle, which states that people with related attributes form similar ties (McPherson, 2001). For age inference in T witter , we exploit that most Follo ws 1 are indicativ e of a user’ s interests. Putting things together , we arri v e at our cen- tral h ypothesis that (a) somebody follows what is interesting to them, (b) their interests are indicati v e of their age. Hence, we propose to infer somebody’ s age based on what/whom they Follow . W e created the artificial @williamockam ac- count shown in Figure 1 to use as a running example to il- lustrate our method. The contribution of this paper is the deriv ation of a prob- abilistic model that infers any T witter user’ s age only based on what/whom they Follow , which is not restricted by na- tional and linguistic boundaries. Our model handles the high lev els of noise in the data in a principled way and is mas- siv ely scalable allowing us to infer the age of 700 million T witter accounts with high accuracy . In addition we supply a new public dataset for use by researchers interested in the problem of attributing v ertices in social networks. Related W ork There is a lar ge body of e xcellent research on enhancing so- cial data with demographic attrib utes. This includes work on gender (Burger, 2011), political affiliation (Conover, 2011; Pennacchiotti, 2011), location (Cheng, 2010) and ethnic- ity (Mislo ve, 2011; Chang, 2010; Pennacchiotti, 2011). Also of note is the work of Fang (2015) who focus on modelling the correlations between various demographic attrib utes. Some of the most exciting recent work on detecting ages from social data has been in the field of computer vision where age is determined from user images (Fu, 2010; Guo, 2008). Howe ver , computer vision methods are dif ficult to apply to T witter data: few accounts have profile images and those that do are often inaccurate or of poor quality . Follo wing the seminal work of Schler (2006), the major- ity of research on age detection of T witter users has focused on linguistic models of tweets (Nguyen, 2011; Rao, 2010; Al Zamal, 2012). Notably , Nguyen (2013) developed a lin- guistic model for Dutch tweets that allows them to predict the age category (using logistic regression) of T witter users who have tweeted more than ten times in Dutch. They per- 1 we use capitalisation to indicate the T witter specific usage of this word formed a lexical analysis of Dutch language tweets and ob- tained ground truth through a labour intensiv e manual tag- ging process. The principal features were unigrams, assum- ing that older people use more positi v e language, fe wer pro- nouns and longer sentences. They concluded that age pre- diction works well for young people, but that abov e the age of 30, language tends to homogenise. In general, lexical approaches suffer from the concept of social age (DongNguyen, 2014). Social age is determined by life stage (married, children, employment etc.) rather than years since birth, and it has a strong affect on writing style. People often adapt their language to mimic the perceived social norm in a group. Additionally , tweet-based methods struggle to make predictions for T witter users with low tweet counts. In practice, this is a major problem since we calcu- lated that the median number of tweets for the 700m T witter users in our data set is only 4 (the tweets field sho wn in Fig. 1 is av ailable as account metadata for all accounts). The user name has also been considered as a source of demographic information. This w as first done by Liu (2013) to detect gender and later by Oktay (2014) to estimate the age of T witter users from the first name supplied in the free- text account name field (e g. W illiam in Figure 1). In their research, they use US social security data to generate prob- ability distrib utions of birth years gi v en age. They sho w that for some names age distributions are quite sharply peaked. A potential issue with this approach is that methods based on the “user name” field rely on knowledge of the user’ s true first name and their country of birth (Oktay, 2014). In practice, this assumption is problematic since T witter users often do not use their real names, and their country of birth is generally unknown. Approaches to combine lexical and network features in- clude Al Zamal (2012); Pennacchiotti (2011), who show that using the graph structure can improve performance at the expense of scalability . Kosinski (2013) used Facebook- Likes to predict a broad range of user attributes mined from 58,466 survey correspondents in the US. Their approach of solely using Facebook Likes as features for learning has the benefit of generalising readily to dif ferent locales. Culotta (2015) ha ve applied a similar Follower based approach to T witter to predict demographic attributes, howe ver their ap- proach of using aggre gate distributions of website visitors as ground-truth is restricted to predicting the aggregate age of groups of users. Our work is inspired by the generality of the approaches of K osinski (2013) and Culotta (2015), howe ver our setting differs in two ways. W e use data nativ e to the T witter ecosystem to generalise from a few examples to make indi vidual predictions for the entire T witter popula- tion. Secondly we do not make the assumption that our sam- ple is an unbiased estimate of the T witter population and we explicitly account for this bias to make good population pre- dictions. For these reasons it is hard to get ground truth and careful probabilistic modelling is required to infer the age of arbitrary T witter users. Probabilistic Age Infer ence in T witter Our age inference method uses ground-truth labels (users who specify their age), which are then generalised to 700m Figure 1: A T witter profile for @williamockam that we cre- ated and use to illustrate the method. The profile contains the name, T witter handle, number of tweets, number of follow- ers, number of people follo wing and a free-text description field with age information. accounts based on the shared interests, which we deri v e from Follo wing patterns. Data Collection and Ground-T ruth Labels T o extract ground-truth labels we cra wl the T witter graph and do wnload user descriptions. T o do this we implemented a distributed W eb cra wler using T witter access tokens mined through sev eral consumer apps. T o maximize data through- put while remaining within T witter’ s rate limits we built an asynchronous data mining system connected to an access to- ken server using Python’ s T wisted library W ysocki (2011). Our crawl do wnloaded 700m user description fields. Fig. 1 sho ws the T witter profile with associated metadata fields for the fictitious @williamockam account, which we use to illustrate our approach. W e inde x the free-te xt descrip- tion fields using Apache SOLR (Grainger, 2014) and search the index for REGular EXpression (REGEX) patterns that are indicative of age (e.g., the phrase: “I am a 22 year old” in Fig. 1) across T witter’ s four major languages (English, Spanish, French, Portuguese). For repeatability we include our REGEX code in the Appendix. T witter is ten years old and contains man y out-of-date de- scriptions. T o tackle the stale data problem we restricted the ground-truth to acti ve accounts, defined to be accounts that had tweeted or Follo wed in the last three months (we do not have access to T witter’ s logs). This process discovered 133,000 active users who disclosed their age (i.e., 0 . 02% of the 700m indexed accounts), which we use as “ground- truth” labels. For each of these we download every account that they Followed. Fig. 1 shows that @williamockam Fol- lows 73 accounts and we do wnloaded each of their user IDs. W e use ten age categories with a higher resolution in younger ages where there is more labelled data. For our ground-truth data set, the age categories, number of ac- counts, relati v e frequency and average number of features per category are sho wn in T able 1. T able 1: Ground-truth data set: Age categories and counts. “Mean features” giv es the av erage number of feature ac- counts followed. idx age range count freq mean features 0 under 12 7,753 5.9% 23.7 1 12–13 20,851 15.8% 27.9 2 14–15 30,570 23.1% 30.8 3 16–17 23,982 18.1% 28.7 4 18–24 33,331 25.2% 26.0 5 25–34 9,286 7.0% 23.1 6 35–44 3,046 2.3% 22.6 7 45–54 1,838 1.0% 16.0 8 55–64 962 0.7% 11.4 9 ov er 65 596 0.5% 11.2 Applying REGEX matches to free-text fields ine vitably leads to some false positiv es due to unanticipated character combinations when w orking with lar ge data sets. In addi- tion, many T witter accounts, while correctly labelled, may not represent the interests of human beings. This can oc- cur when accounts are controlled by machines (bots), ac- counts are set up to look authentic to distribute spam (spam accounts) or account passwords are hacked in order to sell authentic looking Follo wers. T o reduce the impact of spurious accounts on the model we note that (1) incorrectly labelled accounts can have a large ef fect on the model as they are distant in feature space from other members of the class / label (2) incorrectly la- belled accounts that hav e a small effect on the model (e g. because they only follo w one popular feature) do not matter much by definition. T o measure the effect of each labelled account on the model we compute the Kullback-Leibler di- ver gence KL ( P || P \ i ) between the full model and a model ev aluated with one data point missing. Here, P is the likeli- hood of the full, labelled data set, and P \ i is the likelihood of the model using the labelled data set minus the i th data point. This methodology identifies any accounts that have a particularly large impact on our predictiv e distribution. W e flagged an y training e xamples that were more than three me- dian absolute deviations from the median score for man- ual inspection. This process excluded 246 accounts from our training data and examples are shown in T able 2. W e also randomly sampled 100 data points from across the full ground-truth set and manually verified them by inspecting the descriptions, tweets and who / what they F ollo w . Public Dataset For reproducibility we make an anonymised sample of the data and our code publicly av ailable 2 . The data is in two parts: (1) A sparse bipartite adjacency matrix; (2) a vector of age category labels. This dataset was collected and cleaned according to the methodology described abov e and then down-sampled to giv e approximately equal numbers of labels in each of se ven classes detailed in T able 3. It includes only accounts that explicitly state an age (ie. no grandparents or retirees). The 2 address temporarily remov ed for anonymity adjacency matrix is in the format of a standard (sparse) design matrix and includes only features that are Followed by at least 10 examples. The high lev el statistics of this network are described in T able 4. Age Inference based on F ollows Giv en a set of 133,000 labelled data points (ground-truth, i.e., T witter users who reveal their age) we wish to infer the age of the remaining 700m T witter users. For this purpose, we define a set of features that can be e xtracted automati- cally . The features are based on the F ollo wing patterns of T witter users. Once the features are defined, we propose a scalable probabilistic model for age inference. A utomatic F eature Selection Our age inference exploits the hypothesis that someone’ s interests are indicativ e of their age, and uses T witter F ollo ws as a proxy for interests. There- fore, the features of our model are the 103,722 T witter ac- counts that are F ollo wed by more than ten labelled accounts, which can be found automatically . Of the 73 accounts Fol- lowed by @williamockam, 8 had suf ficient support to be in- cluded in our model. These were: Lord V oldemort7, W alt- DisneyW orld, Applebees, UniStudios, UniversalORL, Hor- rorNightsORL, HorrorNights and OlanRogers. T able 5 sho ws the number of labelled accounts Follo wing each @williamockam feature. The support is the number of labelled Follo wers summed o ver all age cate gories, while Follo wers giv es the total number of Follo wers (labelled and unlabelled). A general trend across all features (not only the ones rele vant to @williamockam) is that the age distrib ution is peaked towards “younger” ages as not many older people rev eal their age (we show this for the accounts with the high- est support in our data set in the Appendix). T o improve the predictiv e performance of the model in higher age categories we adapted our REGEX to search for grandparents and re- tirees. This augmented our training data with 176,748 peo- ple labelled as retired and 63,895 labelled as grandparents. In our ten-cate gory model, retired people are added to the 65+ category . Grandparents are assigned a uniform distri- bution across the three oldest age categories, which roughly reflects the age distribution of grandparents in the US (US- census, 2014) 3 , such that we ended up with approximately 374,000 labelled accounts in our ground-truth data. Probabilistic Model for Age Inference W e adopt a Bayesian classification paradigm as this provides a consis- tent framework to model the many causes of uncertainty (noisy labels, noisy features, survey estimates) encountered in the problem of age inference. Our goal is to predict the age label of an arbitrary T witter user with feature vector X gi ven the set of feature vectors X and corresponding ground-truth age labels A . Within a Bayesian framew ork, we are therefore interested in the pos- terior predictiv e distrib ution P ( A | X, X , A ) ∝ P ( X | A, X , A ) P ( A ) , (1) where P ( A ) is the prior distrib ution of T witter user ages and P ( X | A, X , A ) the likelihood. 3 This value w as used as the US is the largest T witter country . T able 2: Spurious data points identified by taking the Median Absolute De viation of the lea ve-one-out KL-Di v ergence. Handle T witter Description REGEX age Reason to Exclude RIAMOpera Opera at the Royal Irish ... Presenting: Ormindo Jan 11... 11 An Irish Opera T iaK eough13 My name T ia I’m 13 years old. 13 Hacked account 39yearoldvirgin I’m 39 years old... if you’ re a woman, I want to meet you. 39 Probably not 39 50Plushealths Retired insurance Agent After 40 years of Services. retired Using reciprocation software MrKRudd Former PM of Australia... Proud granddad of Josie & McLean... grandparent Outlier . Former A US PM T able 3: Public dataset labels: age categories and counts. idx age range count 1 10-19 4486 2 20-29 4485 3 30-39 4487 4 40-49 4485 5 50-59 4484 6 60-69 4481 7 70-79 4481 T able 4: Public dataset adjacency matrix statistics. Subscript 1 describes labelled acounts and 2 describes features. V is vertices, E edges and D de gree. attribute v alue | V 1 | 31,389 | V 2 | 50,190 | E | 1,810,569 avg D 1 57.7 max D 1 2049 std D 1 95.2 avg D 2 36.1 max D 2 4405 std D 2 96.2 The prior P ( A ) is based on a surv ey of American internet users conducted by Duggan (2013). They identified a sam- ple of 1,802 ov er -18-year olds (speaking either English or Spanish) using random cold calling and recorded their de- mographic information and use of social media. 288 of their respondents were T witter users, which yields a small data set that we can use for the prior prior distributions of ov er 18s. For under 18s we inferred the corresponding values of the prior using US census data (UScensus, 2010), which leads to our categorical prior P ( A ) = Cat ( π ) = [1 , 2 , 2 , 3 , 14 , 23 , 23 , 22 , 6 , 4] × 10 − 2 . (2) The likelihood P ( X | A, X , A ) is obtained as follo ws: For scalability we mak e the Nai v e Bayes assumption that the de- cision to Follow an account is independent giv en the age of the user . This yields the likelihood P ( X | A, X , A ) = Y M i =1 P ( X i | A, A , X ) X i , (3) where X i ∈ { 0 , 1 } and i indexes the features. X i = 1 means “user χ Follo ws feature account i ”. 4 W e model the likelihood factors P ( X i | A, A , X ) as Bernoulli distributions P ( X i | A = a ) = Ber ( µ ia ) , (4) i = 1 , . . . , M , where M is the number of features and there are 10 age categories indexed by a = 1 , . . . , 10 . Since our labelled data is sev erely biased towards “younger” age cat- egories we cannot simply learn multinomial distributions P ( A | X i ) for each feature based on the relativ e frequencies of their followers (see T able 1). T o smooth out noisy obser- vations of less popular feature accounts we use a hierarchical Bayesian model with conjugate data-dependent Beta priors Beta ( µ ia | b ia , c a ) (5) on the Bernoulli parameters µ ia . W e seek hyper-parameters b ia , c ia of the prior Beta ( µ ia | X , A ) , which do not hav e a large ef fect when ample data is a v ailable, b ut produce sensi- ble distributions when it is not. T o achiev e this we set c a to be constant across all features X i (hence dropping the i sub- script) and proportional to the total number of observations n a in each age category (the count column in T able 1). W e then set b ia ∝ n a n i K , where K = 7 × 10 8 is the total number of T witter users and n i is the number of Follo wers of feature i (the Follo wers column of table 5 for @williamockam’ s fea- tures). Then, the expected prior probability that user χ Fol- lows account i is E [ µ ia | A = a ] = b ia b ia + c a = n i K + n i , i.e., it is constant across age classes and v aries in proportion to the number of Follo wers across features. The effect of this pro- cedure is to reduce the model confidence for features where data is limited. Due to conjugacy , the posterior distribution on µ ia is also Beta distrib uted. Integrating out µ ia we obtain P ( X i = 1 | A = a, X , A ) (6) = 1 Z 0 P ( X i = 1 | µ i , A ) P ( µ i | X , A , A ) dµ i (7) = 1 Z 0 µ ia P ( µ ia | X , A ) dµ ia = E [ µ ia | X , A ] (8) = n ia + b ia n a + b ia + c a , (9) 4 W e only consider cases where X i = 1 since the T witter graph is sparse: In the full T witter graph there are 7 × 10 8 nodes with 5 × 10 10 edges, which implies a density of 1 . 6 × 10 − 7 , i.e., the de- fault is to follow nobody . Hence, not following an account does not contain enough information to justify the additional computational cost. T able 5: Follower counts for the eight @williamockam features. The support giv es their total number of Follo wers in our labelled data set and Follo wers is their total number on T witter . Fractional counts are from assigning a distrib ution to grandparents. T witter Handle Support < 12 12–13 14–15 16–17 18–24 25–34 35–44 45–54 55–64 ≥ 65 Follo wers Lord V oldemort7 273 5 35 75 55 87 13 0 1 1 1 2.0 × 10 6 W altDisneyW orld 435 61 100 89 80 65 20 4 7 4 4 2.5 × 10 6 Applebees 191 18 43 38 30 37 9 8 2.33 2.33 3.33 0.57 × 10 6 UniStudios 60 7 7 14 14 13 5 0 0 0 0 0.27 × 10 6 UniversalORL 65 5 13 10 15 14 4 0 1.66 1.66 0.66 0.40 × 10 6 HorrorNightsORL 5 0 0 0 1 3 1 0 0 0 0 0.04 × 10 6 HorrorNights 18 1 3 1 4 6 0 1 0.66 0.66 0.66 0.08 × 10 6 OlanRogers 16 0 2 0 7 7 0 0 0 0 0 0.11 × 10 6 T able 6: Posterior distrib utions (Equation (4)) for the eight features Follo wed by @williamockam. Probabilities are × 10 − 5 T witter Handle Support < 12 12–13 14–15 16–17 18–24 25–34 35–44 45–54 55–64 ≥ 65 Follo wers Lord V oldemort7 273 111.7 190.9 258.0 252.3 248.6 145.9 31.9 38.9 77.6 177.5 2.0 × 10 6 W altDisneyW orld 435 725.0 538.2 441.2 377.6 267.3 233.2 194.2 270.7 254.5 224.4 2.5 × 10 6 Applebees 191 231.8 206.3 176.6 150.3 129.8 137.4 226.7 132.4 139.6 139.2 0.57 × 10 6 UniStudios 60 80.6 56.0 59.3 59.5 49.3 48.1 11.3 2.8 2.3 2.3 0.27 × 10 6 UniversalORL 65 67.4 63.0 56.6 60.5 50.7 42.0 21.1 62.7 86.4 40.6 0.40 × 10 6 HorrorNightsORL 5 0.3 0.7 1.5 4.0 8.3 9.4 2.0 0.3 0.1 0.1 0.04 × 10 6 HorrorNights 18 14.0 13.7 11.3 15.5 16.1 9.4 29.1 29.9 36.8 29.3 0.08 × 10 6 OlanRogers 16 4.3 9.1 10.6 21.9 19.8 5.0 1.6 1.3 1.3 1.3 0.11 × 10 6 where n ia is the number of labelled T witter users in age category a who Follo w feature X i , which are given in T a- ble 5 for the @williamockam features and n a is the number of T witter users in category a in the ground-truth (See T a- ble 1). Performing this calculation yields the likelihoods for the @williamockam features shown in T able 6. W e are now able to compute the predicti v e distrib ution in (1) to infer the age of an arbitrary T witter user . The predictive distribution for @williamockam is shown in Figure 4 and is calculated by taking the product of the likelihoods from T able 6 with the prior (Equation (2)) and normalising. The generative process in our model for the likelihood term in (1) is as follows. 1. Draw an age category A ∼ Cat ( π ) 2. For each feature i draw µ ia ∼ Beta ( µ ia | b ia , c a ) 3. For each account draw the F ollo ws: X i ∼ Ber ( µ ia ) In T able 7, we report the fiv e features with the highest posterior age v alues of P ( A | X i = 1) for each age cate- gory . The account descriptions are taken from the first line of the relev ant Wikipedia page. The youngest T witter users are characterised by an interest in internet celebrities and computer games players. Music genres are important in dif- ferentiating all age groups from 12–45. 25–34 year olds are in part marked by entities that saw greater prominence in the past. This group is also distinguished by an interest in pornographic actors. Age categories 45–54 and 55–64 have the same top five and are differentiated by their interest in religious topics. Users older than 65 are identifiable through an interest in certain sports and politics. Experimental Evaluation W e demonstrate the viability of our model for age inference in huge social networks by applying it to 700m T witter ac- counts. W e conducted three experiments: (1) W e compare our approach with the language-based model by Nguyen (2013), which can be considered the state of the art for age inference. (2) W e compare our age inference results with the surve y by Duggan (2013). (3) W e assess the quality of our age inference on a 10% hold-out set of ground-truth labels and compare it with results obtained from inference based solely on the prior deri ved from census and survey data in Equation (2) for age prediction. Comparison with Dutch Language Model For comparison with the state-of-the-art work of Nguyen (2013) based on linguistic features (Dutch tweets) we con- sider the performance of our model as a three-class classifier using the following age bands: under 18, 18–44 and 45+. Fig. 9 lists the performance of our age inference algorithm on a 10% hold-out test set and the Dutch Language Model (DLM) proposed by Nguyen (2013). The corresponding per- formance statistics are shown in T able 9. Both methods perform equally well with a Micro F1 score of 0.86. The precision and recall show that the DLM ap- proach is efficient, e xtracting information from only a small training set (support). This is because significant engineer- ing work went into labelling and feature design. In contrast, our feature generation process is automatic and scalable. While we do not achieve the same performance for the lower age categories, for the oldest age category , our approach performs substantially better than the method by Nguyen (2013), suggesting that a hybrid method could perform well. W e lea ve this for future w ork. The major advantages of our model to the state-of-the-art approach are twofold: First, we have applied our age infer- ence to 700m T witter users, as opposed to being limited to a sample of Dutch T witter users with a relatively high num- T able 7: The most discriminative features based on the posterior distribution over age (Equation (7)). Descriptions are taken from the 1 st line of their W ikipedia pages. See the Appendix for a full table with probabilities and handles. < 12 12–13 14–15 16–17 18–24 25–34 35–44 45–64 5 65+ vlogger child presenter child singer singer metalcore band hip hop duo hip hop artist ev angelist political journalist minecraft gamer Y ouTuber child singer metalcore band rock band boy band rapper ev angelist retired cyclist internet personality child actress child singer deathcore singer rapper boy band history channel e vangelist golf channel vlogger child actress child singer electronic band computer game comedian record label faith group retired rugby player gaming commentator girl band child singer electronic band rock band adult actress box er faith magazine boxer T able 8: Statistics for age prediction on a held-out test set. < 12 12–13 14–15 16–17 18–24 25–34 35–44 45–54 55–64 ≥ 65 T est Cases 651 1,731 2,678 2,036 2,670 776 230 5,058 5,145 20,487 Ours Recall 0.19 0.20 0.38 0.23 0.33 0.25 0.18 0.32 0.41 0.30 Precision 0.22 0.33 0.36 0.24 0.31 0.15 0.07 0.14 0.19 0.79 Micro F1 0.31 S&C Recall 0.01 0.02 0.02 0.03 0.14 0.23 0.23 0.22 0.06 0.04 Precision 0.02 0.04 0.06 0.05 0.06 0.02 0.01 0.12 0.12 0.49 Micro F1 0.07 T able 9: Performance for three-class age model. Our Approach DLM (Nguyen, 2013) < 18 18–44 ≥ 45 ≤ 18 18–44 ≥ 45 Support 7,096 3,676 30,690 1,576 608 310 Precision 0.76 0.39 0.96 0.93 0.67 0.82 Recall 0.68 0.50 0.95 0.98 0.75 0.45 Micro F1 0.86 0.86 ber of T weets. Second, generating our training set is fully automatic and relies only on T witter data 6 , i.e., no manual labelling or verification is required. Fig. 2 sho ws the areas under the recei ver -operator charac- teristics (R OC) curves for our three-class model. The curves are generated by measuring the true positiv e and false posi- tiv e rates for each class ov er a range of classification thresh- olds. A perfect classifier has an area under the curve (A UC) equal to one, while a completely random classifier follo ws the dashed line with an AU C = 0 . 5 . Performance is excel- lent for classes under 18 and over 45, but weaker for 18–45 where training data was limited, which we note as an area for improv ement in future work. Comparison with Survey and Census Data W e report results on inferring the age of arbitrary T witter users with the ten category model. Fig. 3 shows aggregate classification results for 700m T witter accounts compared with expected counts based on survey data (S&C) Duggan (2013). Our model predicts that over 50% of T witter users are between 18 and 35, i.e., the bias of the original training set has been removed due to the Bayesian treatment. It is likely that S&C under-represents young people as we did not factor in the increased rates of technology uptake amongst the younger people when con v erting census data. 6 Nguyen (2013) used additional Linkedin data for labelling 0.0 0.2 0.4 0.6 0.8 1.0 False Positive Rate 0.0 0.2 0.4 0.6 0.8 1.0 True Positive Rate micro-average auc = 0.92 class 0 auc = 0.92 class 1 auc = 0.68 class 2 auc = 0.89 Figure 2: Receiver operator characteristics for three class age detection (0 = under 18, 1 = 18–45, 2 = 45+). The dashed line indicates random performance. Quality Assessment In the following, we assess the quality of our age inference model (10 categories) on a 10% hold-out test data set. T able 8 shows the performance statistics for this experi- ment. The majority of the test cases are in the younger age categories (due to the bias of young people rev ealing their age) and in older age categories (due to the inclusion of grandparents and retirees). T able 8 sho ws that the precision depends on the size of the data (e.g., predicting 25–44 year categories is hard) whereas the recall is fairly stable across all age categories. 7 Our model significantly outperforms an approach, which would only be based on the surve y and cen- 7 W ithout the inclusion of grandparents and retirees in the train- ing set, the predicti ve performance w ould rapidly drop of f for ages greater than 35. < 12 12-13 14-15 16-17 18-24 25-34 35-44 45-54 55-64 65+ 0.0 0.5 1.0 1.5 2.0 2.5 3.0 Counts 1e8 our model S&C Figure 3: Red bars show #accounts from the 700m unla- belled accounts that our model allocated to each age class using the mode of the predicti ve posterior . Blue bars show #accounts that would ha v e been allocated to each age class if ages were drawn from the Surv ey and Census (S&C) prior . <12 12-13 14-15 16-17 18-24 25-34 35-44 45-54 55-64 65+ 0.0 0.1 0.2 0.3 0.4 0.5 0.6 0.7 P(A|X) Figure 4: Posterior age distribution for @williamockam. sus data (S&C), which we use as a prior . This highlights the ability of our model to adapt to the data it actually sees. Conclusion W e proposed a probabilistic model for age inference in T wit- ter . The model exploits generic properties of T witter users, e.g., whom/what they follo w , which is indicati ve of their in- terests and, therefore, their age. Our model performs as well as the current state of the art for inferring the age of T wit- ter users without being limited to specific linguistic or engi- neered features. W e have successfully applied our model to infer the age of 700 million T witter users demonstrating the scalability of our approach. A ppendix Age Extraction Using REGEX Matching of Descriptions W e extracted user ages from the free text T witter descrip- tion using UNIX scripting REGEX matching tools. The ex- act REGEX strings are included in Listing 1. An initial run of the REGEX revealed some frequent false positiv es with terms lik e ’I feel like I am 80’ or ’I am more than 10’, which were manually corrected for in the final iteration. The Most Popular Accounts F ollowed by Labelled Users W e split the Followers into ten age categories. T able 10 shows that general trends across features are that the age distribution is peaked tow ards “younger” ages and that not many older people rev eal their age for the top features. The Follo wers column gi ves the total number of Followers of each feature across the T witter network. There is a Pearson correlation of 0.86 between the support and the total Fol- lower count for our data set. The Most Discriminative F eatures in Each Category For each feature we calculate the posterior probability of Follo wing that feature gi ven the user’ s age. W e sort the pos- teriors within each age category and present the accounts with the fiv e highest v alues in T able 11. References F . Al Zamal, W . Liu and D. Ruths Homophily and latent at- tribute inference: Inferring latent attributes of twitter users from neighbors. In ICWSM , 2012 C. M. Bishop. P attern Recognition and Machine Learning. Springer , 2006. J. D. Bur ger , J. Henderson, G. Kim and G. Zarrella. Dis- criminating gender on T witter . In EMNLP , 2011. J. Chang, I. Rosenn, L. Backstrom and C. Marlo w ePlurib us: ethnicity on social networks. In ICWSM , 2010. Z. Cheng, J. Ca v erlee and K. Lee. Y ou are where you tweet: a content-based approach to geo-locating T witter users. In CIKM , 2010. M. D. Conov er , B. Gonalves, J. Ratkiewicz, A. Flammini and F . Menczer . Predicting the political alignment of T witter users. In P ASSA T , 2011. A. Culotta, R. K. Nirmal and J. Cutler . Predicting the De- mographics of T witter Users from W ebsite Traf fic Data. In AAAI , 2015. M. Duggan and J. Brenner . The Demographics of Social Media Users—2012 . Retrie v ed Sep 12 2015 from http: //tinyurl.com/jk3v9tu Q. Fang, J. Sang, C. Xu, and M. S. Hossain. Relational user attribute inference in social media. In IEEE T r ansactions on Multimedia , 17(7), 1031-1044. 2015. Y . Fu, G. Guo and T . S. Huang. Age synthesis and estima- tion via faces: A surve y . In P attern Analysis and Machine Intelligence , IEEE Transactions on, 32(11), 1955-1976, 2010. T . Grainger and T . Potter . Solr in action. Manning Publica- tions Co. Chicago, 2014 G. Guo, Y . Fu, C. R. Dyer and T . S. Huang. Image-based human age estimation by manifold learning and locally adjusted robust regression. In Image Pr ocessing, IEEE T ransactions on , 17(7), 1178-1188, 2008. P . Gupta, A. Goel, J. Lin, A. Sharma, D. W ang and R. Zadeh. WTF: The Who to Follo w Service at T witter . In WWW , 2013. M. K osinski, D. Stillwell, and T . Graepel. Priv ate T raits and Attributes are Predictable from Digital Records of Human Behavior . In PNAS , 110(15):5802–5805, 2013. Listing 1: Regex matching run against T witter descriptions. The code detects age references in English, German, French and Portuguese. T erms including ’feel like’, ’ think I am’ and ’more / less than’ were a major source of error in early v ersions, which led us to write a REGEX that explicitly remo ves them. awk ’ { f o r ( i = 2 ; i < = NF ; i + = 2 ) { g s u b ( / , / , ” p 1 p 2 p 3 p 4 p ” , $ i ) } p r i n t $ 0 } ’ F S = ” \ ” ” OFS= ” \ ” ” $ x > t e m p awk ’ { p r i n t $ 2 , $ 3 , $ 6 } ’ FS = ” , ” OFS= ” , ” t e m p | s e d ’ s / p 1 p 2 p 3 p 4 p / \ , / g ’ | e g r e p − i ” [ \ ’ a ] [ m n ] [ ] [ 0 − 9 ] [ 0 − 9 ] [ \ , \ . \ ! \ ; y ] [ \ / y e a ] | [ u a ] i s [ ] [ 0 − 9 ] [ 0 − 9 ] [ \ , \ . \ ! \ ; a ] [ a n ] | b i n [ ] [ 0 − 9 ] [ 0 − 9 ] [ ] | [ h g ] o [ ] [ 0 − 9 ] [ 0 − 9 ] [ a ] [ a n ] [ o n ] ” > > t e m p 1 . c s v s e d ” s / . ∗ [ h g h i a \ ’ ] [ m n s o ] [ ] \ ( [ 0 − 9 ] [ 0 − 9 ] \ ) [ \ , \ . \ ! \ ; y a ] [ \ / y e a n ] . ∗ / \ 1 / I ; s / . ∗ b i n [ ] \ ( [ 0 − 9 ] [ 0 − 9 ] \ ) [ ] . ∗ / \ 1 / I ” t e m p 1 . c s v | e g r e p − v − i ” m o r e t h a n [ 0 − 9 ] [ 0 − 9 ] | ” t h i n k i am [ 0 − 9 ] [ 0 − 9 ] | t h i n k i ’ m [ 0 − 9 ] [ 0 − 9 ] | i f e e l l i k e [ 0 − 9 ] [ 0 − 9 ] | d e p u i s [ 0 − 9 ] [ 0 − 9 ] | [ a − l n − s u − z ] a n [ 0 − 9 ] [ 0 − 9 ] ” > t e m p 2 . c s v a w k ’ { g e t l i n e a < ” t e m p 2 . c s v ” ; p r i n t $ 0 ” , ” a } ’ t e m p 1 . c s v > t e m p 3 . c s v T able 10: The accounts with the highest support within the labelled data set. T witter Handle Support < 12 12–13 14–15 16–17 18–24 25–34 35–44 45–54 55–64 ≥ 65 Followers justinbieber 20,359 1517 5179 5737 4202 3073 412 99 67 34 38 8.7 × 10 7 katyperry 18,395 1467 4180 4410 3604 3575 701 158 124 75 102 9.2 × 10 7 taylorswift13 15,199 1207 3417 3674 3045 2919 507 113 117 79 122 8.1 × 10 7 selenagomez 14,264 1270 3578 3691 2847 2339 367 76 43 26 27 4.6 × 10 7 ArianaGrande 13,512 1254 3404 3604 2631 2172 319 50 40 19 20 4.1 × 10 7 ddlovato 13,259 1099 3284 3562 2741 2135 301 53 37 19 28 3.8 × 10 7 onedirection 12,834 979 3472 3778 2767 1622 138 43 20 7 8 3.0 × 10 7 Harry Styles 12,830 912 3468 3936 2751 1581 120 24 15 9 13 2.9 × 10 7 NiallOfficial 12,498 858 3431 3895 2702 1468 90 24 15 8 8 2.7 × 10 7 Y ouT ube 11,688 926 2496 2687 2193 2287 495 183 154 99 169 6.4 × 10 7 W . Liu and D. Ruths Whats in a name? using first names as features for gender inference in twitter . In AAAI Spring Symposium on Analyzing Micr otext , 2013. M. McPherson, L. Smith-Lovin, and J. M. Cook. Birds of a Feather: Homophily in Social Networks. In Annual Re- view of Sociology , 27(1):415–444, 2001. T . Meder . Why Gender and Age Prediction from T weets is Hard: Lessons from a Cro wdsourcing Experiment. In ICCL , 2011. A. Mislove, S. Lehmann, and Y . Y . Ahn. Understanding the Demographics of T witter Users. In ICWSM , 2011. E. Mohammady and A. Culotta Using county demographics to infer attrib utes of twitter users. In A CL Joint W orkshop on Social Dynamics and P ersonal Attributes in Social Me- dia , 2014. D. Nguyen, R. Gra vel, D. T rieschnigg, and T . Meder . “Ho w Old do Y ou Think I am?” A Study of Language and Age in T witter . In ICWSM , 2013. D. Nguyen, A. Noah, A. Smith, and Carolyn P . Rose. Au- thor age prediction from text using linear regression. In LaT eCH , 2011. H. Oktay , A. Firat, and Z. Ertem. Demographic Breakdown of T witter Users: An Analysis based on Names. In BIG- D A T A , 2014. M. Pennacchiotti and A. M. Popescu A machine learning approach to twitter user classification. In ICWSM , 2011. D. Rao, D. Y arowsky , A. Shreev ats, and M. Gupta. Classi- fying latent user attributes in T witter . In SMUC , 2010. J. Schler , M. K oppel, S. Ar gamon and J. W . Pennebaker Ef- fects of age and gender on blogging. In AAAI-CAA W , 2006. R. W ysocki and W . Zabiero wski. T wisted Framew ork on Game Server Example. In CADSM , 2011. U.S. Census Bureau, 2010 Census. Profile of General Pop- ulation and Housing Characteristics: 2010 Retrieved Sep 12, 2015 from http://factfinder.census. gov/faces/nav/jsf/pages/index.xhtml U.S Census Bureau, American Community Survey , 2014 Grandparent Statistics Retrieved Nov 15, 2015 from http://www.statisticbrain.com/ grandparent- statistics/ T able 11: In the model the features are popular T witter accounts. This table contains the posterior distributions p ( X = 1 | A = a ) ov er age for the fi ve most discriminati v e (useful) features in each age class. twitter handle description < 12 12–13 14–15 16–17 18–24 25–34 35–44 45–54 55–64 65+ Under 12-year olds RosannaPansino vlogger 0.40 0.22 0.15 0.09 0.07 0.02 0.01 0.01 0.01 0.02 AntV enom minecraft gamer 0.40 0.25 0.15 0.09 0.06 0.02 0.01 0.01 0.01 0.01 Bajan Canadian internet personality 0.37 0.25 0.17 0.10 0.06 0.02 0.00 0.01 0.01 0.01 shaycarl vlogger 0.36 0.20 0.14 0.10 0.07 0.04 0.02 0.02 0.02 0.02 InTheLittleW ood gaming commentator 0.34 0.23 0.16 0.11 0.08 0.02 0.01 0.01 0.01 0.02 12–13 year olds ivandorschner child TV presenter 0.18 0.27 0.20 0.11 0.09 0.03 0.03 0.02 0.03 0.04 V ikkstar123 youtuber 0.29 0.26 0.20 0.14 0.07 0.02 0.01 0.01 0.01 0.02 PeytonList child actress 0.29 0.25 0.20 0.14 0.07 0.02 0.01 0.01 0.01 0.01 G Hannelius child actress 0.31 0.25 0.18 0.13 0.07 0.02 0.02 0.01 0.01 0.01 Cimorelliband girlband 0.20 0.25 0.23 0.17 0.09 0.02 0.01 0.01 0.01 0.01 14–15 year olds therealsa vannah child pop singer 0.10 0.18 0.27 0.21 0.12 0.02 0.01 0.03 0.03 0.03 jessicajarrell child pop singer 0.12 0.21 0.26 0.24 0.10 0.02 0.01 0.01 0.01 0.01 TheDylanHolland child R&B singer 0.12 0.22 0.26 0.24 0.11 0.02 0.01 0.01 0.01 0.01 OfficialBirdy child singer 0.10 0.17 0.26 0.24 0.13 0.04 0.01 0.02 0.02 0.02 officialjman child singer 0.10 0.18 0.26 0.28 0.13 0.02 0.01 0.01 0.01 0.01 16–17 year olds T annerPatrick singer 0.05 0.13 0.25 0.30 0.18 0.03 0.01 0.01 0.01 0.01 TheW ordAlive metalcore band 0.04 0.11 0.19 0.29 0.22 0.09 0.02 0.01 0.01 0.01 MitchLuckerSS deathcore singer 0.05 0.14 0.23 0.29 0.20 0.04 0.01 0.01 0.01 0.02 metrostation electronic band 0.03 0.07 0.15 0.29 0.18 0.10 0.04 0.06 0.06 0.03 BreatheCar olina electronic band 0.06 0.15 0.22 0.29 0.19 0.06 0.01 0.01 0.01 0.01 18–24 year olds wecameasromans metalcore band 0.05 0.13 0.22 0.28 0.21 0.06 0.01 0.01 0.01 0.01 Sum41 rock band 0.07 0.11 0.18 0.24 0.21 0.09 0.02 0.02 0.03 0.03 hopsin rapper 0.04 0.09 0.13 0.19 0.20 0.09 0.09 0.06 0.05 0.07 Diablo computer game 0.03 0.06 0.09 0.13 0.20 0.17 0.09 0.05 0.06 0.12 paparoach rock band 0.04 0.09 0.14 0.19 0.20 0.12 0.07 0.06 0.06 0.04 25–34 year olds icp hip hop duo 0.02 0.04 0.05 0.09 0.19 0.37 0.09 0.04 0.05 0.05 kevinrichardson bo yband member 0.02 0.03 0.05 0.09 0.16 0.35 0.12 0.07 0.06 0.04 skulleeroz boyband member 0.02 0.04 0.06 0.09 0.16 0.33 0.12 0.07 0.06 0.05 LeeEvansNews comedien 0.02 0.03 0.06 0.07 0.17 0.32 0.09 0.08 0.09 0.09 miko lee adult actress 0.04 0.03 0.03 0.05 0.17 0.31 0.08 0.07 0.08 0.14 35–44 year olds djspooky hip hop artist 0.01 0.02 0.03 0.02 0.04 0.15 0.45 0.14 0.06 0.08 Mr Mike Jones rapper 0.01 0.01 0.01 0.01 0.03 0.14 0.44 0.16 0.09 0.10 HISTOR YTV18 history TV channel 0.02 0.03 0.03 0.05 0.09 0.14 0.36 0.10 0.06 0.13 T opDawgEnt record label 0.03 0.07 0.05 0.07 0.11 0.11 0.36 0.09 0.03 0.07 DannySwift box er 0.02 0.03 0.04 0.07 0.06 0.09 0.33 0.12 0.08 0.16 45–54 and 55–64-year olds (identical most-discriminant features) JohnBe ver e e v angelist 0.00 0.00 0.00 0.00 0.01 0.01 0.07 0.36 0.39 0.15 edstetzer ev angelist 0.00 0.00 0.00 0.00 0.00 0.01 0.07 0.36 0.39 0.16 ChristineCaine ev angelist 0.00 0.00 0.01 0.00 0.01 0.01 0.07 0.36 0.38 0.15 womenoffaith faith group 0.00 0.00 0.00 0.00 0.00 0.02 0.08 0.36 0.38 0.16 RELEV ANT faith magazine 0.00 0.01 0.00 0.01 0.01 0.01 0.07 0.35 0.38 0.17 People o ver 65 afneil political journalist 0.00 0.00 0.01 0.01 0.02 0.02 0.04 0.17 0.25 0.48 Chris Boardman retired c yclist 0.01 0.01 0.01 0.02 0.01 0.01 0.04 0.17 0.25 0.47 SkySportsGolf golf TV channel 0.01 0.02 0.02 0.02 0.03 0.01 0.04 0.16 0.22 0.46 IamA ustinHealey retired rugby player 0.04 0.02 0.01 0.01 0.01 0.01 0.04 0.17 0.25 0.45 anthonyfjoshua boxer 0.02 0.03 0.03 0.04 0.09 0.06 0.03 0.08 0.15 0.45
Original Paper
Loading high-quality paper...
Comments & Academic Discussion
Loading comments...
Leave a Comment