Detection and localization of change points in temporal networks with the aid of stochastic block models
A framework based on generalized hierarchical random graphs (GHRGs) for the detection of change points in the structure of temporal networks has recently been developed by Peel and Clauset [1]. We build on this methodology and extend it to also inclu…
Authors: Simon De Ridder, Benjamin V, ermarliere
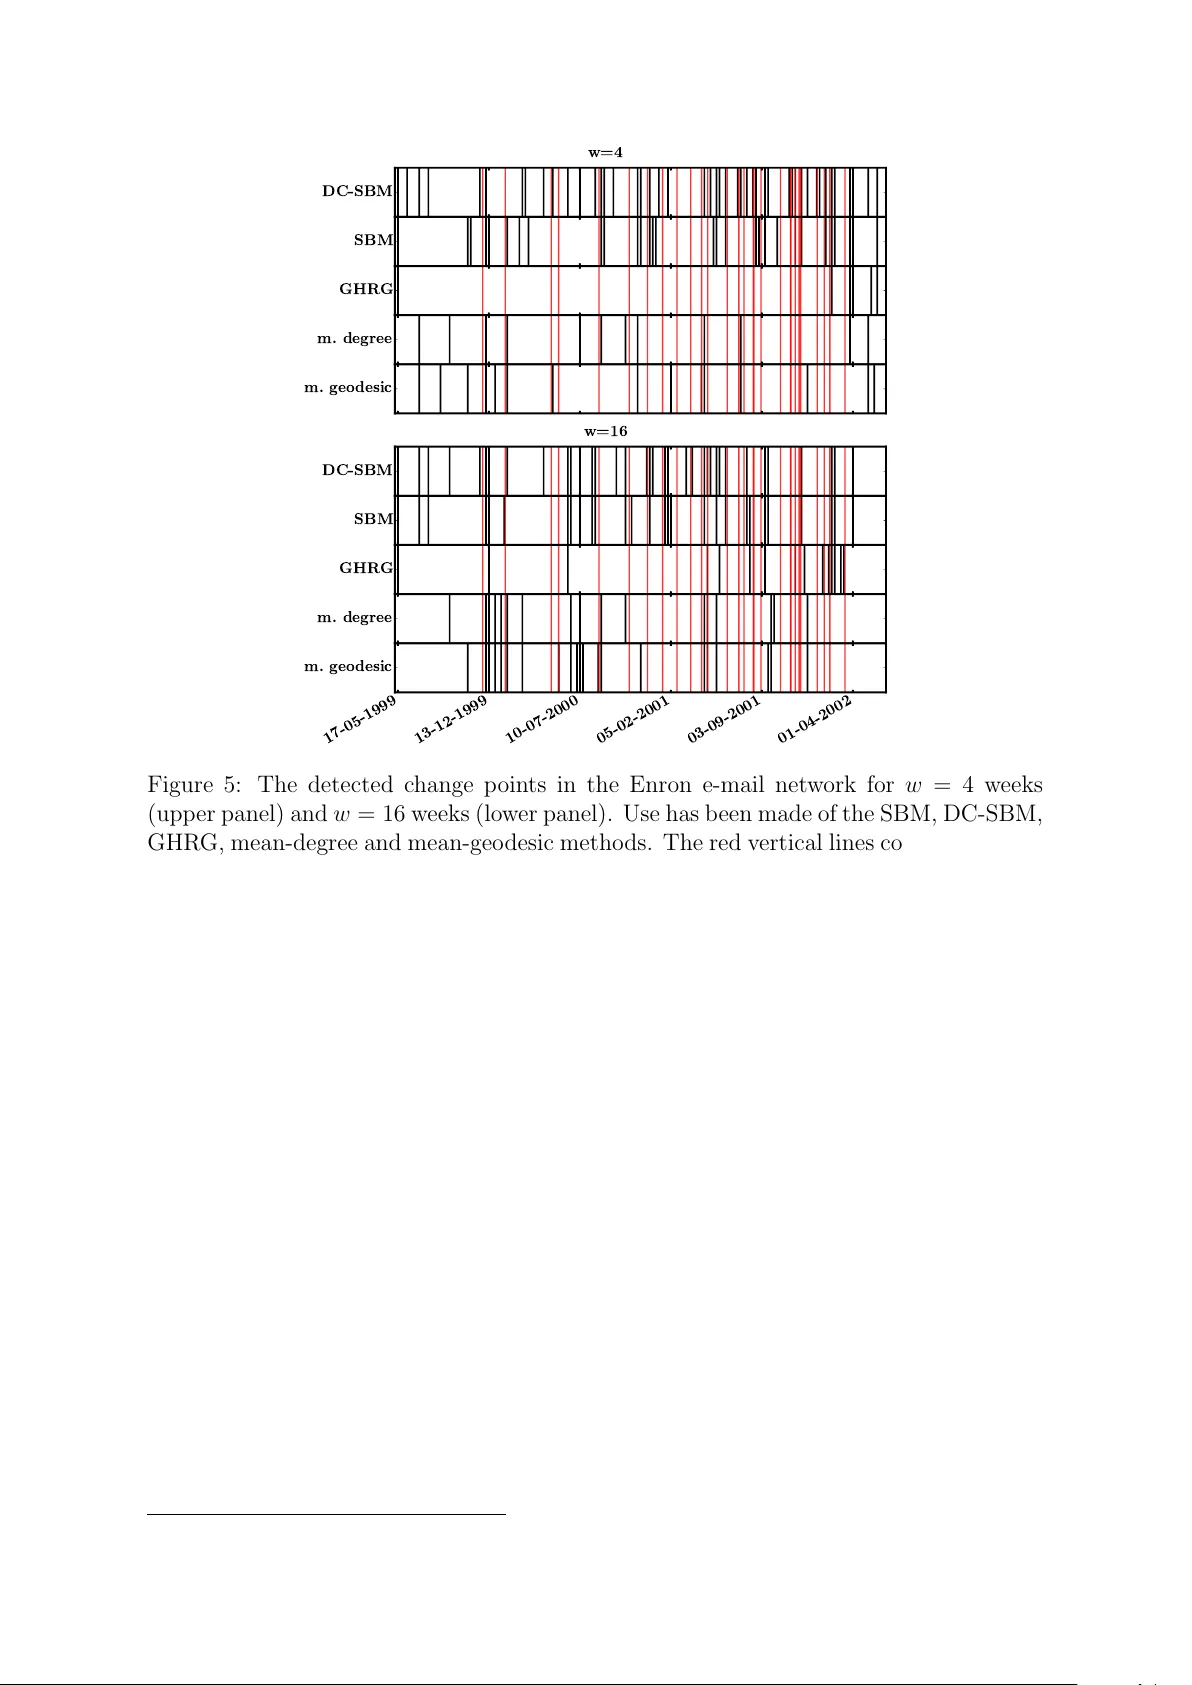
Detection and lo calization of c hange p oin ts in temp oral net w orks with the aid of sto c hastic blo c k mo dels Simon De Ridder ∗ 1 , Benjamin V andermarliere † 2,3 , and Jan Ryc kebusc h ‡ 2 1 Departmen t of Information T echnology , Ghen t Universit y 2 Departmen t of Physics and Astronom y , Ghent Univ ersit y 3 Departmen t of General Economics, Ghent Univ ersit y No vem b er 18, 2016 Abstract A framew ork based on generalized hierarchical random graphs (GHR Gs) for the detection of c hange p oin ts in the structure of temporal net works has recen tly b een dev elop ed b y Peel and Clauset [ 1 ]. W e build on this metho dology and extend it to also include the versatile stochastic blo c k mo dels (SBMs) as a parametric family for reconstructing the empirical net works. W e use five different techniques for c hange p oin t detection on prototypical temp oral netw orks, including empirical and synthetic ones. W e find that none of the considered metho ds can consistently outp erform the others when it comes to detecting and locating the expected c hange p oin ts in empirical temp oral net w orks. With resp ect to the precision and the recall of the results of the change p oints, we find that the metho d based on a degree-corrected SBM has b etter recall properties than other dedicated metho ds, esp ecially for sparse netw orks and smaller sliding time window widths. Keyw ords: Random graphs, net works, Net work dynamics, Statistical inference, Message- passing algorithms 1 In tro duction Net works are currently widely used to map and study interacting systems of animate and inanimate ob jects [ 2 , 3 , 4 ]. Often, the methodologies and measures developed within the con text of netw ork theories allo w one to identify the cen tral pla yers [ 5 , 6 , 7 ] and to find structures in the nodal interactions of the netw ork [ 8 ]. Thereb y one often identi- fies groups of nodes - comm unities - whic h interact more within a group than across ∗ simon.deridder@ugen t.b e † b enjamin.v andermarliere@ugen t.b e ‡ jan.ryc k ebusc h@ugen t.b e 1 groups [ 9 , 10 , 11 ]. Other frequently obtained top ologies of so cial netw orks include the core-p eriphery structure [ 12 , 13 ] with a small group of highly interconnected core no des and a large group of p eripheral no des that do mostly interact with core no des. As the dynamical origins of the interactions evolv e ov er time, the topology of the net w ork can change [ 14 , 15 ]. F or example, a so cial net work of high-sc ho ol studen ts c hanges b et w een “normal classes” mo de and “summer break” mo de, not to sp eak ab out what happ ens to the netw ork after graduation [ 16 ]. There are man y time evolving netw orks, ho wev er, for which the identification of the c hanges in the top ological structure of the net work is not that obvious. Recently , Peel and Clauset [ 1 ] prop osed a framew ork to lo cate the structural breaks in the large-scale structure of time-evolving netw orks. The prop osed change p oint detection metho dology of [ 1 ] dev elops in four steps: (1) Select the generalized hierarc hical random graph (GHR G) parametric family of probabilit y distributions appropriate for reconstruction of the empirical netw ork data. (2) Select an appropriate width w of a sliding time window. (3) F or eac h time window, use the prop osed parametric family of probability distri- butions to infer t wo versions for the mo del: one corresp onding with a c hange of parameters at a particular instance of time within the windo w, and an alternate one corresp onding with the n ull h yp othesis of no c hange p oin t ov er the en tire time windo w. (4) Conduct a statistical hypothesis test to determine whether the “c hange” or “no- c hange” mo de pro vides the b etter fit to the empirical net work data. In this pap er w e build on this metho dology , but introduce also sto chastic blo ck mo dels (SBM) as a parametric family for reconstructing the empirical netw ork in step (1) of the ab o ve-men tioned pro cedure. The SBMs hav e the adv antage of b eing v ery flexible. Indeed, they can capture for example b oth assortative and disassortativ e b ehaviour, and core-p eriphery netw orks [ 17 , 18 , 19 ]. An alternate metho d for change p oint detection with an adaptiv e time windo w based on Marko v c hain Mon te Carlo and SBMs has re- cen tly b een outlined in [ 16 ]. In what follows, w e first introduce the concept of SBMs to capture a giv en empirical net work. Next, we detail a new metho d to fit a mo del to a given empirical net work and to find the c hange p oints in a sliding time window of size w . In section 4 w e apply our prop osed metho dology to a n umber of prototypical temp oral netw orks. W e in tro duce sev eral strategies to detect change p oints and compare the quality of their results. First, w e conduct a study with syn thetic temp oral netw orks. Next, we apply the c hange- p oin t detection metho ds to three empirical temp oral so cial netw orks: the Enron e-mail net work, the MIT pro ximity net work, and the in ternational trade netw ork after 1870. F or these three netw orks the empirical c hange p oin ts are do cumen ted and we compare those with the numerical predictions. 2 2 Fitting sto c hastic blo c k mo dels to a net w ork In its simplest form, an SBM distributes the N no des of a net work into K groups. With n r w e denote the prior probability that a no de is cl assified in group r . Obviously , one has that P r n r = 1. Let Q rs b e the probabilit y that a link exists betw een a node u in block r and a node v in blo c k s . The parameters Q rs form a K × K matrix (1 ≤ K ≤ N ). W e call g u = r ( g v = s ) the blo c k assigned to no de u ( v ). With these conv entions, the probability of ha ving a link b et ween no des u and v is Bernoulli distributed with parameter Q g u g v . One can determine the lik eliho o d of a giv en netw ork (as fully determined by its adjacency matrix A ) with a given no de partitioning { g u } given the SBM mo del parameters { n r } and {Q rs } . This can b e expressed either in terms of a pro duct o ver all nodes, or in terms of a pro duct ov er all blo cks. P ( A, { g u }|{ n r } , {Q rs } ) = Y u n g u Y u 0 } . This reduces the n um b er of “messages” to b e up dated to N + M , with M the total num b er of links in the net work. Without the appro ximation ( 7 ), N 2 probabilities ψ u → v r need to up dated and stored. The “messages” of ( 3 ) and ( 5 ) allo w one to put forward estimates of the SBM parameters n r = N r N = P u ψ u r N , (8) Q rs = m rs N rs = 1 N 2 ( P u 0 ψ u 0 r )( P v 0 ψ v 0 s ) P u 6 = v A uv P ( A uv |Q rs ) ψ u → v r ψ v → u s Z uv ( r 6 = s ) 1 N 2 ( P u 0 ψ u 0 r )(( P v 0 ψ v 0 s ) − 1 / N ) P u 6 = v A uv P ( A uv |Q rs ) ψ u → v r ψ v → u s Z uv ( r = s ) . (9) Using ( 3 ) one can update the “messages” { ψ u → v r } giv en the curren t estimates of the SBM parameters { n r } and {Q rs } . The expressions ( 8 ) and ( 9 ), on the other hand, provide a w ay to estimate the SBM parameters, giv en the “messages”. Fitting the SBM to an empirical netw ork can then be done as follows: (1) Initialise { ψ u → v r } for eac h no de u , and the parameters { n r } and {Q rs } randomly . (2) Up date the SBM parameters using ( 8 ) and ( 9 ). 4 (3) Iterativ ely up date the “messages” { ψ u → v r } and { ψ u r } , using ( 3 ) and ( 5 ) resp ectiv ely , un til they conv erge. (4) Rep eat steps (2) and (3) un til b oth the parameters ( { n r } , {Q rs } ) and the “mes- sages” ( { ψ u → v r } , { ψ u r } ) hav e conv erged. This is a v arian t of the Exp ectation-Maximisation algorithm that finds the optimal pa- rameter v alues using p oint estimates for a given initialisation. Because this approach can cause con vergence to a lo cal minim um, it is safer to execute this algorithm m ulti- ple times with differen t random initialisations, and accept the solution with the highest lik eliho o d. By using ( 8 ) and ( 9 ) we obtain estimates of the netw ork’s parameters of whic h w e deem that they offer some adv an tages ov er an approach that assigns the no des to blo cks de- terministically . This is b ecause a no de u that has a high probabilit y to reside in blo c k r ( ψ u r ' 1), retains a small probability of residing in blo ck s 6 = r ( ψ u s > 0). Accordingly , it con tributes to the estimate of Q ss through ( 9 ). This a voids the follo wing problem that o ccurs with the deterministic assignment of the no des to blo cks. Supp ose that a blo c k s has a deterministically assigned set of no des. In situations whereb y those no des ha ve no links in the underlying netw ork, Q ss is estimated as zero. By the same token, using ( 1 ) or ( 2 ) the lik eliho o d of a netw ork with one link in blo ck s is also zero. In the approach adopted in this work, the estimate of Q ss differs from zero which implies that the lik eliho o d of a link within blo c k s differs from zero. Indeed, this is guaranteed through the use of ( 8 ) and ( 9 ), and the fact that ψ u s > 0 for all or nearly all no des u . An alternate w a y of circum ven ting the sk etched problem is to introduce Bay esian priors for the ψ u s , as w as done in [ 1 ]. W e now discuss the metho d used to determine the n umber of blo cks K . T o this end, we rep eat the ab ov e fitting pro cedure for v arious c hoices of K , and select the one with the minim um description length (DL). W e use the definition of the DL prop osed in [ 22 ]. It consists of the sum of an en tropy term S accounting for the amoun t of information in the net work that is describ ed by the mo del, and of a mo del information term L that quantifies the information needed to describ e the mo del. After a deterministic assignment of the no des to blo cks using g u = arg max r ψ u r , the DL Σ can b e written as: Σ = X r ln N r 2 m rr ! ! + X r g | |{ g 0 }| . (13) The p -v alue determines the significance of the log-lik eliho o d ratio, and the change p oin t is only accepted if the condition p < α is met. 4 Results In this section w e present the results of our numerical studies of c hange-p oint detection. W e use b oth syn thetic (section 4.1 ) and empirical (section 4.2 ) temp oral net works. F or all those temp oral net w orks we use in total fiv e metho dologies to detect and lo cate the c hange p oin ts. First, the degree-corrected and the regular SBM techniques introduced in this work (DC-SBM, SBM) and the GHR G metho d in tro duced in [ 1 ]. W e confron t the results of those three inv olving metho dologies with those of tw o rather straightfor- w ard lo cal metho ds based on the mean degree and mean geo desic of the netw ork. F or these lo cal metho ds, w e calculate the sp ecified scalars for eac h net w ork in a given time 7 windo w and for the netw ork at the time instance just after the considered time window. The v alue for this last netw ork is then compared to the mean v alue for the net works in the windo w, b y means of a t w o-tailed Studen t’s t -test. Thereby we adopt the same significance level α as used for the other metho ds (1 − α = 95 %). 4.1 Analysis with syn thetic temp oral net works 2 4 6 8 10 12 14 16 18 20 22 24 26 28 30 Time 0.00 0.20 0.40 0.60 0.80 1.00 Detected fraction w = 1 6 , E R → 2 C SBM DC-SBM GHRG m.degree m.geodesic 2 4 6 8 10 12 14 16 18 20 22 24 26 28 30 Time 0.00 0.20 0.40 0.60 0.80 1.00 Detected fraction w = 1 6 , 2 C → C P Figure 2: The efficiency of detecting a c hange point in t wo synthetic temp oral net w orks with the SBM, DC-SBM, GHR G, mean-degree, and mean-geo desic metho ds. The true lo cation of the change p oint is t = 16. Upp er panel: t = 16 marks the change from an Erd˝ os-R ´ en yi (ER) net work to a net work with tw o communities (2C). Low er panel: t = 16 marks the change from a netw ork with tw o communities to a net w ork with a core-p eriphery (CP) structure. At all time instances, the heigh t of the bar indicates the fraction of the 50 simulations that detect a c hange p oin t. A sliding time windo w of size w = 16 w as used. In this subsection we compare the p erformance of the prop osed techniques at the retriev al of planted change p oints in syn thetic temp oral net w orks. W e apply the metho dology out- lined in Sections 2 and 3 to the synthetic transition from an Erd˝ os-R´ enyi (ER) net work in to a netw ork with tw o comm unities (2C), and from a net work with t w o communities in to a netw ork with a core-p eriphery (CP) structure. W e rep ort results of four rounds of studies each cov ering 50 sim ulations of 32 time instances. Thereb y , the c hange p oint is planted at t = 16. The temp oral syn thetic net works of the “ER”, “2C” and “CP” t yp e are generated from their defining SBMs, with a fixed n umber of no des in each blo ck. More sp ecifically , the results rep orted are 8 generated from: ER → 2C: 0 . 1 0 . 1 0 . 1 0 . 1 → 0 . 15 0 . 05 0 . 05 0 . 15 , N = 22 28 , (14) 2C → CP: 0 . 2 0 . 01 0 . 01 0 . 2 → 0 . 3 0 . 09 0 . 09 0 . 01 , N = 20 30 , (15) CP → 2C: 0 . 3 0 . 09 0 . 09 0 . 01 → 0 . 2 0 . 01 0 . 01 0 . 2 , N = 20 30 . (16) F or each simulation of a given set-up, 16 net works are indep enden tly generated from the first SBM, follow ed b y 16 indep enden t netw orks from the second SBM. This creates a time series of netw orks with larger v ariations than those t ypically found in the empirical temp oral netw orks that will constitute the study of Sec. 4.2 . W e stress that the GHRG mo del would b e an equally go o d choice to generate the syn thetic temp oral netw orks. Figure 2 summarizes the results of the detection efficiencies for the “ER → 2C” and “2C → CP” transitions, using a sliding window of size w = 16, and a significance level of 1 − α = 95 %. W e observ e that the regular SBM metho d (and for the formation of tw o comm unities also the DC-SBM metho d) has a v ery high detection rate at the change p oin t. The GHR G and the lo cal metho ds hav e a significantly low er detection rate. 2 4 6 8 10 12 14 16 18 20 22 24 26 28 30 Time 0.00 0.20 0.40 0.60 0.80 1.00 Detected fraction w = 4 , E R → 2 C SBM DC-SBM GHRG m.degree m.geodesic 2 4 6 8 10 12 14 16 18 20 22 24 26 28 30 Time 0.00 0.20 0.40 0.60 0.80 1.00 Detected fraction w = 1 6 , C P → 2 C Figure 3: As in Fig. 2 but for a differen t v alue of w (upper panel) and for the time rev ersed pro cess (bottom panel). Figure 3 sho ws the change-point detection efficiencies for t w o transitions related to those of Fig. 2 . The first is the ER → 2C transition with a window size w = 4. Comparison to the upp er panel in Fig. 2 illustrates that a shorter window size causes the SBM metho d to predict more false predictions for lo cal change p oints. W e stress that those can b e partially attributed to the adopted algorithm that generates the netw orks inde- p enden tly . Figure 3 also shows the detection efficiency results for the CP → 2C transition with w = 16. This is the time reversed pro cess of the one shown in the low er panel 9 of Fig. 2 . The DC-SBM metho d sho ws a noticeable increase in detections of a c hange p oin t. This is in line with the exp ectations, as the DC-SBM is more adept at discov ering comm unity structure than the regular SBM. This indicates that the DC-SBM metho d is b etter at disco v ering the formation of a communit y structure than it is at discov ering its dissolution. In the studies summarized in Figs. 2 and 3 the GHR G method seems to under-p erform. The underlying reasons can b e understo o d by insp ecting Fig. 4 showing for one sp ecific studied transition the mean of one minus the p-v alue of the likelihoo d ratio statistic, whic h can b e interpreted as the probability of o ccurrence of a change p oin t. W e see that the GHRG, lik e the other metho ds, pro duces a p eak in this probability , centred around the real change p oin t. The mean, ho wev er, do esn’t rise ab o ve the 95 % that was put forw ard as the detection threshold. This indicates that at low er v alues of this threshold, the GHRG metho d would b e equally efficient at predicting the t = 16 p eak. W e stress that similar observ ations are made for all the transitions considered. 2 4 6 8 10 12 14 16 18 20 22 24 26 28 30 Time 0.00 0.20 0.40 0.60 0.80 1.00 Mean of (1 - p-value) w = 1 6 , C P → 2 C SBM DC-SBM GHRG m.degree m.geodesic Figure 4: The estimated probability of detecting a change p oint in a syn thetic temp oral net work with the SBM, DC-SBM, GHRG, mean-degree, and mean-geo desic metho ds. The true lo cation of the c hange p oint is t = 16. It marks the c hange from a netw ork with a core-p eriphery (CP) structure to a net w ork with tw o communities. At all time instances, the height of the bar indicates one min us the p-v alue of the likelihoo d ratio statistic, av eraged ov er all time windows containing the candidate change p oint for the SBM, DC-SBM and GHR G metho ds, and ov er the 50 simulations. A sliding time windo w of size w = 16 was used. 4.2 Analysis with empirical temp oral net w orks W e no w apply the metho dology outlined in the Sections 2 and 3 to three empirical temp oral net works: the Enron e-mail netw ork, the MIT pro ximity netw ork and the in ternational trade net work. The first tw o datasets w ere also used in the change p oint analysis of [ 1 ]. First, w e briefly describe the three datasets that underlie the temp oral net works used in our analysis. Enron is a U.S. energy compan y that filed for bankruptcy back in 2001 due to account- ing scandals. As a result of an official inquiry , a dataset of e-mails exchanged b etw een mem b ers of the Enron staff w as made public 1 . With those data, one can construct a 1 Av ailable at www.cs.cmu.edu/ ~ enron . 10 DC-SBM SBM GHRG m. degree 17-05-1999 13-12-1999 10-07-2000 05-02-2001 03-09-2001 01-04-2002 m. geodesic w=4 DC-SBM SBM GHRG m. degree 17-05-1999 13-12-1999 10-07-2000 05-02-2001 03-09-2001 01-04-2002 m. geodesic w=16 Figure 5: The detected c hange points in the Enron e-mail net w ork for w = 4 w eeks (upp er panel) and w = 16 weeks (lo wer panel). Use has b een made of the SBM, DC-SBM, GHR G, mean-degree and mean-geodesic methods. The red v ertical lines corresp ond with the time instances of do cumen ted even ts in the Enron company . temp oral netw ork with Enron’s staff members as no des, and links which reflect the e-mail exc hanges in a particular w orking w eek. In this wa y , one creates a sparse netw ork with an av erage of 0.43 links p er no de. The MIT realit y mining pro ject is an exp eriment conducted by the Media Lab oratory at the Massach usetts Institute of T echnology (MIT) during the 2004-2005 academic year [ 23 ]. In this experiment, ninety-four sub jects, both MIT students and staff, w ere moni- tored by means of their smartphone. Thereb y , the Blueto oth data give a measure of the pro ximity b etw een tw o sub jects 2 . This proximit y can b e in terpreted as a link b et ween t wo sub jects. As the time of proximit y is also recorded, one can pro duce a weekly em- pirical temp oral netw ork by grouping the links p er week. In this wa y , a dense netw ork with an a verage of 9 . 07 links p er no de is obtained. The study of international trade before the 1950s is hamp ered b y the limitations imposed b y the scarcity of data. Thanks to a technique dev elop ed in [ 24 ], a reliable co verage of the data on in ternational trade b etw een 1880 and 2011 could b e accomplished. Note that during the w orld wars data collection on trade w as almost halted. Hence, we exclude these p erio ds from the sample. W e construct a temp oral international trade net work with countries as no des and establishing links whenever the coun tries ha ve a significant lev el of trade integration in a sp ecific y ear. W e treat the international trade data as undirected in order to mak e a c hange p oin t analysis with the GHRG metho d p ossible. 2 Av ailable at http://realitycommons.media.mit.edu/realitymining.html . 11 0 0.2 0.4 0.6 0.8 1 Precision (fraction) w = 4 0 0.2 0.4 0.6 0.8 0 1 2 3 4 Recall (fraction) Delay s (weeks) w = 16 DC-SBM SBM GHRG m.degree m.geodesic 0 1 2 3 4 5 Delay s (weeks) Figure 6: The computed precision (top) and recall (b ottom) for the Enron e-mail net- w ork. Results are shown for windo w sizes of 4 (left) and 16 w eeks (right) and for five c hange p oint detection metho ds. F or the Enron e-mail and MIT proximit y netw orks w e consider all nodes (including those with no links) in the time windo ws. F or the international trade netw ork, ho w- ev er, w e retain the no des with at least one link throughout the windo w. In this wa y a more dense net work is obtained, creating impro v ed conditions for change p oin t detection. F or eac h of the three considered temporal net works, there are a n umber of kno wn dates corresp onding with ev ents that are likely to ha ve impacted the netw ork’s structure. W e treat those dates as if they w ere the “empirical” c hange points, realizing that they merely mark dates with an enhanced likelihoo d for changes in the net w ork to o ccur. The ma jor purp ose of the introduction of “empirical” c hange points is to dev elop a quan titative measure to compare the figure of merit of the differen t change p oint detection metho d- ologies. In order to quan tify the qualit y of the v arious c hange p oin t detection tec hniques, w e use the “precision” and “recall” in function of a dela y s as it was in tro duced in [ 1 ] Precision( s ) = 1 N f ound X i δ min j t f ound i − t know n j ≤ s (17) Recall( s ) = 1 N know n X j δ min i t f ound i − t know n j ≤ s , (18) where N f ound ( N know n ) is the total n um b er of detected (“empirical”) change p oints. The precision is the fraction of detected c hange p oin ts t f ound i that hav e an “empirical” even t t know n i within a time range of s . The recall is the fraction of “empirical” even ts that hav e a detected c hange p oint within a time range of s . 12 DC-SBM SBM GHRG m. degree 30-08-2004 18-10-2004 06-12-2004 24-01-2005 14-03-2005 02-05-2005 m. geodesic w=4 DC-SBM SBM GHRG m. degree 30-08-2004 18-10-2004 06-12-2004 24-01-2005 14-03-2005 02-05-2005 m. geodesic w=16 Figure 7: As in Figure 5 but for the MIT pro ximity netw ork. Figures 5 , 7 and 9 sho w the “empirical” and the detected change points for the Enron, MIT and trade netw orks for tw o different time windo w widths. The corresponding results for the precision and recall are contained in Figures 6 , 8 and 10 . In order to get a b etter feeling of the effect of the width of the sliding time window in the change p oin t searches, for eac h temp oral netw ork we hav e b een running the algorithms for a “small” width of 4 ( w = 4) and a “larger” width of 16 ( w = 16). When it comes to detecting the “empirical” change p oints, w e find that the DC-SBM metho d is at least equally efficien t as the SBM. F urthermore, w e observe a strong sen- sitivit y of the detected c hange p oin ts to the v alue of w . F or example, whereas the SBM and DC-SBM predict more change p oin ts than the GHRG for the Enron( w = 4), Enron( w = 16) and MIT( w = 4) combinations, just the opp osite is observed for the other three com binations. This illustrates the sensitivit y of the algorithms to the choice made with regard to the v alue of w . One also faces some situations where the algorithms fail to detect the “empirical” c hange p oin ts. In other situations the algorithms predict a high densit y of c hange p oints, whereas there are no direct empirical indications that p oin t into that direction. F or example, for the in ternational trade net work, the combination DC-SBM with w = 4 leads to man y detected c hange p oin ts. One could argue, how ev er, that 4 years is to o small a window for dramatic c hanges in the international trade netw ork to occur. F or the MIT pro ximit y net work, on the other hand, all metho ds are p erforming badly for the w = 16 option. Here, one could argue that a time window of 4 weeks is a more natural c hoice to detect c hanges in the pro ximit y net w ork. 13 0 0.2 0.4 0.6 0.8 1 Precision (fraction) w = 4 0 0.2 0.4 0.6 0.8 0 1 2 3 4 Recall (fraction) Delay s (weeks) w = 16 DC-SBM SBM GHRG m.degree m.geodesic 0 1 2 3 4 5 Delay s (weeks) Figure 8: As in Figure 6 but for the MIT pro ximity netw ork. The precision of the v arious metho ds for the Enron e-mail netw ork (Figure 6 ) is roughly the same. The GHRG metho d outp erforms the other metho ds at larger window sizes. The SBM metho ds, in particular the DC-SBM v ersion, p erform better for the recall. The simple mean-degree and mean-geo desic metho ds ha ve a decen t precision but lag b ehind for the recall. F or the precision and recall for the MIT pro ximit y netw ork (Figure 8 ), the GHRG metho d ([ 1 ]) displays a slightly b etter precision, but the SBM metho ds are sligh tly b etter at recall. Again, the simple mean-degree and mean-geodesic metho ds p er- form w ell for the precision but are w orse for the recall. F or the computed precision of the in ternational trade net work (Figure 10 ) all metho ds p erform comparably . F or the recall at w = 4, how ev er, only the DC-SBM metho d p erforms b etter than the lo cal metho ds. F or a larger window size, b oth the SBM metho ds and the GHR G metho d p erform v ery w ell. When comparing our results for the Enron e-mail and the MIT proximit y netw orks with those of [ 1 ], w e note some differences, esp ecially for the Enron net w ork. W e see three p ossible explanations, which ma y together constitute a plausible explanation. Firstly , the original datasets w ere prepro cessed in order to turn them in to temp oral netw orks. F or the Enron data, a p erson uses several e-mail aliases, inducing uncertainties in the prepro cessing of the data. Secondly , the choice of the time window width is not sp ecified in [ 1 ] and, as shown abov e, the results for the change p oin t candidates dep end on that c hoice. Thirdly , the detected change p oin ts are sensitiv e to whether only activ e no des or all no des are included in the sliding time windo w. 14 DC-SBM SBM GHRG m. degree 1880 1900 1920 1940 1960 1980 2000 m. geodesic w=4 DC-SBM SBM GHRG m. degree 1880 1900 1920 1940 1960 1980 2000 m. geodesic w=16 Figure 9: As in Figure 5 but for the international trade netw ork. The widths of the sliding time windo ws are expressed in y ears. 5 Conclusion The pioneering work of [ 1 ] developed a framework to detect change p oints in temp oral net works based on GHR Gs. In this pap er w e extend their metho dology by adapting it to the use of SBMs as a parametric family of probabilit y distributions for the reconstruction of empirical netw orks. W e hav e made a comparative study of the detected change p oin ts on three prototypical empirical temp oral net works using the GHR G and SBM based metho dologies. W e hav e done this for different sizes of the sliding time window and ha ve also included t wo more simple change p oin t detection metho ds in the comparison. W e find that the GHRG metho d and SBM metho ds are comparably effective in identi- fying the c hange p oints. In some sense, the SBM is more versatile in that it can also deal with directed net works for example. No systematic conclusions could b e dra wn for the density of the detected c hange p oints. Whereas the SBM mo dels detect more c hange p oin ts than the GHRG for the com binations Enron( w = 4), Enron( w = 16), MIT( w = 4), just the opp osite is found for the other three combinations analysed in this w ork. This also indicates that the choice of the size of the sliding time window affects the detected change p oints. When comparing the SBM and DC-SBM metho dologies, the DC-SBM version has the tendency to identify a larger amount of c hange p oin ts. W e also find some situations in which the metho dologies (ev en dramatically) ov er- or under-predict the amount of “empirical” change p oin ts. Note that the SBM and GHR G 15 0 0.2 0.4 0.6 0.8 1 Precision (fraction) w = 4 0 0.2 0.4 0.6 0.8 0 1 2 3 4 Recall (fraction) Delay s (years) w = 16 DC-SBM SBM GHRG m.degree m.geodesic 0 1 2 3 4 5 Delay s (years) Figure 10: As in Figure 6 but for the international trade net w ork. The widths of the sliding time windo ws are expressed in y ears. are v ery similar mo dels, as for an appropriate v alue of the n umber of blo cks K an SBM equiv alent to an y GHRG can be constructed. The main difference b etw een the t wo mod- els b eing that the GHRG automatically determines the num b er of blo c ks at the cost of only b eing able to recursiv ely partition along the blo ck diagonal of the adjacency matrix. The SBM on the other hand can freely parametrise the full blo c k structure but requires the num b er of blo c ks K to b e sp ecified. Giv en the similarity b etw een SBM and GHR G it seems reasonable that they would p erform similarly o v erall, but p erform differently for differen t types of changes. In future w ork, it ma y b e worth partitioning the problem space in more detail so that one can identify for which t yp es of net work changes the v arious metho ds p erform b est. With respect to the precision and the recall, we conclude that the SBM metho d produces a b etter recall than the GHRG metho d, esp ecially for sparse net works in com bination with a “small” windo w size. The precision is only significantly outp erformed b y the GHR G metho d for one of the three studied net w orks. In general, the simple mean-degree and mean-geodesic methods do reasonably w ell for th e precision but are outp erformed b y the sophisticated GHR G and SBM metho ds for the recall. This leads us to conclude that SBMs, and esp ecially the degree-corrected SBM, are a go o d versatile to ol for inference and analysis of complex net w orks. The inference of change p oints in temp oral netw orks, ho wev er, is sub ject to some uncertainties which are connected with the adopted metho d and the widths of the considered sliding time windo ws. Metho dologies based on para- metric families for reconstructing the empirical net works, how ever, outp erform the more simple metho dologies. An implementation of the prop osed algorithm is a v ailable at https://github.ugent. be/pages/sidridde/sbm_cpd . The indep endence b etw een the runs in the different time 16 windo ws makes parallelisation easily attainable. In eac h time windo w, the sparse v ersion of the b elief propagation algorithm leads to a computational complexity of O (( M N + N 2 ) K 2 ), and a memory complexit y of the order O ( M ). References [1] P eel L and Clauset A 2015 Detecting change p oin ts in the large-scale structure of evolving net works Pr o c e e dings of the Twenty-Ninth AAAI Confer enc e on A r- tificial Intel ligenc e URL https://www.aaai.org/ocs/index.php/AAAI/AAAI15/ paper/view/9485 [2] Newman M E J 2003 SIAM r eview 45 167–256 URL http://dx.doi.org/10.1137/ S003614450342480 [3] Newman M E J, Barabasi A L and W atts D J 2006 The structur e and dynamics of networks (Princeton Univ ersit y Press) [4] Newman M E J 2010 Networks: an intr o duction (Oxford Univ ersity Press) [5] Bonacic h P 1987 AJS 92 1170–1182 URL http://www.jstor.org/stable/ 2780000 [6] Borgatti S P 2005 So c. Netw. 27 55–71 URL http://dx.doi.org/10.1016/j. socnet.2004.11.008 [7] Borgatti S P and Ev erett M G 2006 So c. Netw. 28 466–484 URL http://dx.doi. org/10.1016/j.socnet.2005.11.005 [8] Moriano P and Fink e J 2013 J. Stat. Me ch. 2013 P06010 URL http://stacks. iop.org/1742- 5468/2013/i=06/a=P06010 [9] F ortunato S 2010 Phys. R ep. 486 75–174 URL http://dx.doi.org/10.1016/j. physrep.2009.11.002 [10] Blondel V D, Guillaume J L, Lam biotte R and Lefeb vre E 2008 J. Stat. Me ch. 2008 P10008 URL http://stacks.iop.org/1742- 5468/2008/i=10/a=P10008 [11] Chen Y, W ang X, Y uan B and T ang B 2014 J. Stat. Me ch. 2014 P03021 URL http://stacks.iop.org/1742- 5468/2014/i=3/a=P03021 [12] Holme P 2005 Phys. R ev. E 72 046111 URL http://link.aps.org/doi/10.1103/ PhysRevE.72.046111 [13] Rom bach M P , Porter M A, F owler J H and Muc ha P J 2014 SIAM J. Appl. Math. 74 167–190 URL http://dx.doi.org/10.1137/120881683 [14] Holme P and Saram¨ aki J 2012 Phys. r ep. 519 97–125 URL http://www. sciencedirect.com/science/article/pii/S0370157312000841 [15] Holme P 2015 Eur. Phys. J. B 88 234 URL http://dx.doi.org/10.1140/epjb/ e2015- 60657- 4 17 [16] P eixoto T P 2015 Phys. R ev. E 92 (4) 042807 URL http://link.aps.org/doi/ 10.1103/PhysRevE.92.042807 [17] Holland P W, Lask ey K B and Leinhardt S 1983 So c. Netw. 5 (2) 109–137 URL http://dx.doi.org/10.1016/0378- 8733(83)90021- 7 [18] P eixoto T P 2013 Phys. R ev. L ett. 110 148701 URL http://link.aps.org/doi/ 10.1103/PhysRevLett.110.148701 [19] Karrer B and Newman M E J 2011 Phys. R ev. E 83 (1) 016107 URL http://link. aps.org/doi/10.1103/PhysRevE.83.016107 [20] Decelle A, Krzak ala F, Mo ore C and Zdeb oro v´ a L 2011 Phys. R ev. E 84 (6) 066106 URL http://link.aps.org/doi/10.1103/PhysRevE.84.066106 [21] Y an X, Shalizi C, Jensen J E, Krzak ala F, Mo ore C, Zdeb oro v´ a L, Zhang P and Zhu Y 2014 J. Stat. Me ch. 2014 P05007 URL http://stacks.iop.org/1742- 5468/ 2014/i=5/a=P05007 [22] P eixoto T P 2014 Phys. R ev. X 4 (1) 011047 ( Pr eprint 1310.4377 ) URL http: //link.aps.org/doi/10.1103/PhysRevX.4.011047 [23] Eagle N, P entland A S and Lazer D 2009 Pr o c. Natl. A c ad. Sci. 106 15274–15278 URL http://www.pnas.org/content/106/36/15274 [24] Standaert S, Ronsse S and V andermarliere B 2015 Cliometric a 10 1–26 URL http: //dx.doi.org/10.1007/s11698- 015- 0130- 5 18
Original Paper
Loading high-quality paper...
Comments & Academic Discussion
Loading comments...
Leave a Comment