Supervised Learning and Anti-learning of Colorectal Cancer Classes and Survival Rates from Cellular Biology Parameters
In this paper, we describe a dataset relating to cellular and physical conditions of patients who are operated upon to remove colorectal tumours. This data provides a unique insight into immunological status at the point of tumour removal, tumour cla…
Authors: Chris Roadknight, Uwe Aickelin, Guoping Qiu
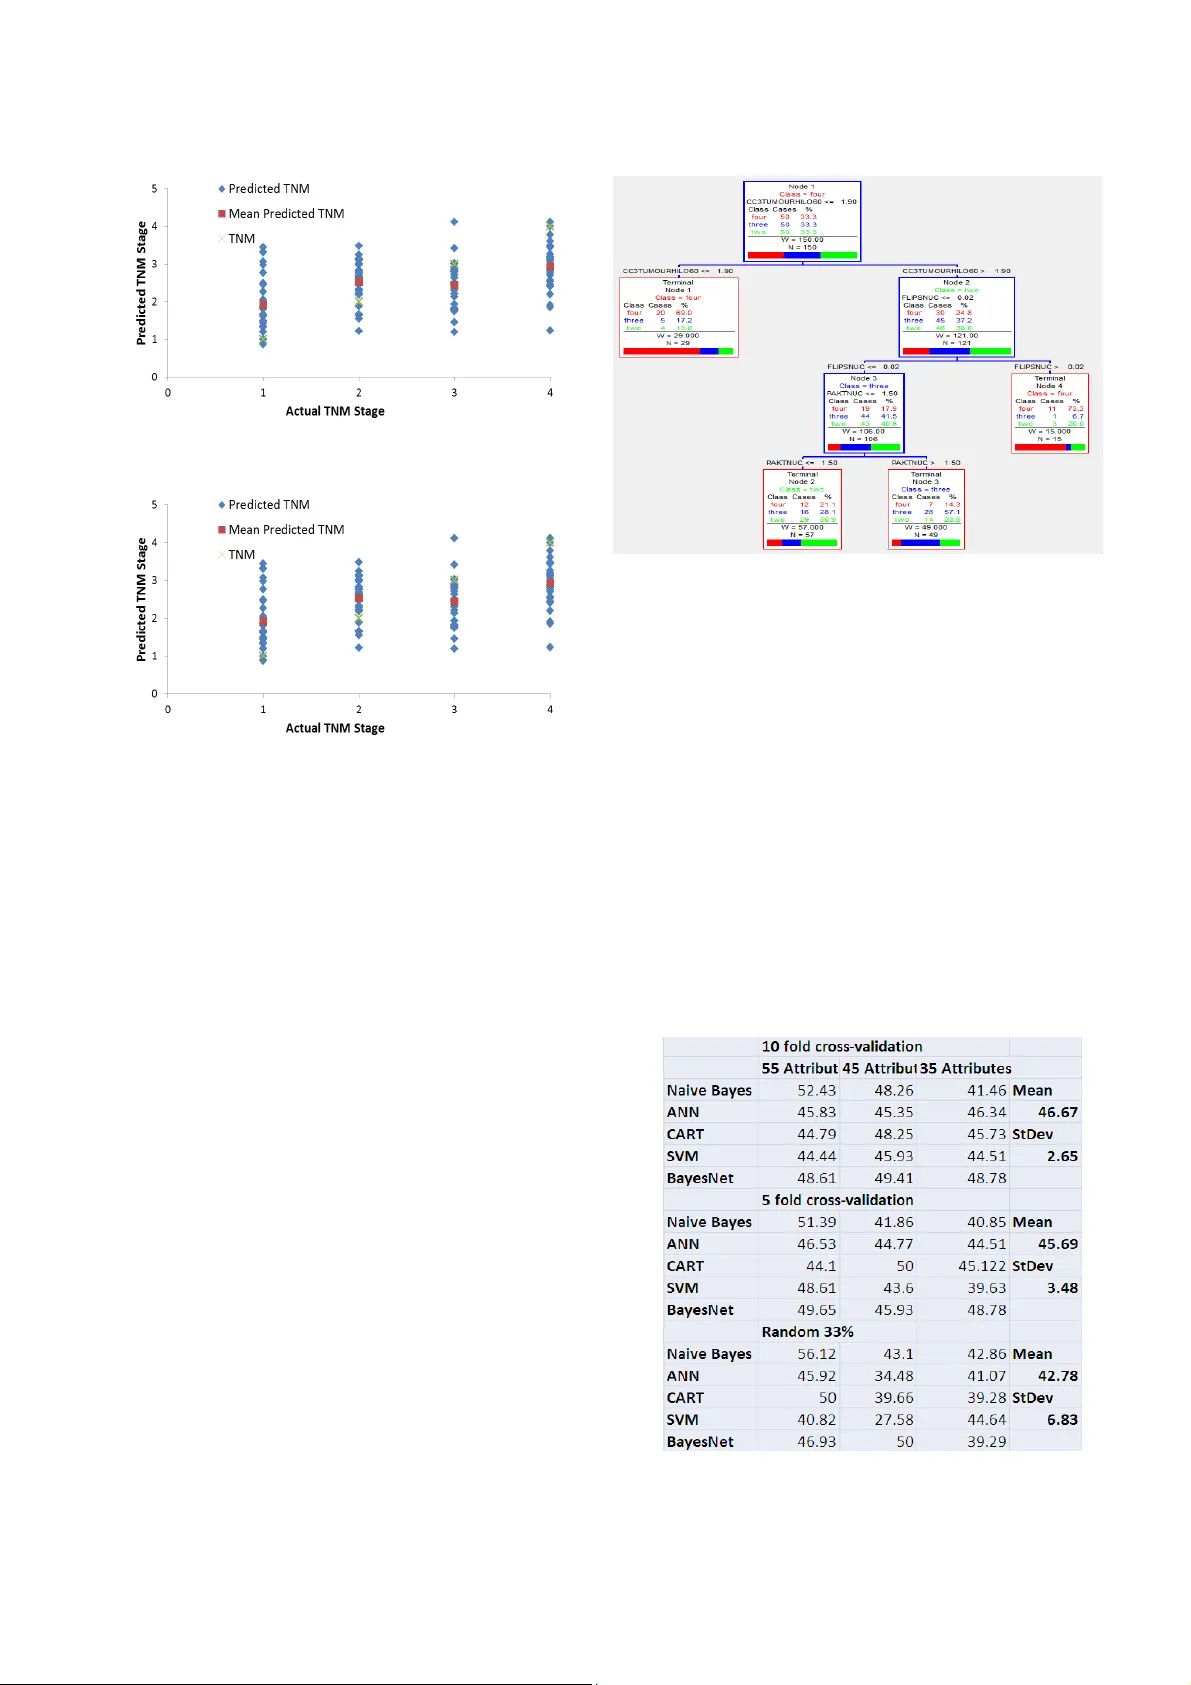
Supervised Learning and Anti-learning of Co l orectal Cancer Classes and Survival Rates from Cellular Biology Param eters Chris Roadknigh t a , Uwe Aickelin a , Guoping Qiu a , John Scholefield b and Lindy Durrant b a. Int elligent Modellin g & Analysis Res earch Group (IM A) School o f Computer Scien ce b. Facult y of Med icine & Heal th Sciences The Universi ty of Nottingham cmr,uxa,qiu @cs.nott. ac.uk Abstract — In th is pa per, we des cribe a dat aset relating to c ellular and physical conditions of patients who are operated upon to remove colorectal tumours . This data p rovides a uniq ue insight into immunolog ical status at t he point of tumour removal, tumour classification and post-operative survival. Attempts are made to learn relation ships between attributes (physical and immunological) and the resulting tumour s tage and survival. Results for conventional machine learning approaches can be considered poor, especially for predicting tumour stage s for the most important t ypes of can cer. This poor perf ormance is furth er investigated an d compared w ith a sy nthetic, dataset b ased on the logical e xclusive-OR f unction and it is show n t hat there is a significant level of “an ti-learning” present in all supervised methods used and this can be expla ined by the highly dimensional, complex and sparsely representative dataset. For predicting the stage o f cancer fr om th e i mmunologi cal attribu tes, anti-learning approaches outperform a rang e of popular algorithms Keywords- Neural Networks, Colorectal Cancer, Anti-learning . I. I NTRODUCTI ON Colorecta l cancer is the third most commonly diagnosed cancer in the w orld. Colorecta l cancers start in the lining of the bowel and grow into the muscle lay ers underne ath then thro ugh the bowel wall [11]. TNM staging involves t he Classifica tion of Malig nant Tumour s • Tumour (T). Size of the tumor and whether it has invaded n earby tissu e • Nodes (N). The exte nt to which regional l ymph no des involved • Metastasis (M). This is the spread of a disease from one orga n or part to anot her non-a djacent orga n. 4 TNM stages (I,II,I II,IV) are generated by combin ing these three indica tor levels a nd are alli ed with increasing seve rity and decreasing surv ival rate s. Treatmen t option s include minor/major surgery , chemotherapy , radiotherapy b ut the correct treatment is h eav ily dependent on the unique features of the tu mour which are summarised by t he TNM s taging. Ch oosing the co rrect treatme nt at this stage is crucial to both the patient ’s survival and quality of life. A major goal of this r esearch is to automatic ally o ptimize the tr eatment plan based on the e xis ting data. The data for this research was gathere d by scientists and clinician s at the University of , Nottingham. The dataset we use here is made up of the 84 attr ibutes for 462 patients . The attribute s are gener ated b y recording metric s a t the time of tumour re moval, the se inclu de: • Physica l data (age , sex etc ) • Immunologi cal data ( levels o f var ious T Cel l subsets) • Biochemical data ( levels of certain prote ins) • Retrospec tive data (post-ope rative su rvival s tatistics) • Clinical d ata (Tum our loca tion, si ze etc). The goal of th is research is tw o-fold, we hoped to be able to use the a ttribute set to accurately predic t: • The TNM st age assigne d by the clinical team. • The subse quent surv ival of t he pa tient We show i n this paper t hat both of these t asks are ex tremely difficu lt using conventio nal t echnique s and th at the dataset might belong to a subset of dataset that require a unique approach. II. P RE - PROC ESSING The dataset supplied is a biological dataset and as such has a rich complement of p repr ocessing issues. 11.32% of the values are m issing , with some attributes having over 40% missing values and som e patients having over 30 % missing values. Missing data pose s a prob lem for most modelling techniques. One appro ach would be to remove every patient or every attribute with any mi ssing data. This would remove a large number of entries, some of wh ich only have a few missing values that are possibly insignifican t. Another approach is to averag e the existing val ues for each attribu te and to insert an a verag e into t he missing value s pace. T he appropr iate av erage may be th e mean, med ian o r m ode depending on the p rofile of the da ta. Much of the d ata take s the form of human analysis of biopsy samples stained for vario us markers. Rather than raw cell counts or m easurem ents of protein levels we are p resented with threshold values. For instance, C D16 is found on the surface of different ty pes of cells such as natura l killer, neutrophils , monocy tes and macrop hages. T he da ta conta ins a simple 0 or 1 for this rather than a count of the number of cell s. This kind of manual insp ection and simplificat ion is tru e for most of t he data an d any modeling solution must work w ith th is limitation. It is apparent tha t the re are some exist ing strong correla tions in t he data. By using a combin ation of c orrel ation coeffic ients and ex pert k nowledge th e data wa s r educed down to a se t of ~50 attribut es. This inclu ded remov ing severa l measurement s t hat were hi ndsight dependent (ie. chemo or radio treatment) and correlated with T NM stage. (ie. D ukes stage). Single attribu te relationship s exist within the datase t but are not strong. Ana lysis of single attribute s can yield a greater than 65% prediction rate when attemp ting to predict which TNM stage a patient was classified as b ut only ~55% when t he TNM stages were restricted to th e more interes ting (TNM stage 2 or 3). If we look at CD59a and CD46 threshold values we can see that t hey are loosely related to survival (fi gure 1 ) with elevated levels of each indicating a reduction in survival averaging ~13 (Figure 1a) and 6 months. (Fig . 1 b) yet n eithe r ar e a strong discriminat or of TNM stage 2 or 3 tumour s. Fi gure 1a. Rel atio nshi p of CD5 9a to surviv al with averag e surviv al rates . Fi gure 1b. Rel atio ns hip of CD 46 to surviv al wi th ave rage survi val rate s. III. L EARNING It is relative ly trivial to build a model that best fits the data, even with numerou s attri butes and missing value s. Unfortunat ely this model is very li kely to be memorising unique combination s of values for each p atient . T his is why models are tested on an unseen t est set to decide how well the trained model gener alises t o the “re st of the world”. Define abbreviation s and acrony ms the fir st time t hey are used in the te x t, even after they have been defined in th e abstract . Abbreviations such as IEEE , SI, MKS, CGS, sc, dc, and rms d o not h ave to be defined. Do not use abbrev iations in the title or head s unless they are unavoida ble. A. TNM Stag e. Several met hods were used in an attempt to predi ct the appropriat e TNM stage of a patient f rom t heir attrib ute set. The methods used i ncluded Bayesian Networks [ 7], N aïve Bayes Clas sifier [8 ], CART [ 3], Multilayer Percep tron [4 ] an d SVM [ 9]. Thes e were eit her self-program med, availa ble in th e WEKA t oolkit [6] or us ed other existin g software suites [5]. When initially loo king at all 4 TNM stages there was some success at p redicting s tages fr om th e attribut e set, partic ularly when s ome of th e patient s and attrib utes with the most missing data were r emoved. Most success was achi eved when predicting T NM stage 1 an d 4, whi ch w ere the least and most severe stages respectivel y. A M ultila yer Pe rceptron (MLP) was t rained using b ack-propagati on of error. This ar tificial neural network archit ecture included 5 sigmoid transfer functio n hidden uni ts and a linear transfer function o utput unit. The d esired output for the for T NM st age 1,2,3 and 4 were rescaled to 0.2, 0.4, 0,6 and 0.8 to allow f or efficient separation . T his app roach s howed excellent accuracy on the trainin g set (F ig 2a) and showed some promise at p redicting TNM stages 1 and 4 for the unseen t est set ( Figure 2b) but was clearl y very poor at predicting stages 2 and 3. This meth od of graded linear output makes for a ne ural net work of l ow complexit y but assumes a l inear progressi on th rough t he TNM st ages. An approach u sing 4 ind ependent bin ary out puts performe d equally poorl y. Figure 2a. Neu ral Network Prediction of TNM s tage for training set Figure 2b. Neural Network P rediction of TNM stag e for an unseen test set Next a CART approach was used, Classification and regressio n trees (CART) are a non-par ametric decision t ree learning techniq ue that prod uces eith er classificatio n or regressio n trees. Decision tr ees are formed b y a collection of rul es based on attrib utes i n the dat aset based on rules th at achieve the b est division t o differentiate observati ons b ased on the dependent variable. This recursive process con tinu es until pre-defin ed stopping rul es are met . Each branch of the tree ends in a termin al nod e. Each obs ervation falls into exactl y one t erminal node, and each termin al node is uniquel y def ined by a se t of r ules. A CART app roach ac hieved similar results when looki ng at al l 4 TNM stages but slightly b etter results could be achieved by ju st looking at TNM stages 2, 3 and 4. (Figur e 3a) with p articular importanc e being assigned t o cleaved c aspase 3 (CC3) pr oteins, a sample CART t ree is shown i n fi gure 3. CC3 has been s hown to pla y an import ant rol e in tumour apoptosis [ 10]. Figure 3. CA RT tree for predictio n on TNM class Differ entiating between TNM stage 2 and 3 i s a priority for this research, th ese a re the st ages where correct choice of post - operative t reatment are most important. We trialed all 5 algorithms (SV M, Bay esian Network, Arti ficial Neu ral Network, Naï ve B ayes Cla ssifier and CART) on 3 different attribut e sets ( 55, 4 5, 35) and used 3 dif ferent testin g regimes (10 fol d cross vali dation, 5 fold cr oss valid ation and a 33% rando m selection) . Tabl e 1 shows the re sults f rom this, the only ap proach t hat performed b etter than guessing was N aive Bayes a nd th is w as only on one of t he t hree attri bute sets. Furtherm ore, if we look at the per formance of all approaches for each validation t echnique as a whole it can be s aid th at the appro aches p erformed s ignificantl y w orse t han gues sing. It must be remembered that algorithms were optimised for tes t set p erformance and p erformance of the t raining set was m uch better (80-98% accurate). This exceptional ly po or performa nce will be discussed more in section 4. Table 1. Test Set performance of different algori thms B. Survival Several of the attributes pres ented in the dataset pertain to the surv ival of the pat ients after their operation to remove th e tumour. T he number of mon ths the pat ient h as surv ived, whether they are s till alive or no t and how they died (if d ead) are all ava ilable. Figure 4 shows surviva l curves for patien ts with greater th an 60 months surviva l or those that died of colorectal cancer prior to the 60 month period. The strong differe nce between surv ival rate s in TNM stage 1 and 4 patients is apparent (ie. at 30 month the survival rate is approximate ly 95 and 5 %). The d ifference b etween patients with TNM stage 2 an d 3 cancers is le ss apparent , for 18 months there is very little diffe rence between mortality for TNM stage 2 and 3 patients.. After 30 months deaths from colore ctal cancer for TNM stag e 1 patients inc rease quite q uickly , in percentage terms stee per tha n any other TNM c lass. Figure 4. Surviv al Curves f or patients at all 4 TNM stages Again focusing on just TNM s tage 2 an d 3 patients w e attempted predict su rviv al at different thresh olds using AI techniques, this time Naïve Bayes, ANN a nd CART. The term “survival” is obviously s omewhat subjective so we us ed severa l time periods to rep resen t survival rang ing from 12 to 60 months, if a patient survived for the assigned number of months t hey were deeme d to h ave surv ived. If w e take just TNM stage 2 and 3 patien ts ag ain, figure 5 shows how well three t echniq ues predicted survival for an unseen test s et, the aver age of all three techniques is also shown. It is apparen t that thes e techniq ues could pe rform slightly better than g uessing at all survival thresholds but with average perfor mances of between 55 and 60% on an u nseen test set (usin g 10 fold c ross validation) t he perf ormance is far from impressive suggesting the issue s discussed in sec tion 3.1 are still p resent. W ith CART per forming wors e than guess ing at a high survival threshold and an A NN performing worse than gues sing at a low surv ival threshold. Fi gure 5. Predi ctio n ac cura cy when m odel ing T NM st ag es 2 o r 3 IV. A NTI -L EARNING In many cases the result s shown in sec tion 3 show some very poor predict ion on an un seen test s et, somet imes be low what woul d b e expected for ra ndom guessing. This k ind of behavior is rare but when i t has be en observe d one o f the dataset types it has b een observed in is biologica l data in general and cancer d ata in particular. We investigated this further by running a ful l range of p redictive te chniques on severa l pre-process ed versions of the original dataset with severa l correlation techn iques. The results from this were tabulated i n Table 1. It is apparent that in all cases results on a test set are a small but significant amoun t below 50%, which would be t he va lue f or a random s elect ion. Results were even lower when hybrid techniqu es such as Bag ging [12] and Boosting [13] were used. If w e assume anti-learn ing is present and invert the out come of the model we find su per ior prediction results to an y learning approach tested. Table 2 shows a c omparison of t he best performing lea rning and a nti- learning techn iques for 3 processed versions of the dataset with 55, 45 and 35 attributes, with the anti-lear ning results s howing up as bette r on al l 3 da tasets. Syntheti c and real world datasets have been shown to express similar an ti-learn ing proper ties. T he simp lest ex ample being the exclusive-OR (XOR) problem, which can be summarised as a logical f unctio n on t wo operands that res ults in a value of true if exac tly on e of the operands has a value of true. This can be t abulated a nd plotte d as fo llows, w ith X and Y being the tw o operands and Z being the result (figure 6). An exclus ive-AND funct ion is j ust the opposite where two operands that results in a value of true if neither or both of the operands ar e true. Tabl e 2. Compariso n of Learning and Anti-l earni ng m ethods of predi cting TNM st age f or dat asets wi th 35, 45 a nd 55 att ribute s Dataset Attributes Method 55 Attributes 45 Attributes 35 Attributes Learning 52.43% (Naive Bayes ) 49.41% (BayesNet) 46.34% (ANN) Antileaning 55.56% (SVM) 54.65% (ANN) 58.54% (Naive Bayes) Anti-learning + Boosting 57.25% (SVM) 56.9% (ANN) 58.54% (Naive Bayes) Fi gure 6. Grap h an d Tabl e s howi ng a st andar d 2 di m ensional XOR dat aset This dataset ca n be learned by an AI approach capab le of non-linear feature extra ction, an example would be an arti fi cial neural network, but only if all 4 operand couple s are p resented with the de sired out put. Th is leaves no sam ples for testing. If we pre sent any 3 of the 4 examp les to any machine learning approach they will generalise to a point where they p redict the unseen t est v alue wrong 100% o f the t ime, in effect the y will “anti-le arn” the proble m. T his is a tri via l, abstract example but is an impor tant indication that if too few datapoints are presented to a machine l earning solution it is pos sible that they will not on ly perform poor ly (ie. equa l to guessing) on an unseen test set but actually perfor m WORSE than guessing. When we are dealing with real world datasets with many attribute s and relatively few samples, the possibili ty that the N dimensiona l search s pace is badly represented is disti nct. Fi gure 7 Predictiv e perfo rmanc e of N eural Network and incr easi ng sam ple sizes We can g enerate a 12 dimens ional sy nthetic XOR st yle dataset by taking all possible combinations of a 12 attribut e binary d atase t (4096 combinations) and passing them through a series o f XOR and XAN D processes: { [ ( A xor B ) xor ( C xand D ) ] xor [ ( E xor F ) xand ( G xand H ) ] } xor { [ ( I x or J ) xor ( K xand L ) ] } If we take this 1 2 dimensional e xclusiv e-OR and exclusive- AND problem we can achiev e degree s of anti- learning w hen small perc entages of the tota l datase t are pre sented to a learning algorith m. Figure 7 shows how presen ting most o f the available data y ields high test set per formance (~90%) bu t re ducing t he sample si ze for training and testing reduces the test set performanc e to a point where it dr ops below 50%, red ucing i t even further m eans any p redic tion t ends towards 50% (guess ing). Initial results for a real world cancer data set appear to occupy an area that would suggest the available data represents only a s mall sample of a much bigger, non- linear ‘complete’ set . Another approach to show anti-lea rning exists in t his dataset and ho w it differs from overtr aining or the absence o f any learn able fea tures is to sho w t he dif ference between training and t esting for a dataset o ver a range of modeling configurations , in t his case AN N arc hite cture. I f we take a ver y simple, single hidden unit ANN we can achieve slightly higher than gues sing performa nce for the Colorec tal Cancer t raining datas et (figu re 8), bu t below gue ssing for test set. A s we inc rease the n umber o f hid den uni ts we see an increase in training set perf ormance up to nearly 100% at 20 hidden units but performance on an u nseen test set yie lds a l ess than 50% performance i n all cases. In cases of a normal, learnable dataset we can see t hat the test s et perfo rmance increases up to an optimal number of hid den units of 7 before overtrai ning occurs and the test s et performance decreases. If the dataset just consis ts of random numbers the test set performanc e a pprox imates to 50% whic h is the same as guessing as there are no genera l features i n the data but adding hidden un its allow s a degree o f mem oriza tion i n the tra ining set. From th ese results we can conclude that the cancer dataset consists of a mixture of unlearna ble attribute relation ships and anti-lea rning rela tionship s. Fi gure 8. Traini ng and test set p erfo rm ance fo r colorectal c ance r data as the num ber of hidde n uni ts i s in creas ed V. C ONCLUSION S We ha ve presented r esults for a u nique dataset b ased on th e biochemi cal and factors associ ated with colorectal tumour patients. This dataset is limited in man y ways, but extremel y important nonetheless and m odeling any relatio nships or features ba sed on t he data set to hand is an urgent priority. Generall y, whe ther attempting to predict TNM stages or survi va l, pati ents at T NM st age 1 a nd 4 h ave more clear indi cators in the attri bute set. TNM s tage 2 and 3 pr ovides a much mor e challenging pr ediction task, s o much so that the TNM stage appears much less important when predicting survi va l f or these 2 stages t han other indicat ors. Rule tr ee, Ba yesian an d N eural appro aches have been used with som e limited succe ss for pr ediction, but in most experi ments the re is a lack of rep eatable s uccess in developing a m odel that accu rately predi cts s urvival or T NM sta ge on an unseen t est set. On e possible re ason for this cou ld be overfittin g, thou gh a w ell-construct ed ANN o r CART t ree shouldn ’t exhibit overfittin g and i n an y cas e t hey sho uldn’t be WORSE th an guessing. Anot her possibi lity is poor or inaccur ate labelin g of pati ents tu mour stages . But again this should o nly result in poor p erforman ce on the u nseen test set . Modelli ng a datas et using all availabl e data ma y p roduce the best po ssible model if t he modelling proce ss i s ideall y carried out, but i deal modelling is much more dif ficult without a test set. Metho ds such as Correlated Activity Pr unin g [14 ] may be useful in ensuring a minimal sized model and will be one focus of future research . Th ere might be improvement to learning b y u si ng re cent advancements s uch as multiple kernel learning [15] but it is j ust as li kely, as with boost ing, methods that i mprove l earning m ay b e j ust as effective at i mproving anti-learni ng. This failure to accurately cl assify TNM st ages or survival perio ds ma y in fact be u seful i f we s uspect t here are s ubsets within t he gro ups. The failure to correctly cl assify a set of patients ma y mean thes e p atients have dif ferent characteristics while sti ll expressi ng the s ame class ification of tumour. T his would i mply t hat treat ment based s olely on t umour classifi cation would be sub-optimal. Overall this is an it erative process with a large number o f st eps, each providin g more i nsight i nto the datas et and its modelling. W e are sti ll at th e st age whe re we ar e fi ltering an d focusin g the original data so t hat we arrive at t he m ost important, complete datas et for modelling the relationship betwe en tumour markers/i mmunology, tu mour stage and survi vability. It i s also very s ignifi cant that preprocessing the patient ’s data (sel ecting based on different thresholds) h as a si gnificant difference on the resulting mod els. We h ave propos ed an e xplanation for t he r esults which i s a phenomen on called “Anti-learning”. Here, unique charact eristics of the dataset l ead to a condition where valid ation on an un seen test set pro duces results significantl y and r epeatedly worse t han guessing. Interestingl y, one real world dataset that dem onstrates this b ehaviour is very s imilar to t he dataset used here , being t he classificatio n of r esponse to chemoradi otherapy in Esophageal A denocarcino ma patients using microarra y dat a of b iopsied patients [ 1][2]. Wor k with a 12 di mension al exclusi ve-OR pro blem sh ows that when only a small po rtion of the dat aset is availabl e t here is a real possibili ty th at anti-learning will be pres ent. I t i s possible t o then i nfer that with s ome hi ghly dim ensional co mplex biologi cal data sets, when w e h ave a rel ati vely smal l s ample si ze, anti -learning m ay als o exist. I nitial experiments appeared to s how th at t he b est possible approach to cl assify in g pati ents with TNM stage 2 and 3 tumours was to focus on anti- optimisi ng the l earning process to ac hi eve t he worse p ossible test s et p erformanc e and t hen i nverting t he und erl y ing mo del. Overall when looki ng for test set perfor mance on th e important TNM sta ge 2 and 3 patients, the best possibl e results can be achieved if we inverted the answ er supplied by an ADABoos ted SVM or ANN. Usi ng t his method i t is possibl e to achi eve reli able predic tion rat es of 55-60 % on a n unseen test set of higher than any l earnin g al gorithm attempted. Taking this approach involves a significant leap of faith but we have s hown that this method i s o ptimal when dealing with a small sample of a compounded exclusive-OR datas et. It is not impossible to im agine that ma ny comp lex biological datasets also p resent u s w ith a s mall, no is y sam ple o f a much bigger co mplex dataset and this must be i nvestigated f urther. This dataset will be made avai lable, in an anonomysed form for other research groups to apply thei r own method s to ascertain t he tr ue extent of the anti -learning beh avior. Int erested parties should contact the auth ors about this. R EFERENCES [1] Kowalczy k, A. 2007. Cl assification o f a nti-learnable biological and syntheti c data, Proc. PKDD, pp. 176-187. [2] Kowalczy k, A., Greenawalt, D., Bedo, J ., Duong, C., Raskutti, G., Thomas, R., Phillips, W . 2007. Validation of Anti-learnable Signature in Classi? cation of Response to Chem oradiotherapy in Esophageal Adenocarcinom a Patients. Proc . I ntern. Symp. on Optim ization and Systems Bi ology, OSB. [3] Steinberg, D., an d P. C olla. 1 997. CART-Cl assification and r egression trees. Salfo rd Systems, San Di ego, CA. [4] Bishop, C.M. Neural Networks for Pattern Recognitio n. C larendon Press, Oxfo rd, 1995 [5] http://www. salford-systems.com/ cart.php [6] Hall, M. , Fran k, E., Holmes, G., Pfahringer,B., Reutemann, P. and Witten, I.H. (2009); The WEKA Data Mining Software: A n Update; SIGKDD Explo rations, Vol ume 11, Issue 1. [7] Jensen, F.V. (1996).An Introduction to B ayesian Networks. New York: Springer-Verlag . [8] Lewis, D . D. 1998. Naive (Bayes) at fort y: The independence assumptio n in info rmation r etrieval. In Proceedings of E CML-98, 10th European Co nference on Machine L earning (Chemnitz, G ermany, 1998), 4-15. [9] Suykens, J. A. K. and Van derwalle, J. 1999. Leas t Sq uares Support Vector Machines. Neural Processing L etters, 9:293-300 [10] Bagshawe KD, Springer CJ, Searle F, Antoniw P, Sharma SK, M elton RG, Sherwood RF. 1 988. A cytotoxic agent can be generated select ively at cancer sites. Br J Cancer. 58:700-7 0 [11] Ha mil ton S, Aaltonen L. 2000. Pathology and Genetics of Tu mors of the Digestive System. New York: WHO Publ ications. [12] Breiman, L. 19 96. B agging predictors. Machine L ear ning. 24(2):123- 140. [13] Freund, Y. a nd Schapire, R.E. 1996. Experiments with a new boosting algorit hm. In: Thirteenth International Conference on Machine Learni ng, San Francisco, 14 8-156, [14] Roadknight, C.M., Ball s, G.R., Mills, G. E., Palmer-Brown, D., 1 997. Modeling complex environmental data. I EEE Transactio ns on Neural Networks 8 ( 4), 852-862. [15] Bach, F. R. Lanckriet, G. an d Jordan, M. 2004. Mu lt i ple kernel learning, conic duality, and the SMO algorithm. In C. E. Brodley, editor, Twenty-first international conference o n Machine learning. ACM,.
Original Paper
Loading high-quality paper...
Comments & Academic Discussion
Loading comments...
Leave a Comment