Overlaid Cellular and Mobile Ad Hoc Networks
In cellular systems using frequency division duplex, growing Internet services cause unbalance of uplink and downlink traffic, resulting in poor uplink spectrum utilization. Addressing this issue, this paper considers overlaying an ad hoc network ont…
Authors: Kaibin Huang, Yan Chen, Bin Chen
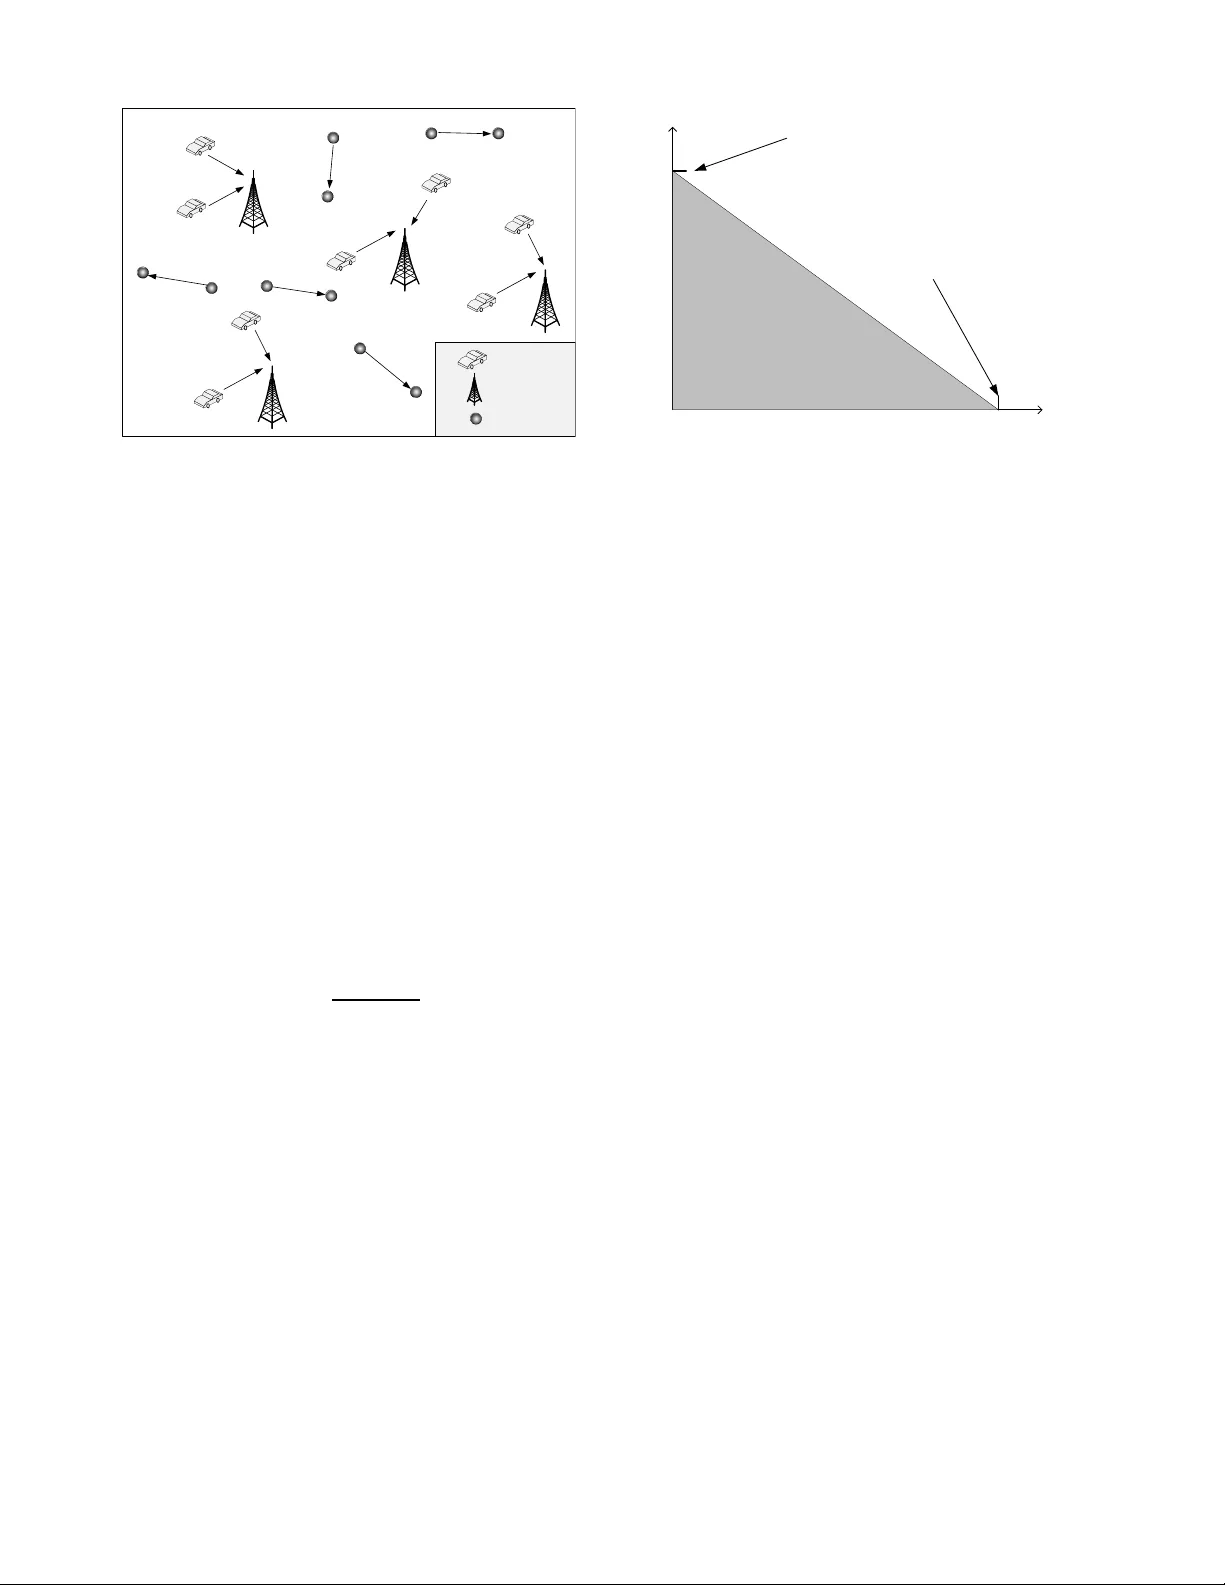
Overlaid Cellular a nd M obile Ad Hoc Netw orks Kaibin Huang ∗ , Y an Chen † ∗ , Bin Chen ‡ , Xia Y ang ‡ , and V incent K. N. Lau ∗ ∗ Departmen t of E lectronic & Com puter En gineering Hong Kong University of Science & T e chnolog y Clear W ater Bay , Hong Kong Email: k huang @ieee.org, eeknlau@ust.hk † Institute o f I nforma tion & Communicatio n Engineerin g Zhejiang University , Hangzhou , 31002 7, P .R. China Email: y anchen@ust.h k ‡ Huawei T ech nolog ies Co. Ltd . Bantian, Longgan g District, Shenzhen 518 129, P .R.China Email: binchen @huawei.com, yangxia@huawei.com Abstract — In cellular systems using frequency division du- plex, g rowing Internet services cause unbalance of uplink and downlink traffic, resulting in poor upli nk spectrum utilization. Addressing this issue, this paper considers overlaying an ad hoc network onto a cellu lar uplink network for impro ving spectrum utilization and spatial reuse efficiency . T ransmission capacities of the ov erlaid networks are analyzed, which are defined as the maximum densities of the ad h oc nodes and mobil e users under an outage constraint. Using tools from stochastic geometry , the capacity t radeoff curves for the overlaid networks are shown to be linear . Deploying overlaid networks based on frequency separation is prov ed to achiev e hi gher network capacities than that based on spatial separation. Furthermore, sp atial diversity is shown to enhance network capacities. I . I N T RO D U C T I O N In existing cellular systems based on frequen cy division duplex (FDD) such as FDD UMTS [ 1], equal b andwidths are usually allocated for uplin k an d downlink transmission. W ith rapidly growing wireless Intern et servic es, downlink tr affic load is increasingly h eavier than the uplink counterp art, which is a key chara cteristic of In ternet data [2], [3]. Consequently , uplink spectrum is underu tilized. T o addre ss this issue, this paper con siders overlaying an ad ho c network o nto a FDD cellular system f or imp roving the u tilization of up link spec- trum and also the spatial reu se efficiency . This paper focuses on chara cterizing th e network capacity trad eoff between the overlaid cellular and ad hoc networks. One measure of network capacity is transport capacity for multi-ho p network s that was in troduc ed in [4 ] and has attracted active r esearch (see e.g. [5 ], [6]). An other measur e of network cap acity is transmission ca pacity introd uced in [7] for sing le-hop networks, which is d efined as th e maxim um number of successful co mmunic ation links per unit area under the sig nal-to-inter ference- noise ratio (SINR) and o utage co n- straints. Transmission cap acity has been used fo r in vestigating the spatial reuse efficiency of different types of mob ile ad hoc networks ( see e.g. [8], [9]). Com pared with transport capacity , transmission cap acity allows more accurate analysis and easier computatio n [7], and h ence is ado pted in this paper . This p aper co nsiders overlaying the cellu lar uplink and ad hoc networks using two metho ds. Th e first is b lind transmis- sion where the transmission of ad hoc no des and mob ile users are indep endent; the second is fr equen cy mutual exclusion where ad h oc n odes transmit over frequ ency sub -chann els unoccu pied by mobile users. For both methods, the tr adeoff curves for the transmission capacities of two overlaid networks are shown to be linear . Th e r egion boun ded by each curve and positive axes is called the capacity region, which contain s all allowable co mbination s of ad hoc no de and mob ile user densities u nder the outage con straint. The capacity region for frequen cy mutual exclusion is p roved to b e larger th an th at for blind transmission. Thus, the former is a more efficient method for overlaying cellular an d ad hoc networks. Furth ermore, capacity regions fo r both overlay metho ds are shown to be enlarged by exploiting spatial diversity . I I . N E T W O R K A N D C H A N N E L M O D E L S A. Network Model The overlaid cellular and ad ho c networks is illu strated in Fig . 1. The locations of tr ansmitting nod es in the mobile ad hoc network are mod eled as a Poisson point pro cess (PPP) following the common ap proach in th e literatur e [7] , [10]. Specifically , the po sitions of the transmitters form a homog eneous PPP , denote d as Φ , on a 2 - dimension al plan e and with th e d ensity represen ted by λ a . Let T n denote the coordin ate of the n th tr ansmitting node. Each transmitting node is associated with a receiving no de located at a fixed distance denoted as d . Similarly , the positions of base stations in the cellular network are modeled as a homogeneo us PPP on the s ame plane as the ad hoc n etwork. Let Π b and λ b represent the process of base stations and its density , r espectiv ely . Each base station commun icates with M uplink mobile users, here after refe rred to simp ly as mobile users. Thus, the density o f m obile users is λ u = M λ b . The coor dinates of the n th base station and the m th associated mo bile user are represented by B n and U n,m = B n + Z n,m respectively . T o simplify an alysis, the distance between a b ase station and a mo bile user is fixed at r , thus | Z n,m | = r ∀ m, n . The case of random distances is considered in the fu ll-length paper . M o b i l e u s e r B a s e s ta ti o n A d h o c n o d e M o b i l e u s e r B a s e s ta ti o n A d h o c n o d e Fig. 1. Overl aid cel lular and ad hoc netwo rks The uplink spectrum is divided into K sub-ch annels. Each mobile u ser o ccupies one sub-ch annel. T o sim plify an alysis, different base stations assign the same sub set of M sub- channels to their corr espond sets of M mobile users. Let M denote th e ind ices of the M sub-cha nnels used b y m obile users. E ach tr ansmitter in the ad h oc n etwork either random ly selects a sub -chann el for transmission f rom the co mplete set of sub-chan nels or the subset not bein g u sed b y mobile users. These two m ethods are r eferred to as blind transmission and fr equency mutual exclusion , respectively . The n etworks are assumed to be interfer ence limited an d thus n oise is neglected for sim plicity . Consequently , the reli- ability of data p ackets receiv ed b y either a ba se station or a node is determine d by the signal-to- interferen ce ra tio ( SIR). Let S denote the r andom channe l p ower fo r an arbitrar y lin k, Ω the proc ess of in terferers 1 , an d I n the n th interf erer in Ω . Thus, assuming that d ata transmission p ower , deno ted as P D , is id entical for all tra nsmitters, the SIR at the receiv er en d of the link u nder co nsideration is g i ven as SIR = S P T n ∈ Ψ I n . (1) Since the SIR is independ ent o f P D , P D = 1 is assumed for simp licity . The corr ect decod ing of rec eiv ed data packets requires the SIR to exceed a threshold θ , w hich is id entical for all receiv ers in th e networks. In o ther words, the rate of informa tion sent fr om a transmitter to a r eceiv er is no less than log 2 (1 + θ ) assuming Ga ussian signaling . T o support this informa tion r ate with hig h probab ility , the outage pr obability that SIR is below θ m ust be smaller than o r equ al to a giv en threshold 0 < ǫ < 1 , i.e. P out ( λ ) = Pr(SIR < θ ) ≤ ǫ (2) where P out ( λ ) denotes the SIR ou tage p robab ility as a f unc- tion o f λ . 1 As discussed later , depending on the overla y m ethod , the interfe rers can include unintended mobile users, ad hoc transmitters in Φ , or both. λ u λ a α C 1 f o r b li n d t r a n s m i s s i o n α C 2 f o r f r e q u e n c y m u t u a l e x c l u s i o n C 1 f o r b li n d t r a n s m i s s i o n (1−α) C 2 f o r f r e q u e n c y m u t u a l e x c l u s i o n Fig. 2. The network capacity regi on for the overla id cellular ( λ u ) nd ad hoc ( λ a ) networks in the regime of small outage probabili ty . The parameter α is the percentage of sub-cha nnels used by the cellular networ ks; C 1 and C 2 are defined in (7) and (11), respecti vely . B. Cha nnel Mod el The mo del for a sing le sub- channel is described as follows, where the su b-chann el ind ex is omitted. Assume a narr ow- band sub- channel m odel with flat fading. Each su b-chann el consists of path-loss and small fading compon ents. Consider a typical receiv er wh ich can b e either a b ase station o r a ad h oc n ode. A sub-chann el between th e typical re ceiv er an d the associated transmitter is r − α Q 0 or d − α W 0 depend ing on whether the transmitter is a mobile u ser or a nod e, w here α and ( Q 0 and W 0 ) rep resent the p ath-loss expone nt an d fading gain s, respectively . Let Ω be th e po int proce ss groupin g all interferers to the typic al receiver , includ ing either m obile users, or ad hoc transmitters, or both depending on the network overlay method. Then a sub-chan nel between the n th interferer in Ω and the typical rec ei ver is D − α n G n , where D n is the distance and G n is the fading gain. The ran dom variables { D n } and { G n } ar e i.i.d. with in the same set. I I I . N E T W O RK C A P AC I T Y T R A D E O FF : A S Y M P T OT I C A N A L Y S I S Similar to the notion of transmission capacity in troduced in [7], [ 8], the network cap acity c onsidered in this paper is defined as the m aximum density of tran smitters supported by a network under th e outage co nstraint in (2 ). Let P b ( λ u , λ a ) and P a ( λ u , λ a ) d enote the outage pr obabilities at the ba se station and an ad hoc receiver , respecti vely . Then the capacities of th e cellular ( λ u ) and the ad ho c ( λ a ) networks can be written as ( λ u , λ a ) = min arg P − 1 b ( ǫ ) , ar g P − 1 a ( ǫ ) . (3) Note that the thro ughp ut p er unit area for the cellular and the ad hoc network s ar e (1 − ǫ ) log(1 + θ ) λ u and (1 − ǫ ) log(1 + θ ) λ a , resp ectiv ely . Th e ne twork capacity tradeoff b etween the overlaid cellular and ad ho c networks is an alyzed fo r the regime of small outage probability regime ǫ → 0 in subsequent subsections. A. Ex isting Resu lts The cap acity of a mobile ad hoc network und er an o utage constraint is an alyzed in [ 8]. The key results in [8 ] are summarized in the following lemma and serve as the startin g point for our analy sis. Lemma 1 (W eber et al [8]): Consider a narrow-band ad hoc ne twork where the locations o f tr ansmitters are a hom o- geneou s PPP h aving the density λ . The ch annel between a typical pair of tran smitter and r eceiv er is d − α W , and that between the typical r eceiver and the n th interfe rer is D − α n G n . The SIR ou tage p robab ility fo r th e typical receiver is b ounded as P l out ≤ P out ≤ P u out where P l out = 1 − E exp − κλθ δ P u out = 1 − E 1 − δ 2 − δ κλθ − δ 1 − δ 1 − δ κλθ − δ 2 + e − κλθ − δ where δ = 2 α and κ = π E [ G δ ] W − δ d 2 . For ǫ → 0 , P out can be expa nded as 2 P out = E [ κ ] λθ δ + O λ 2 θ 2 δ . (4) B. Cap acity T radeoff: Blind T ransmission The outage prob ability for data received at a base station is derived f or ǫ → 0 . Consider the m th one of the M sub - channels assign ed to mo bile users. T he mob ile users using this sub-chan nel form a point proce ss denoted as ∆ m = { B + Z m | B ∈ Φ } = Φ + Z m , where Z m represents th e shift in location . Since the h omogen eous PPP Φ is tran slation inv ariant, ∆ m is also a homogen eous PPP with th e density λ b . Con sider a ty pical base station B and the assoc iated mob ile user U m using th e m th assigned su b-chann el, where the subscript n is o mitted for simplicity . W ithout loss o f g enerality , B is assumed to be located at the origin, and h ence U m = Z m . The data rece i ved at B from U m is interfered with b y other- cell mobile users and the transmitters in the ad hoc networks that use the same sub-chan nel, which are represented by the processes { ∆ m / { U m }} and Π m , respectively . Th e process of these interferers is { ∆ m / { U m }}∪ Π m . By Sli vnyak ’ s Theorem [11], cond itioned on U m , the process of other mob iles users { ∆ m / { U m }} remains as a hom ogeneo us PPP with the same density λ b . Next, consider a typic al pair of transm itter T and receiver R in the ad hoc ne twork. By blind tr ansmission, T and R ra ndomly selects one of K sub-c hannel for comm unica- tion. Let S T denote the index of the selected sub channel. Then S T follows the un iform distribution with the su pport { 1 , 2 , · · · , K } . By treating S T as a mark of T and using the Marking Th eorem [1 2], the m arked PPP Π k = { ( T , S T = k ) | T ∈ Π } is a homo geneou s PPP with density λ a /K . Combining ab ove r esults and the superpo sition proper ty of PPP , the process of interfer ers for U m , na mely { ∆ m / { U m }} ∪ Π m , is a hom ogeneo us PPP with the density λ b + λ a . Based o n the above re sults, the relationship λ u = λ a / M , and Lemma 1 , for a single- user d ata stream receiv ed at a 2 This result is generalize d from that in [8] where the asymptotic case θ → ∞ is considered. Note that ǫ → 0 corresponds to λθ δ → 0 . base station, the asym ptotically small outag e pr obability can be wr itten as P b = E [ κ b ] λ u M + λ a K θ δ + O λ u M + λ a K 2 θ 2 δ ! . (5) where κ b = π E [ G δ ] Q − δ r 2 . For a rec ei ver in the ad h oc network, the outage pr obability is de riv ed for ǫ → 0 as fo llows. Consider a ty pical pair of transmitter T and receiver R commu nicating using the k th sub- channel. If k / ∈ M , the interf erers f or R are only uninten ded transmitters in the ad hoc network that also use the k th sub- channel, represented by Π k / { T } . I f k ∈ M , R is inter fered with b y both the transmitters in Π k / { T } and also the mob ile users u sing th e k th sub-chann el grou ped in the process ∆ m . Similar to earlier deriv ation, by u sing Lemm a 1, for the data received at a receiver in th e ad ho c network using th e k sub- channel, th e asymp totically small ou tage p robability c an be written a s P a ( k ) = E [ κ a ] λ u M + λ a K θ δ + O λ u M + λ a K 2 θ 2 δ ! , k ∈ M E [ κ a ] λ a K θ δ + O λ a K 2 θ 2 δ ! , k / ∈ M (6) where κ a = π E [ G δ ] W − δ d 2 . The tradeoff between the capacity of the cellular a nd ad hoc n etworks is obtain ed by using (3), (5) and (6). Denote asymptotic eq uiv alence as ∼ = and define it as the relation- ship between two fu nctions f 1 ( ǫ ) and f 2 ( ǫ ) that satisfies lim ǫ → 0 f 1 ( ǫ ) f 2 ( ǫ ) = 1 . Recall that th e capacities of the cellular and the ad h oc networks are d efined in (3) as the maximu m densities o f mobile users λ u and ad hoc tra nsmitters λ a under the outage constraint. The network capacity tradeoff curve thus obtained is given in the following proposition. Pr oposition 1: Using th e overlay meth od of b lind tr ansmis- sion, the capacity of the cellular network λ u and that of the ad h oc n etwork λ a satisfies the following r elationship λ u α + λ a ∼ = C 1 , ǫ → 0 (7) where α is the fraction of sub-ch annels assigned to mobile users, an d C 1 = K ǫθ − δ π E [ G δ ] min 1 d 2 E [ W − δ ] , 1 r 2 E [ Q − δ ] . (8) The region bound ed by the cu rve in ( 7) and the con straints λ a ≥ 0 an d λ u ≥ 0 is the cap acity region for the overlaid cellular and ad hoc networks as illustrated in Fig. 2. Any combinatio n o f λ a and λ u within this region satisfies the outage co nstraint in (2). As observed fro m Fig. 2 (a), the area o f capacity region is increased by increasing α . This implies th at fo r blin d transmission , allocating a sub set of sub- channels r ather than the whole set to mo bile u sers results in inefficient use of the spectru m. Besides increasing the number of mobile users, the capacity region can b e also en larged by increasing C 1 in (8). This is equivalent to o ptimizing a set of parameters, including increasing the number of sub-cha nnels K o r the outage constraint ǫ , or reducing the distances between the transmitter and receiver in each link ( d and r ) or the function s of fading g ains ( E [ W − δ ] a nd E [ Q − δ ] ). Reducing these fu nctions can be achiev ed by exploiting spatial di versity as d iscussed in Section III- D. C. Capacity T radeoff: F requency Mutual Exclusion For frequen cy mutual exclusion, the c ellular and ad hoc networks u se different sub-sets of sub-cha nnels, namely M and K / M , and thus do not interf ere with each other . Specifi- cally , the data stream received a t a b ase statio n over the sub- channel m ∈ M co ntains inter ference fro m mob ile users in other cells using the same su b-chann els; a nod e rec eiving data using k th sub-cha nnel is interfered with on ly by unintend ed transmitting nodes also using the sub-ch annel k . Following a similar pr ocedure as in the preced ing sectio n, the ou tage probab ilities for the overlaid n etworks are obtained as P b = E [ κ b ] λ u θ δ M + O λ 2 u θ 2 δ (9) P a = E [ κ a ] λ a K − M θ δ + O λ a K − M 2 θ 2 δ ! (10) where κ a = π E [ G δ ] W − δ d 2 . By apply ing the outage con- straint to (9 ) and (10), th e tradeoff curve f or the cap acities of the c ellular and ad h oc networks is derived a nd gi ven in th e following prop osition. Pr oposition 2: Using the overlay m ethod o f frequ ency m u- tual exclusion , the cap acity of the cellu lar network λ u and th at of th e ad h oc n etwork λ a satisfies the following r elationship λ u α + λ a 1 − α ∼ = C 2 , ǫ → 0 (11) where C 2 = K ǫθ − δ π E [ G δ ] 1 d 2 E [ W − δ ] + 1 r 2 E [ Q − δ ] . ( 12) As shown in Fig. 2, the capacity region f or the case o f frequen cy m utual exclusion is bounded b y the curve defined in ( 11) an d th e first quad rant of the coord inate system. Sim ilar comments as for the c ase of b lind tran smission are also applicable for the present case. By co mparing (7) and (1 1), it can b e observed that C 2 > C 1 and the facto r (1 − α ) increases the cap acity λ a . In oth er words, the capa city region for frequen cy mu tual exclusion is larger than that fo r blind transmission. A com parison of capacity regions is given in Section IV. D. Effect o f Spatial Diversity The capacity region o f the overlaid cellular and ad hoc networks can be en larged by enhancing the channel g ains of data link s W and Q by exploiting spatial diversity . Spatial div ersity is created using multiple antennas an d provides an effecti ve way of counter acting fading . Amo ng many av ailable spatial diversity technique s, we consider the simp lest one: 1 2 3 4 5 6 7 8 9 10 0.05 0.1 0.15 0.2 0.25 0.3 0.35 0.4 Diversity Order, L 1 Capacity Region Parameter, C 1 (or C 2 ) Blind transmission Frequency mutual exclusion Fig. 3. The capacity regi on parameter C 1 (or C 2 ) vs. div ersity order L 1 for the data link in the ad hoc network. The data link in the cellular network has the di versity order L 2 = L 1 + 2 . Other parameters are chosen as d = 5 meters, θ = 3 , and K = 1000 and ǫ = 0 . 01 . beamfor ming [13]. Assum ing i. i.d. Rayleig h fading a nd beam - forming at either the receiver o r transmitter (on e-sided), the channel g ains W and Q follow the chi- squared d istribution with the num ber of com plex degree s of freed om equal to L 1 and L 2 , resp ectiv ely , which are referred to as diversity o rders. The diversity order for the interferen ce chann el G is assumed to b e o ne. Based o n th e ab ove model, the n etwork capacity regions in Proposition 1 and 2 have clo se-form expressions a s giv en in th e fo llowing lemma. Lemma 2 : For i.i.d. Ray leigh fading, data link s using one- sided b eamform ing, and r = d , the capacity tradeoff curve is giv en a s: 1) Blind tr ansmission: λ u α + λ a = ˜ C Γ( L min ) Γ( L min − δ ) , ǫ → 0 (13) where ˜ C = K ǫθ − δ [ π d 2 Γ(1 + δ )] − 1 . 2) Frequen cy m utual exclusion: λ u α + λ a 1 − α = ˜ C Γ( L 1 ) Γ( L 1 − δ ) + Γ( L 2 ) Γ( L 2 − δ ) , ǫ → 0 . The proof is given in Append ix. Let C 1 and C 2 denote the terms on the right- hand-size of (1 3) and (14), respectively . For illustration, c onsider the d iv ersity or ders L 2 = L 1 + 2 , the d istance r = d = 5 me ters, the SIR thresh old θ = 3 , the number of sub-ch annels K = 100 0 , and the outag e co nstraint ǫ = 0 . 01 . Fig 3 plots C 1 and C 2 versus the diversity ord er L 1 . As observed from Fig 3, both C 1 and C 2 increases as L 1 grows due to the diversity g ains. More over , C 2 is larger tha n C 1 and their difference is relati vely larger for a smaller diversity order, indicating that the cap acity for frequen cy mutu al exclusion is higher than tha t f or blind transmission . I V . S I M U L AT I O N A N D N U M E R I C A L R E S U LT S Fig. 4 compares the values o f the c apacity region p arameter C 1 computed u sing (7) a nd th ose o btained by simulation. The diversity order is cho sen as L 1 = L 2 = 4 and o ther 10 −4 10 −3 10 −2 10 −1 10 0 10 −2 10 −1 10 0 10 1 Capacity Region Parameter, C 1 Outage Constraint, ε Simulation Asymptotic Approximation Fig. 4. Comparison of the approximate d and simulated values of the paramete r C 1 that defines the capaci ty regi on for the over laid cellular and ad hoc networks using blind transmission. The approxi mated values for C 1 are computed using (7). parameters have identical values as used for Fig. 3. As observed fro m Fig. 4 , the theor etical values obtain ed b ased on the asymp totical assum ption ( ǫ → 0 ) m atch the simulation results very well. A similar observation is also mad e for C 2 giv en in (11), but the detailed comparison is o mitted in this paper . T hese ob servations lead to the conclusion that the asymptotical results obtain in Proposition 1 and 2 are also applicable f or the non-asymp totic r egime of ǫ e.g. ǫ > 0 . 1 . Fig. 5 co mpares the cap acity regions for two network overlay methods: b lind transm ission and fr equency mutual exclusion. The values of parameter s are ide ntical to those used f or g enerating Fig. 4. As observed f rom Fig. 5 , the network overlay based on frequency m utual exclu sion results in a mu ch larger capacity r egion than that using blind trans- mission. Therefore, the form er is a mor e efficient meth od for implementin g th e overlaid cellular and ad hoc n etworks. Nev- ertheless, the method of f requen cy mutua l exclu sion requires nodes in the ad h oc n etwork to detect sub-chan nels u nused by mobile u sers, b ut such an operation is unn ecessary for blind transmission. Detection o f av ailable sub -chann els can be based on ca rrier sending or side inf ormation broadcast by base stations. A P P E N D I X P R O O F F O R L E M M A 2 The resu lt fo r the c ase of frequ ency mu tual exclusion is obtained b y sub stituting E [ G δ ] = Γ(1 + δ ) , E [ Q − δ ] = Γ( L 2 − δ ) , and E [ W − δ ] = Γ( L 2 − δ ) into (11). T o ob tain the result for the case of blind transm ission, it is sufficient to use (7) and prove th at Γ( L 1 ) Γ( L 1 − δ ) > Γ( L 2 ) Γ( L 2 − δ ) if L 1 > L 2 and v ise versa. W ithout lo ss of generality , assume L 1 > L 2 . Using the prop erty Γ(1 + x ) = x Γ( x ) and Γ( n ) = 0 0.02 0.04 0.06 0.08 0.1 0.12 0.14 0.16 0.18 0 0.01 0.02 0.03 0.04 0.05 0.06 0.07 0.08 0.09 0.1 Capacity of Ad Hoc Network, λ a Capacity of Cellular Network, λ u Frequency mutual exclusion Blind transmission Fig. 5. Comparison between the capacity region s for two netwo rk overlay methods, namely blind transmission and frequency mutual excl usion. ( n − 1)! Γ( L 1 ) Γ( L 1 − δ ) = ( L 1 − 1)( L 1 − 2) · · · L 2 ( L 1 − 1 − δ )( L 1 − 2 − δ ) · · · ( L 2 − δ ) Γ( L 2 ) Γ( L 2 − δ ) ( a ) > Γ( L 2 ) Γ( L 2 − δ ) . The inequality (a) holds since δ > 0 . This completes the proo f. R E F E R E N C E S [1] H. Holma and A. T oskala, WCDMA for UMTS: Radio Access for Third Genera tion Mobi le Communications . John Wil ey & Sons,, 2004. [2] P . Marques, J . Bastos, and A. Gameiro, “Opportunistic use of 3G uplink licensed bands, ” in Pr oc., IEEE Intl. Conf. on Communications , pp. 3588–3592, May 2008. [3] D. Kim and D. Jeong, “Capaci ty unbalance between uplink and down- link in spectr ally ov erlaid narrow-ban d and wide-ba nd CDMA mobile systems, ” IEE E T rans. on V eh. T ec hnology , vol. 49, pp. 1086–1093, July 2000. [4] P . G upta and P . R. Kumar , “The capacit y of wireless netw orks, ” IEEE T rans. on Info. Theory , vol. 46, pp. 388–404, Mar . 2000. [5] A. Jovicic , P . Vi swanath, and S. R. Kulkarni, “Upper bounds to transport capac ity of wireless networks, ” IEEE T rans. on Info. Theory , vol. 50, pp. 2555–65, Nov . 2004. [6] A. Ozgur , O. Lev eque, and D. N. C. Tse, “Hierarchi cal cooperati on achie ve s optimal capacity scaling in ad hoc netw orks, ” IEEE T rans. on Info. Theory , vol. 53, pp. 3549–3572, Oct. 2007. [7] S. P . W eber , X. Y ang, J. G. Andre ws, and G. de V eciana, “Tr ansmission capac ity of wirele ss ad hoc network s with outag e constraints, ” IEE E T rans. on Info. Theory , vol. 51, pp. 4091–02, Dec. 2005. [8] S. W eber , J. G. Andrews, and N. Jindal, “The ef fect of fadi ng, channel in ver sion, and threshold scheduling on ad hoc netw orks, ” IEEE T rans. on Info. Theory , vol. 53, pp. 4127–4149, Nov . 2007. [9] K. Huang, J. G. Andre ws, R. W . Heath, Jr ., D. Guo, and R. A. Berry , “Spatial interfere nce cancelat ion for mobile ad hoc netw orks: P erfect CSI, ” submitted to IEEE Globecom; availabl e: http:// aps.arxiv .org/abs/0 804.0813 , Mar . 2008. [10] S. W eber , J. G. Andre ws, X. Y ang, and G. de V eciana, “Transmissio n capac ity of wireless ad hoc networ ks with successi ve inte rference cance llation, ” IEEE T rans. on Info. Theory , vol. 53, pp. 2799–2814, Aug. 2007. [11] D. Stoyan, W . S. Ken dall, and J. Mecke, Stoc hastic Gemoetry and its Applicat ions . Wil ey , 2nd ed., 1995. [12] J. F . C. Kingman, P oisson pr ocesses . Oxford Univ ersity Press, 1993. [13] A. Paulraj, R. Nabar , and D. Gore, Introd uction to Space-T ime W ir eless Communicat ions . Cambridge, UK: Cambridge U ni versity Press, 2003.
Original Paper
Loading high-quality paper...
Comments & Academic Discussion
Loading comments...
Leave a Comment