Evaluating Link Prediction Accuracy on Dynamic Networks with Added and Removed Edges
The task of predicting future relationships in a social network, known as link prediction, has been studied extensively in the literature. Many link prediction methods have been proposed, ranging from common neighbors to probabilistic models. Recent …
Authors: Ruthwik R. Junuthula, Kevin S. Xu, Vijay K. Devabhaktuni
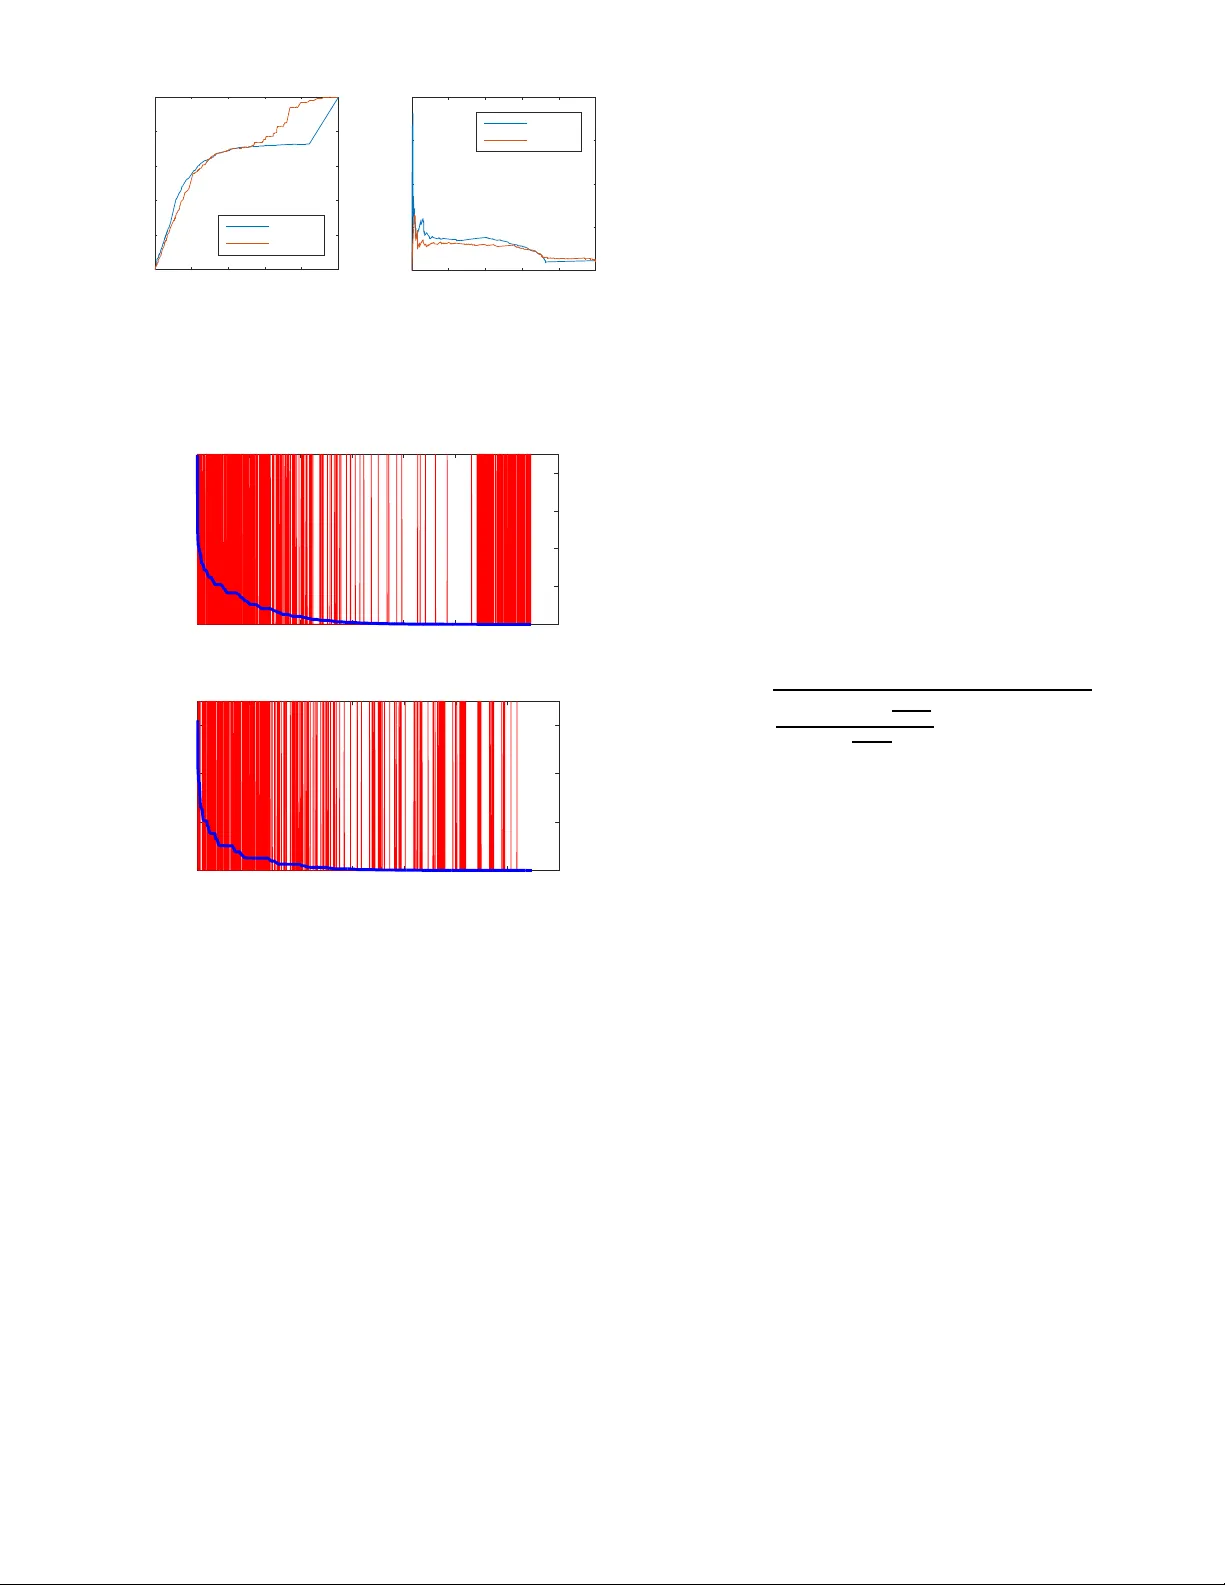
Ev aluating Link Prediction Accurac y on Dynamic Netw o rks with Added and Remo ved Edges Ruthwik R. Junu thula, K evin S. Xu, and V ijay K. Dev abhaktun i EECS Departmen t, University of T oledo 2801 W . Bancroft St. MS 3 08, T oledo, OH 43606 -3390 , USA rjunuth @utoledo.ed u , ke vin.xu @utoledo.ed u , vijay .d ev abh aktuni@uto ledo.edu Abstract —The task of pr ed icting future relationships in a social network, known as lin k prediction , has been studied extensively in the literature. Many link p rediction methods hav e been proposed, ranging fr om common neighbors to probabilistic models. Recent work by Y ang et al. [1] has highl ighted sever al ch allenges in ev alu ating link prediction accuracy . In dynamic networks where edges are both ad ded a n d removed o ver time, the lin k prediction problem is more complex and invo lves predicting b oth newly added and n ewly remov ed edges. This results in new challenges in the ev aluation of dynamic l ink prediction methods, and the r ecommendations pro vid ed by Y ang et al. [1] are no longer applicable, because they d o not address edge r emova l. In this paper , we in vestigate severa l metrics curr en tly u sed for ev alu ating accuracies of dynamic li nk prediction methods and demonstrate why they can be misleadin g in many cases. W e prov i de sev eral reco mmendations on ev alu ating dynamic link prediction accuracy , inclu ding separation into two categories of ev alu ation. Finall y we propose a un ified metric to characterize link prediction accuracy effectively u sing a single number . I . I N T RO D U C T I O N The popu larity of onlin e social networking services has provided pe ople with myriad new platforms for social interac- tion. M any social networking ser vices also offer p ersonalized suggestions of othe r peo ple to f ollow or interact with, as well as websites or pr oducts th at a u ser m ay b e in terested in. A key co mpone nt in g enerating these perso nalized suggestion s in volves perf orming lin k pr ediction on social networks. The traditional problem o f link p rediction on ne tworks is typically defined as fo llows: given a set of vertice s o r nodes V and a set of edges or lin ks E co nnecting p airs o f n odes, output a list of s cores for all pairs of nodes without edges, i.e. all pairs ( u, v ) / ∈ E , where a highe r score for a pair ( u, v ) denotes a higher predicted likelihood o f an edge formin g b etween n odes u and v at a fu ture tim e 1 . Many link p rediction methods have been propo sed; see [2], [3] for surveys of the liter ature. In this paper, we co nsider a m ore complex dyna mic n et- work setting wh ere ed ges a re b oth a dded and r emoved over time, wh ich is often re ferred to as dyn amic link pr ed iction [4] or f orecasting [5]. For instan ce, in a social n etwork with timestamp ed ed ges de noting interactio ns between people (nodes), an ed ge may appear a t several time instances where a pair o f peop le ar e freq uently interacting then d isappear after interactions ce ase. Since existing e dges between n odes may be 1 Link prediction is also used to predict missing edges in partially observ ed netw orks, where the score denotes the predicted likelihoo d of an unobserv ed edge betwee n u and v . T ABLE I I L L U S T R A T I O N O F D I S A G R E E M E N T A M O N G C U R R E N T M E T R I C S U S E D T O E VAL U ATE DY N A M I C L I N K P R E D I C T I O N AC C U R A C Y Method A UC PRA UC Max. F1-score TS-Adj [6 ] 0.780 0.239 0.371 TS-AA [7] 0.777 0.065 0.144 TS-Katz [8 ] 0.87 9 0.077 0.149 SBTM [9] 0.799 0.138 0.337 removed at a fu ture tim e, the dyn amic link predictio n pro blem is more complex and also in volves co mputing a predicted score for e x isting edges, because they may disappear at a fu ture time. Evaluating link pr ediction accur acy inv olves com paring a binary label (whether or not an edge exists) with a real- valued pred icted scor e. Th ere are a variety o f techniqu es for ev aluation in t his setting, including fixed-th reshold metho ds such as F1-scor e and variable-th reshold methods such as the area und er the Receiver Operating Characteristic (R OC) c urve, or A UC, and the area und er the Precision -Recall (PR) cur ve, or PRA UC. Y ang et al. [1] provide a compreh ensive stud y o f ev aluation metrics for the traditional link predictio n prob lem. Due to the sev ere class imbala nce in link prediction (because only a small fraction of n ode pairs f orm edges), it was recommen ded to use PR cur ves an d PRA UC for evaluating link predictor s rather than R OC cu rves an d A UC. T o the best of ou r knowledge, ther e has not been pr ior work on ev a luating accu racy in the dynam ic lin k p rediction or forecasting setting we con sider . Pr ior studies on dy namic link p rediction h av e typically used A UC [4], [5], [ 7], [8], [10], log-likelihood [5 ], [10], [11], and maximum F1-score [10] as ev aluation metrics. The ev aluation of sev er al dynamic link prediction method s using curre nt metr ics is shown in T ab le I. (W e discu ss these methods in fur ther detail in Section II-C5.) The table shows a c lear disagr eement betwee n cur rent metrics for dynam ic link p rediction accur acy . T S-Katz [8] has the highest A UC but a low PRA UC an d max imum F1- score, wh ile TS-Adj [6] has highest PRA UC and ma ximum F1-score , but lower A UC. The SBTM [9] ran ks seco nd in all three metr ics. Which of these fou r meth ods is most a ccurate? W e seek to answer this q uestion in this paper . Th is typ e of disagreemen t among ev aluation metrics h as also been ob served in prior studies, including [10], but has no t b een in vestigated f urther . Inspired by the work of Y ang et al. [1] in the trad itional link p rediction setting, we p rovide a th oroug h investigation o f ev aluation m etrics for th e dynam ic link predictio n p roblem . Our aim is not to identify th e most accu rate link pr ediction algorithm , but ra ther to establish a set o f recommen dations for fair an d effective ev aluation of th e accuracy of dy namic link prediction algorithm s. Our main contributions are the fo llowing: • W e discuss why currently u sed metrics for dynamic lin k prediction can be misleading (Section III). • W e illustrate the importan ce of geo desic distance f or th e dynamic link pred iction task an d the do minance o f edges at distance 1 (Section IV). • W e separ ate the dynamic link prediction problem into two different lin k pr ediction prob lems based on geo desic dis- tance and suggest metr ics for fair and effecti ve e valuation for each of the two p roblems (Section V). • W e p ropo se a unified metr ic that characterizes link pre- diction accuracy using a single nu mber and demonstrate that it av oids the sh ortcomin gs of cu rrently u sed metrics for dynam ic link pred iction ( Section VI ). I I . B A C K G RO U N D A. Pr o blem Definition The dyn amic link pr ediction or for ecasting problem is defined as follows. Giv en a set of nod es V and a set of e dges E conn ecting pair s of n odes, ou tput a list of scores for all pairs of n odes, wher e a h igher scor e for a pair ( u , v ) denotes a higher predicted likelihood of an edge between u and v at a f uture time. Again , the main difference in the dynamic lin k prediction task co mpared to tradition al link p rediction is th e need to outpu t scores for node p airs where an ed ge is alr ead y pr esent , beca use the ed ge may be removed in the futur e. W e consider dynam ic networks obser ved at d iscrete time steps 1 , 2 , . . . , T . A co mmon pr ediction setting used in time series forecasting is the rollin g 1 -step forward p rediction: for each t = 1 , . . . , T − 1 , one trains a mo del using times 1 to t then predicts time t + 1 . In this pape r , we perform dynamic link prediction in the rollin g 1 -step forward p rediction setting. The output of th e link predictor conta ins T − 1 sets o f predicted scores for times 2 to T (trained u sing times 1 to T − 1 , respectively), which are th en comp ared against T − 1 sets of binary outp uts d enoting the actu al states (ed ge o r no edge) o f all node pairs at times 2 to T . T o ev alua te accu racy , we co ncatenate all of the predicted scores into a single vector and all of the b inary outpu ts into a second vector . This settin g ha s b een adop ted in many past studies including [4], [5], [ 10], [1 1]. As noted in [1], we exclude no de pairs corr espondin g to n ewly app earing no des at any particular time step, since the iden tities of these new nodes are unknown at the time the pr ediction is c omputed . B. Data Sets W e use two data sets a s r unning examples throug hout this paper . Th e first is the NIPS co -autho rship da ta collec ted by Globerson et al. [12], consisting of p apers from the NIPS T ABLE II S U M M A RY S TA T I S T I C S F O R D AT A S E T S U S E D I N T H I S PA P E R . T H E L A S T F O U R RO W S S H O W M E A N S TATI S T I C S OV E R A L L T I M E S T E P S . NIPS Face book Directe d No Y es Number of time steps 17 9 T otal number of nodes 2 , 715 1 , 330 Mean number of edges 321 3 , 714 Mean edge probability 1 . 7 × 10 − 3 2 . 8 × 10 − 3 Mean ne w edge probabilit y 8 . 3 × 10 − 5 1 . 4 × 10 − 3 Mean pre v . observed edge probability 0 . 031 0 . 27 confere nces f rom 1988 to 2003. Nodes in th e NIPS data denote authors, and und irected edge s denote collabor ations b etween authors. E ach year is used as a time step, and an edge be tween two nod es at a particular time step den otes that the author s co-wrote a p aper to gether in th e NIPS con ference that year . The data set con tains 2 , 865 autho rs; we remove all au thors who n ever co llaborated with any oth er au thors in the data set, leaving 2 , 715 authors (nodes). The second data set is the Facebo ok data collected by V iswanath et al. [1 3]. Nodes den ote users, and d irected edges represent inter actions between users via posts fro m one u ser to another user’ s Facebook wall. All interactions are time- stamped, and we u se 90 -day time steps ( similar to the analyses in [9], [13]) from the start o f the data trace in Jun e 2 006, with the final complete 90 -day in terval endin g in November 20 08, resulting in 9 total time steps. V iswanath et al. co llected data on over 60 , 000 n odes. T o make the dyn amic link prediction problem mo re compu tationally tr actable, we filter o ut nod es that ha ve both in- and out-degree l ess than 30 in the aggregated network over all time steps, leaving 1 , 330 nodes. Summary statistics f or the two data sets are shown in T able II. The ed ge probability at each time st ep is gi ven b y the number of actual e dges d ivided by the numb er o f po ssible edges, i.e. the nu mber of node pairs. W e d efine a new edge at tim e t as an edge that did n ot appear in any time step t ′ < t . W e de fine a pr eviously observed ed ge at time t as an edge that app eared in at least o ne time step t ′ < t . No tice the large d isparity between the new a nd previously observed ed ge probab ilities—we will re-visit this point in Section V. C. Methods for Dyn amic Link Pr ed iction Most meth ods for d ynamic link p rediction in the literatu re fall into o ne of three classes. 1) Univariate T ime Series Models: Perh aps the most straightfor ward appro ach to dynamic link prediction is to apply standard univ ariate time series models to each node pair . Autoregressive In tegrated Moving A verage (ARIMA) mod els were used for dyn amic link pr ediction in studies [7], [8]. A special case, the ARIMA( 0 , 1 , 0 ) mo del, is an exponentially- weighted m oving av erage (E WMA) model, which has b een used in studies [4], [ 6], [1 4], [15]. An other ap proach is to model the p robability o f an e dge b etween a p air of nodes to be prop ortional to the previous number o f occur rences o f that edge [5], [10], [ 11], [ 14], i.e. a cu mulative or growing window av e rage, rather than an exponen tially-weighted one. Dun lavy et al. [1 4] ref erred to the EWMA as th e co llapsed weig hted tensor and the cumulative average as the collapsed tensor . Univ ariate tim e ser ies appr oaches treat each n ode pair separately by ignorin g the rest of the network alto gether . In doing so, the predicto rs based on univ ariate time series models are limited in their pr edictive ability; fo r instance, they only predict futur e o ccurren ces of p reviously obser ved edges and canno t pr edict new e dges . Thus th ese predicto rs are of ten used as baselines f or compar ison purposes. In many cases, howe ver, these baselin es have p roven to be sur prisingly comp etitiv e in accuracy as evaluated by existing metrics such as A UC [4], [5], which can be quite deceiving as we discuss in Section VI. 2) Similarity-Based Metho ds: Node similarity-b ased meth- ods have b een amo ng the ear liest pro posed metho ds f or the traditional link predictio n problem. These me thods exploit the large number of trian gles that are observed empirically in networks such as frien dship networks to predict n ew e dges. T ypically used methods include common neighbo rs, Adamic- Adar, Jaccar d coef ficien t, preferential attachmen t, and Katz [2]. These metho ds ar e often used in a static setting, wh ere only a single snapshot of a network is available. In the case o f dy namic networks, these similarity-based methods h av e b een used in several different manne rs. Huang and Lin [ 8] agg regated the dynamic network over time to form a static network then ap ply similar ity-based meth ods. G ¨ unes ¸ et al. [7] com puted nod e similar ities a t each time step then model these similarities using ARIMA models. Dunla vy et al. [1 4] p ropo sed a truncated version of the Katz pred ictor based on a low-rank appro ximation o f a weighted average o f past ad jacency matrices. From these studies, it ap pears that the Adamic-Ada r and Katz pr edictors have been the m ost accu rate among the similarity-ba sed pr edictors. Similarity-based methods have the opposite weakness of link p redictors based on univ a riate time series models; that is, they igno re whether an ed ge h as occu rred in the p ast b etween a pair of nodes. These method s are sometimes used together with univ ariate time series mod els in p ractice [7], [8]. 3) Pr obabilistic Generative Models: An alternative ap- proach for dynamic link prediction is to fit a pr obabilistic generative model to the sequence of observed ne tworks. A generative mod el for a dynam ic n etwork repr esents the net- work (up to time t ) b y a set of u nobserved pa rameters Φ t . Giv en the values of the parameter s, it th en p rovides a mo del for the probab ility of an e dge betwe en any pair o f n odes ( u, v ) at time t + 1 , which is used as th e lin k pr ediction score for ( u, v ) . Since the parameters Φ t are unobserved, one typically estimates them fro m the sequ ence o f network s then uses the estimated parameters to comp ute the link prediction score. The link pr ediction or f orecasting accuracy is often used as a measure of good ness-of-fit fo r the g enerative mod el. Sev er al classes of gen erative m odels f or d ynamic ne tworks have been proposed, including dynamic latent f eature models and dy namic stochastic b lock models. In a latent featur e model, e very no de in a network h as an unobserved (typ ically binary) featu re vector . An ed ge between two no des is then formed condition ally independently of all other nod e pairs giv en their f eature vectors. These models h av e b een ad apted to dynam ic ne tworks b y allowi ng the latent features to chang e over time [5], [10], [11]. Such mod els have tremend ous flexibility; however , fitting these models ty pically requires Markov cha in Monte Carlo ( MCMC) methods that scale up to only a few hun dred no des. Stochastic block m odels (SBMs) d ivide nodes into classes, where all n odes within a class are assum ed to h av e iden tical statistical prop erties. An edg e between two nodes is fo rmed indepen dently of all other node pairs with pro bability de- penden t only on the classes o f the two nodes, giving the adjacency m atrix a block structu re wher e b locks cor respond to pair s of classes. SBMs hav e been extended to the d ynamic network setting by allowing th e ed ge proba bilities and c lass membersh ips to change over time [4], [9], [16]. The models propo sed in [4], [9] can be fit usin g an extended Kalman filter and local search procedur e th at scales to a fe w thousand nodes, an order of mag nitude larger th an metho ds f or fitting dyna mic latent feature models. 4) Other Metho ds: Du nlavy et al. [14] proposed to use m a- trix an d ten sor factorizations, n amely trun cated singular value decomp osition ( TSVD) and canon ical decomp osition/parallel factors ( CANDECOMP/P ARAF A C or CP) tensor mod els, r e- spectiv ely . T ylenda et al. [17] p ropo sed a “time-aware” version of a local pr obabilistic model based on the max imum-en tropy principle. Th e ap proach inv o lves we ighted co nstraints based on the times at which edges occurred . 5) Methods Considered in This P aper: I n this paper, we consider methods from each of the first three categories: • T S-Adj [6]: a univ aria te time series model applied to each node pair . • T S-AA [7]: a similarity-based meth od that extends the Adamic-Ada r link predictor to the dynamic setting by applying a time series mo del to the Ad amic-Adar scores over time for a node pair 2 . • T S-Katz [8]: a similarity -based method that extend s the Katz predictor to the dyn amic setting by app lying a time series model to the Katz scores over time fo r a node pair 3 . • SBTM [9]: a prob abilistic generative model based on stochastic block models. W e emp hasize ag ain that the objecti ve of this p aper is n ot to identify the b est pred iction algorithm, thus this list is not exhaustive. F or simplicity , we use the EWMA, which correspo nds to ARIMA (0 , 1 , 0) with forgettin g or decay factor of 0 . 5 as the time series model for each o f the methods with prefix T S. Hig her ac curacy is likely attain able by b etter m odel selection f or the ARIMA model param eters, but it is o utside the scope of this paper . 2 Adamic-Adar is not applicable to directed networks so we first con vert the Facebook networ k to an undirected network before applying TS-AA. 3 The approach is slightly differ ent from what was proposed in [8 ] and is similar to the approach used in [7] for TS-AA; we find this approac h to be almost univ ersally more accura te than the approa ch in [8]. T ABLE III C O N F U S I O N M AT R I X F O R B I N A RY P R E D I C T I O N Predict ed 1 ’ s ( p ) Predict ed 0 ’ s ( n ) Actual 1 ’ s ( P ) True Positi ves ( T P ) Fa lse N ega ti ves ( F N ) Actual 0 ’ s ( N ) False Positi ves ( F P ) Tru e Neg ati ves ( T N ) I I I . E X I S T I N G E V A L UAT I O N M E T R I C S The currently e mployed e valuation m ethods discussed in the introduction and sho wn in T able I indicate the lack of a princip led metric, which ma kes it d ifficult to ev alu ate the accuracies o f dyn amic link prediction m ethods. Most of the ev aluation metrics used in link pred iction h av e been borrowed from other applicatio ns such as in formatio n retriev al and classification. Hence these metrics are naturally biased to fa vor certain aspects over others, which ma y r esult in eith er over - or under-representin g the accur acy of a particu lar meth od. The output of a link pr edictor is usually a set of re al-valued scores, which are compared against a set of b inary labels, where eac h label denotes th e p resence ( 1 ) or ab sence ( 0 ) o f an ed ge. On e tech nique fo r co mparison i s to threshold t he scores at a fixed value, transform ing the real-valued scores into b inary pr edictions. These binary p redictions can then be compare d ag ainst the binary labels by c omputin g th e confusion matrix shown in T able II I then u sing metrics based on the confusion matrix. A seco nd technique inv olves sweep ing the threshold over the en tire rang e of pr edicted scores an d plottin g a threshold curve displaying the v ariatio n of one metric against another . A third tech nique, applicable only to pro babilistic models, is to evaluate th e likelihood of the mo del given the set of binary labels. A. Information Retrieval-Based Metrics In infor mation retriev al, one is ty pically conc erned with two metrics c alculated from th e con fusion matrix in T ab le III: precision ( T P T P + F P ) and recall ( T P T P + F N ). Precision and recall are o ften co mbined into a sin gle m easure u sing th eir h armonic mean, known as the F1-score ( 2 · recall · precision recall + precision ). The precision , recall, and F1 -score all v ary with th e choice of threshold applied to the real-valued scores. As an alternativ e to choosing a threshold, one sometimes computes the precision at k , also known as the top k p redictive rate, which de notes the nu mber o f cor rectly pred icted links from the top k sco res. In th e traditio nal link p rediction setting, k is typically chosen to be eq ual to the numb er of actual new ed ges P [2]. Relativ e metrics are also used, such as the improvement in top k predic - ti ve rate as co mpared to expected rate of a r andom pred ictor [2]. Y ang et al. [ 1] discussed and emp irically demo nstrated se veral sho rtcoming s of using fixed-th reshold metrics in the traditional lin k p rediction setting, which led to un stable results and disagr eements as the thresh old was varied. W e o bserve these sho rtcoming s also in the d ynamic link prediction setting. An alternative to fixed- threshold metrics is to use thr eshold curves, which work by shiftin g the thr eshold, computin g th e confusion matrix for each thresho ld, and finally co mputing metrics based on the co nfusion matrices. Thresho ld cu rves f or different predictors are often compared using a single scalar measure, typically the ar ea under the cu rve. In inf ormation retriev al, th e com monly used thr eshold cu rve is the Precision- Recall ( PR) curve. W e d enote the area und er the PR cu rve by PRA UC. Simp ly linea rly interpo lating between points on th e PR cur ve has been sh own to b e inap prop riate for calcu lating PRA UC; we use t he proper interpolation approach as discussed in [18]. PR curves consider only prediction of th e positiv es and are gen erally used fo r need le-in-hay stack p roblems common in inform ation retrie val, wh ere negatives dom inate and are not interesting . For link pred iction, PR curves give c redit for correctly p redicting edges but do not giv e credit f or correctly predicting no n-edg es. Due to the sparsity of most ty pes of networks includin g social networks, th e num ber of n on-ed ges is much greater than the numb er of ed ges, so Y ang et al. [1] recommen d the use o f PRA UC fo r ev alu ation in the traditional link prediction setting. 1) Uses in Dyna mic Link Prediction: In the d ynamic link prediction setting , Kim e t al. [10] pro posed to use the max- imum F1-score over all po ssible thresh old values, i. e. iden ti- fying th e point on the PR curve that max imizes F1-score . In this manner, it utilizes a single thresho ld that is determin ed by sweeping the PR curve rathe r tha n choo sing a thr eshold a prio ri. This metric d isplays similar ev aluatio n properties as PRA UC d ue to its dependen ce on the PR curve. The norma lized discounted cumu lativ e g ain (NDCG) over the top k link prediction sco res [17] is another info rmation retriev al- based m etric that been used for ev alua ting dynam ic link prediction accuracy . It is a fixed-thr eshold metr ic that suffers fr om the same drawback s a s other fixed-threshold metrics as discussed by Y ang et al. [1]. 2) Shortcomings for Dyn amic Link Pr e diction: W e argue that the PR curve is inap prop riate for dy namic link pred iction because it o nly consid ers the edges (positives). Accur ate prediction of existing edges that d o not a ppear at a fu ture time (negatives ), is a n important aspect of d ynamic link prediction and is no t captured b y the PR curve ! Th us the PR cu rve and metrics d eriv ed from the PR curve, such as PRA UC and maximum F1-score, may b e highly dece iving in the dynamic link prediction setting. Notice fro m T able I th at th e most accurate link pr edictor ac cording to PRA UC an d m aximum F1-score is the TS-Adj baseline p redictor th at d oes n ot p r edic t any n ew edges ! W e expand o n this discussion in Section V -B. B. Classification-Based Metrics In classification, the comm only used metr ic is classification accuracy ( T P + T N P + N for bina ry classification ) over all data points, which are no de pairs in the case o f link pr ediction. Classification accu racy is often deceiving in th e ca se o f highly imbalanced data, where hig h accuracy can b e o btained even by a random predictor . In binary classification, one is often concerne d with th e true po siti ve rate ( T P R = T P T P + F N ) and false po siti ve rate ( F P R = F P F P + T N ), wh ich can be calcu lated from the co nfu- sion matrix in T able III for a fixed threshold. By sweeping the threshold, on e ar rives at the Receiv er Operating Characteristic (R OC) curve. Different R OC curves are typically co mpared using the area under the R OC cu rve (A UC or A UR OC). 1) Uses in Dyn amic Link Prediction: The A UC giv es a single v alu e that can be used to compare accuracy against other models a nd is the most commo nly used metric for evaluating dynamic link prediction accuracy [4], [5], [7], [8], [1 0], [14]. The main difference com pared to the traditional link prediction task is that the A UC is c omputed over all p ossible node p airs, not only node pairs without edges. G ¨ unes ¸ et al. [ 7] also ev aluated A UC over smaller sub sets of node p airs, such as node pairs with n o edges over the past 3 time steps. Sp litting up the evaluation into different su bsets is a step in the righ t direction; h owe ver, G ¨ unes ¸ et al. [7] chose th e su bsets in a somewhat ad-h oc fashion an d still rely on A UC over all no de pair s as an ev alu ation me tric, wh ich is pro blematic as w e discuss in the fo llowing. W e present a principled app roach for splitting u p the evaluation o f dynam ic link prediction accuracy in Section V. 2) Shortcoming s fo r Dyna mic Link Prediction: Y ang e t al. [1] claimed that A UC is d eceiving f or ev alu ation of accuracy in the tr aditional link pred iction setting due to the locality of e dge fo rmation. They f ound empirically that the probab ility o f forming a new edg e between a pair of n odes decreases as the geo desic (shortest path) distan ce betwee n the node p air incre ases. W e d emonstrate in Section IV that this problem is ev en gr eater in the dynamic link prediction setting, where ed ges at distance 1 , i.e. ed ges th at h av e been previously observed, are a lso considered in the e valuation. One of the appe aling pr operties of A UC is its interpretatio n as the probability of a randomly s e lected positiv e instance appearin g above a rand omly selected negativ e instance [19]. In the traditional classification setting, where instances are assumed to be independent and identically distributed (iid), this interp retation can be very usefu l. Howe ver, as we demo n- strate in Section IV, nod e pairs ar e certain ly not iid, and ed ge formation prob abilities vary gr eatly based on whe ther an edge has p reviously existed. Using only this inform ation, one can construct a pred ictor th at achieves high A UC, as evidenced b y the TS-Adj pred ictor in T ab le I. Hence poolin g togeth er all node pairs to ev alu ate A UC can be hig hly d eceiving. C. Likelihood-Based Metrics Giv en a probabilistic model for observed data, the likelihood of a set of pa rameters is given b y the p robab ility o f the observations given those para meter values. Since th e actual parameter v alues are unk nown, one typically calcu lates th e likelihood using optimal paramete r estimates or the estimated posterior distribution of the param eters gi ven the observed data. It is often easier and more nu merically stable to work with the log-likeliho od rather than the likelihood itself, so the log-likelihood of a model is usually reported in practice. 1) Uses in Dyn amic Link P r ediction : Likelihoo d-based metrics are often used for evaluating l ink prediction accu- racy fo r gener ativ e models and are a natural fit given their probab ilistic nature. I n th e dy namic link predictio n setting, the 0 2 4 6 8 Geodesic distance 0 0.2 0.4 0.6 0.8 Fraction of all edges (a) 0 2 4 6 8 Geodesic distance 10 -4 10 -3 10 -2 10 -1 10 0 Edge probability (b) Fig. 1. (a) Fract ion of all edges formed at each geode sic distance in the Face book data. E ach point denotes the number of edges formed at a certain geodesic distanc e divi ded by the total number of edges formed at all distances. (b) E mpirical probabi lity of forming an edge at each geodesic distance in the Face book data. E ach point denotes the number of edges formed at a certain geodesic distance div ided by the number of node pairs at that distanc e. observations correspond to the observed network 1 tim e step forward, i.e. at tim e t + 1 , wh ile the parameter s correspo nd to the gen erative model parameter s at time t as discussed in Section II -C3. Th e lo g-likelihood h as b een used in studies [5], [10], [11] as a metric for dynamic link prediction accuracy . Re- searchers often also calculate the log -likelihood of a baseline model, which is then used to measure r elativ e improvement of a p roposed model in ter ms of lo g-likelihood . For instance, studies [5 ], [1 1] u se a Bayesian inte rpretation of a cumu lativ e av e rage a s a baseline model. 2) Shortcomings fo r Dynamic Link Pr ed iction: In general, log-likelihood s may be very co mplex to calculate d ue to the effects o f constant ter ms that a re usually ig nored when maximizing the log-likelihood . Addition ally it is n ot possible to obtain likelihood values for link predicto rs that are not based on pro babilistic mod els. Thus the scope of this metric is limited both b y its complexity and applicab ility to only a small subset of link prediction techniqu es. I V . T H E E FF E C T O F G E O D E S I C D I S TA N C E O N D Y N A M I C L I N K P R E D I C T I O N One of the main differences b etween the typical machine learning setting an d th e link p rediction setting is that node pairs ar e n ot indepe ndent and identically d istributed (iid). It has been shown that the probab ility of forming an edge between two nod es is h ighly dep endent on the length of the shortest path between th em, often called the geo desic dista nce or ju st the distance. In the traditional link predictio n problem, most ed ges a re for med at geod esic distanc e 2 , and the pro- bability of edg e formatio n gen erally decreases mono tonically with increasing geodesic distance [1]. In the dyn amic link p rediction problem , we also need to consider no de pairs at geo desic distance 1 , i.e. pairs of nodes for which an edge has previously been fo rmed, becau se th ese edges m ay o r may not r e-occur in the f uture. I n the Faceboo k data set, we find that the majority (almost 80% ) of edges are formed at distance 1 , as shown in Fig. 1a. Add itionally Fig. 1 b shows th e empirical probability that an edge is form ed b etween two nodes as a function of geodesic distance. Notice that the edge probability is o ver 30 times higher at distance 1 compar ed to d istance 2 and over 300 times h igher th an at distance s 3 and above! Thus it does not m ake sense to pool over all node p airs when evaluating dynamic lin k prediction ac curacy (e .g. u sing A UC or PRA UC), beca use the overwhelming ma jority of positive in stances occur at distance 1 ! In the tradition al link p rediction pr oblem, Y ang et al. [1] suggested to evaluate link pr ediction ac curacy sep arately at each distance. Ho wever this is a cumberso me appr oach, so they pro posed also to use the PRA UC as a single measure o f accuracy over all distances. As we have discu ssed in Section III, PRA UC is prob lematic in the dynamic link pr ediction setting because it ignores th e ne gative class, so we canno t use the same approach as in [1]. I nstead, recogn izing th at most edges are f ormed between no de pairs with a previously observed edg e, we p ropose to separate the dy namic link prediction prob lem into two problems. V . S E PA R AT I O N I N T O T W O L I N K P R E D I C T I O N P RO B L E M S Part of the difficulty in ev aluatin g accuracy in the dyn amic link prediction setting is related to th e problem itself. Dynamic link prediction com bines two prob lems: prediction of new links (distance ≥ 2 ) and prediction o f pr eviously o bserved links (distance = 1 ). These two problem s h av e very different proper ties in terms of difficulty , which pr imarily relates to th e lev el of class imb alance in the two p roblems. The difference in difficulties o f the two p roblems can b e seen in T able II. Notice th at the probability of a n ew edge being formed is tiny compar ed to a pr eviously observed edge ! Thus the new link pr ediction problem inv olves mu ch more severe class imbalance (i.e. difficulty) compared to the previously observed link prediction prob lem. By pooling together all node pairs when c alculating A UC or PRA UC, the evaluation is heavily biased tow ard s th e pr eviously observed link prediction problem . As a result, all of the metrics shown in T able I are biased in this manne r . Instead, no de pair s cor respond ing to p ossible new ed ges should be separated f rom node pairs correspo nding to possible re-occurrin g ed ges, and acc uracy metrics should be computed separately . A. Pr ediction of New Edges W e begin b y con sidering the pred iction of n ew edg es that h av e not been observed at any previous time. Actu ally this is simply th e tradition al lin k pred iction p roblem, and the recomm endation s in [1] apply here as well. The ma in recommen dation is to use PR curves r ather than R OC curves due to the ab und ance of true negatives a s indicated by the extreme class imbalance shown in T able I I. By using PR curves, the overwhelm ing num ber of tru e negatives generated by link prediction algorithms are excluded from the e valuation. TS-Adj is capable o nly of predictin g previously observed edges, as d iscussed in Section II-C. T hus its p rediction s for new links are ra ndom g uesses, so it achieves the ran dom b ase- line A UC of 0 . 5 and PRA UC of P P + N . The similarity-based methods TS-AA and TS-Katz are extension s of the Ad amic- Adar and Katz pr edictors f or traditiona l link p rediction, an d T ABLE IV M E T R I C S F O R N E W A N D P R E V I O U S LY O B S E RV E D L I N K P R E D I C T I O N (a) NIPS data Method Ne w L ink Prev . Observed A UC PRA UC × 10 − 3 A UC PRA UC TS-Adj [6 ] 0.500 0.033 0.855 0.099 TS-AA [7] 0.534 0.882 0.646 0.057 TS-Katz [8] 0.535 0.735 0.694 0.049 SBTM [9] 0.531 0.055 0.713 0.066 (b) Fac ebook data Method Ne w L ink Prev . Observed A UC PRA UC × 10 − 3 A UC PRA UC TS-Adj [6 ] 0.500 1.19 0.705 0.417 TS-AA [7] 0.712 14.4 0.560 0.293 TS-Katz [8] 0.768 14.8 0.579 0.297 SBTM [9] 0.700 4.41 0.649 0.326 hence, they should b e expected to pe rform better than the SBTM f or n ew link prediction , especially because the SBTM does not consider geodesic distance. W e see fro m T able IV that this is indee d the case in both data sets , although th e difference is much more pr onou nced in terms of PRA UC. Thus we supp ort the recomm endation in [1] to u se PRA UC to ev aluate accuracy o f new link pred iction. B. Pr ediction of Pr eviou sly Ob served Edges The seco nd problem in d ynamic link predictio n inv olves predicting edg es that are currently pre sent o r wer e present at a pr evious tim e. As shown in T able II, the class imbalance is several order s of magnitud e less sever e th an in the case o f predicting new edge s. Another major difference from new link pr ediction is th e r elevance of ne ga tives (non -edges) . Accura te predictio n of negativ e s is highly r elevant becau se th e r emoval of edges over time contributes a significan t portion of th e network dyn amics. For example, in the NIPS co-auth orship network, we find that over 85% of ed ges o bserved at a ny time step are d eleted at the following time step. A goo d ev alu ation metric for the task of p redicting pre- viously observed links must pr ovide a balanced ev aluatio n between the positive and negative classes. The metrics based on th e PR curve are biased towards the p ositiv e c lass. W e hence pr opose to use A UC, which is based on the R OC c urve and d oes account fo r negati ves. Many of the shortco mings of A UC pointed o ut b y Y ang et al. [1] fo r th e new link prediction task are n ot present in th e previously observed link pr ediction task because the class imbalance is not nearly as significant. From th e A UC and PRA UC values f or previously observed link prediction in T ab le IV, TS-Ad j is th e m ost accurate accordin g to both metric s on both d ata sets. This is not sur- prising bec ause TS-Adj can o nly predic t previously observed edges. Howev er A UC and PRA UC do n ot n ecessarily agr ee in gen eral; fo r example, con sider TS-AA and TS-Katz on th e NIPS data. TS-AA has high er PRA UC but lo wer A UC, an d the 0 0.2 0.4 0.6 0.8 1 False positive rate 0 0.2 0.4 0.6 0.8 1 True positive rate TS-AA TS-Katz (a) ROC curve 0 0.2 0.4 0.6 0.8 1 Recall 0 0.1 0.2 0.3 0.4 Precision TS-AA TS-Katz (b) PR curve Fig. 2. Comparison of (a) ROC and (b) PR curves for previou sly observed link prediction on NIPS data. TS-AA performs bett er at low recall (TPR) and worse at high recal l, resulting in lo wer A UC but higher PRA UC. 0 0.5 1 1.5 2 2.5 3 3.5 TS-AA score rank × 10 4 0 2 4 6 8 TS-AA score (a) T S-AA 0 0.5 1 1.5 2 2.5 3 3.5 TS-Katz score rank × 10 4 0 0.01 0.02 0.03 TS-Katz score (b) TS-Katz Fig. 3. Link prediction scores of (a) TS -AA and (b) T S-Katz sorted in descendi ng order (blue line s) corresponding to all node pairs for w hich an edge was pre viously observ ed. Red verti cal lines denote node pairs that form an edge at the followi ng time step. T S-AA correct ly predicts m ore edges at high scores but misses many edges at lo w scores compared to TS-Katz. reason for this can be seen in the R OC and PR curves shown in Fig. 2 . Fig. 2 can be furth er explained using Fig. 3, where the sor ted link pr ediction scores for TS-AA and TS-Ka tz are plotted with edges overlaid. T S-AA is mor e ac curate than TS- Katz at h igh scores but worse at low scores, missing m any edges. This leads to higher precision and lower FPR for low values of recall (T PR) but lower pre cision an d h igher FPR for hig h values of recall, which pro duces the d isagreement between A UC and PRA UC. Since the PR curve is only focused on accur ate pr ediction of po siti ves, T S-AA is rewarded fo r being more accur ate at high scores (higher p recision) and is less harshly penalized for missing edges at low scor es. Thus we believe A UC to be a more balance d metr ic f or ev aluating accuracy o f previously o bserved lin k prediction. V I . A U N I FI E D E V A L U A T I O N M E T R I C By sep arating the d ynamic lin k prediction p roblem into two problem s with sep arate ev aluatio n metrics, we are able to fairly evaluate different methods for dynam ic lin k pred iction. Howe ver one o ften desires a single metr ic to c apture the “overall” acc uracy rather than two metr ics, an alogou s to the role of F1-score combin ing precision and recall. In the dyn amic lin k prediction setting, any such metric should cap ture both th e pr edictive po wer in new link an d previously o bserved lin k pred iction. In Sec tion V, we con - cluded th at PRA UC is the better ev aluation m etric fo r n ew link pre diction a nd that A UC is the better ev alu ation metric for previously observed link prediction . A unified evaluation metric could thus consist of the mean of th e two quan tities. Notice, however , from T able IV that the two qu antities have very large differences in m agnitude, despite b oth being in th e same r ange [0 , 1] . Thus the arithmetic mean is in appro priate because it would be domina ted by th e A UC v alue for pre- viously observed link pred iction. The harm onic mean is also inappro priate b ecause it would be dom inated by the PRA UC for new link predictio n, wh ich has a much larger rec iprocal. W e recom mend instead to use the geometric mea n of the two quantities after a baselin e correctio n, wh ich we d enote by GMA UC = v u u t PRA UC new − P P + N 1 − P P + N · 2( A UC prev − 0 . 5) , where P and N deno te the number of actual edges and n on- edges over the set of n ode p airs conside red f or n ew link prediction . The baseline corre ction sub tracts the PRA UC an d A UC values that w o uld be obtained b y a random p redictor . The use of th e geometr ic mean is motiv ated by the GMean metric propo sed by Kubat et al. [20] for e valuating classification accuracy in highly imbalanced data sets. The g eometric mean has sev e ral nice p roper ties in this setting: • I t is based o n threshold curves a nd avoids th e pitfalls of fixed-threshold metrics as discu ssed in [1]. • I t acco unts for the d ifferent scales of the PRA UC for n ew edges and A UC for p reviously o bserved edg es without being dominated by either quantity . • I t is 0 for any p redictor that can only predict new edges or can only predict previously observed ed ges. The final poin t ad dresses an observation fro m se veral pr evi- ous p apers [4], [5], [10] o n generative models for d ynamic networks: ba seline methods (e.g . TS-Ad j) that pred ict only previous obser ved edg es ten d to pe rform quite c ompetitively in terms of A UC when ev aluated on the entire network. The GMA UC for a baseline predicto r of this sort would be 0 due to its inability to predict any n ew edges at all. The ac curacies of several d ynamic link predicto rs using the ev aluation metrics p ropo sed in this pap er are shown in T able V. Ac cording to the propo sed GMA UC metric, TS-Katz is the best predicto r fo r both data sets d ue to its ab ility to accurate ly predict both previously ob served and new edges. Notice that, for the NIPS d ata, TS- Katz has the highest GMA UC d espite T ABLE V E V A L U AT I O N M E T R I C S F O R N E W A N D P R E V I O U S LY O B S E RV E D L I N K P R E D I C T I O N A N D P RO P O S E D G M AU C M E T R I C F O R U N I FI E D E VAL U ATI O N (a) NIPS data Method PRA UC × 10 − 3 (ne w) A UC (pre v .) GMA UC TS-Adj [6 ] 0.033 0.855 0 TS-AA [7] 0.882 0.646 0.016 TS-Katz [8] 0.735 0.694 0.017 SBTM [9] 0.055 0.713 0.003 (b) Fac ebook data Method PRA UC × 10 − 3 (ne w) A UC (pre v .) GMA UC TS-Adj [6 ] 1.19 0.705 0 TS-AA [7] 14.4 0.560 0.040 TS-Katz [8] 14.8 0.579 0.047 SBTM [9] 4. 41 0.649 0.031 not being the most accur ate in either task. This is due to the balanced ev alu ation of new and p reviously observed link prediction used in the propo sed GMA UC metric. The d ata set u sed to comp ute the metrics shown in T able I is actually th e same Faceboo k data used in T ab le Vb. N otice that the least accurate m ethod according to all th ree metrics in T able I, TS-AA, actually be comes the second most ac curate once the e valuation is properly split up into new a nd previously observed links. This is primarily due to its strength in n ew link prediction comp ared to the SBTM, w hich does no t co nsider geodesic distance fo r new link prediction, and to TS-Ad j, which does not consider new edg es at all. V I I . C O N C L U S I O N S In this pape r , we tho rough ly examined the prob lem of ev aluating accura cy in the dynamic lin k pred iction setting where edges are both added an d r emoved over tim e. W e find that the overwhelming majo rity of ed ges f ormed at any giv en time ar e ed ges that ha ve previously been ob served. These edges sho uld be evaluated separately from new edges, i.e. ed ges that ha ve no t for med in the past between a p air of nod es. Th e new and pre vio usly obser ved link pre diction problem s have very different levels of difficulty , with new link prediction being orders of magn itude mor e difficult. Non e of the cu rr ently used metrics for dynamic link prediction perform this separation and are thus dom inated b y the accu racy on the easier prob lem of pre dicting pr eviously observed ed ges. Our main recommen dations are as follows: 1) Sep arate node pairs f or which edges h av e previously been observed from the remaining node pairs, and evalu- ate link prediction acc uracy on the se two sets separately . 2) For node pairs witho ut pr evious e dges, i.e. the new link prediction prob lem, evaluate p rediction accuracy u sing PRA UC d ue to the tremendou s class imbalanc e. 3) For node pairs with previous edg es, evaluate prediction accuracy using A UC due to the im portan ce of predic ting negativ e s (non -edges). 4) I f a sing le metric of accuracy is desired, ev alu ate new and previously ob served link pr ediction using separate metrics the n combin e the m etrics rathe r than compu ting a single metric over a ll node pairs. 5) Use the prop osed GMA UC metric a s the single accuracy metric to p rovide a balanced evaluation b etween new an d previously observed link prediction. R E F E R E N C E S [1] Y . Y ang, R. N. Lichtenw alter , and N. V . Chawla , “ E va luating l ink predict ion methods, ” Knowl. Inform. Sys. , vol. 45, no. 3, pp. 751–782, 2015. [2] D. Liben-No well and J. Kleinber g, “The link-pred ictio n problem for social networks, ” J. Am. Soc. Inform. Sci. T ech. , vol. 58, no. 7, pp. 1019–1031, 2007. [3] M. Al Hasan and M. J. Zaki, “A survey of link prediction in social netw orks, ” in Socia l network data analytics . Springe r, 2011, pp. 243– 275. [4] K. S. Xu and A. O. Hero III, “Dynamic stochast ic blockmodels for time-e volvin g social netw orks, ” IEE E J . Sel. T op. Signal Proc ess. , vol. 8, no. 4, pp. 552–562, 2014. [5] J. R. Foulds, C. DuBois, A. U. Asuncion , C. T . Butts, and P . Smyth, “A dynamic relationa l infinite feature model for longitu dinal social netw orks, ” in Pr oc. 14th Int. Conf . A rtif . Intell. Stat. , 2011, pp. 287– 295. [6] C. Cortes, D. Pregibon, and C. V olinsky , “Computation al methods for dynamic graphs, ” J. Comput. Graph. Stat. , vol. 12, no. 4, pp. 950–970, 2003. [7] ˙ I. G ¨ unes ¸ , S ¸ . G ¨ und ¨ uz- ¨ O ˘ g ¨ ud ¨ uc ¨ u, and Z. C ¸ ataltep e, “Link predicti on using time series of neighborhood-based node similarity scores, ” Data Min. Knowl . Discov . , vol. 30, no. 1, pp. 147–180, 2016. [8] Z. Huan g and D. K. J. Lin, “The ti m e-series link predic tion problem with applic ations in communication surveill ance, ” IN FORMS J. Comput. , vol. 21, no. 2, pp. 286–303, 2009. [9] K. S. Xu, “Stochast ic block transition models for dynamic netwo rks, ” in P r oc. 18th Int. Conf. Artif. Intell. Stat. , 2015, pp. 1079–1087 . [10] M. Kim and J. Leskov ec, “Nonparamet ric multi-group membership model for dynamic netwo rks, ” in Adv . Neural Inform. Pr ocess. Sys. 25 , 2013, pp. 1385–1393. [11] C. Heaukulani a nd Z. Gh ahramani , “Dynamic probabilisti c models for latent feature propag ation in social netwo rks, ” in Pr oc. 30th Int. Conf . Mach . Learn. , vol . 28, 2013, pp. 275–283. [12] A. Glo berson, G. Chechik, F . Perei ra, and N. Tishby , “Euclid ean embedding of co-occ urrence data, ” J. Mach. Learn. Res. , vol. 8, pp. 2265–2295, 2007. [13] B. V iswanath , A. Mislo ve, M. Cha, and K. P . Gum madi, “On the e volution of user interac tion in fac ebook, ” in Pr oc. 2nd ACM W orkshop Online Soc. Netw . , 2009, pp. 37–42. [14] D. M. Dunla vy , T . G. Kol da, and E. Acar , “T emporal link prediction us- ing matrix and tensor factor izati ons, ” ACM T rans. Knowl. Discov . Data , vol. 5, no. 2, p. 10, 2011. [15] K. S. Xu, M. Kliger , and A. O. Hero III, “A s hrinkage approac h to track- ing dynamic networks, ” in Proc. IEEE Stat. Signal Proce s s. W orkshop , 2011, pp. 517–520. [16] T . Y ang, Y . Chi, S. Zhu, Y . Gong, and R. Jin, “Detec ting communities and their ev olutions in dynamic social networ ks—a Bayesian approach, ” Mach . Learn. , vol . 82, no. 2, pp. 157–189, 2011. [17] T . T ylenda, R. Angelo v a, and S. Beda thur , “T ow ards time-a ware link predict ion in ev olving social networks, ” in Proc . 3rd W orkshop Soc. Netw . Min. A nal. , 2009, p. 9. [18] J. Davis and M. Goadrich, “The relationshi p between Precision-Rec all and R OC curves, ” in Pr oc. 23rd Int. Conf . Mach. Learn. , 2006, pp. 233–240. [19] T . Fa wcett, “An introduct ion to ROC analysi s, ” P attern Recog . Lett. , vol. 27, no. 8, pp. 861–874, 2006. [20] M. Kubat and S. Matwin, “ Addressing the curse of imbalanced training sets: one-sided selecti on, ” in Proc . 14th Int. Conf . Mach . Learn. , 1997, pp. 179–186.
Original Paper
Loading high-quality paper...
Comments & Academic Discussion
Loading comments...
Leave a Comment