Emotional Intensity analysis in Bipolar subjects
The massive availability of digital repositories of human thought opens radical novel way of studying the human mind. Natural language processing tools and computational models have evolved such that many mental conditions are predicted by analysing …
Authors: Facundo Carrillo, Natalia Mota, Mauro Copelli
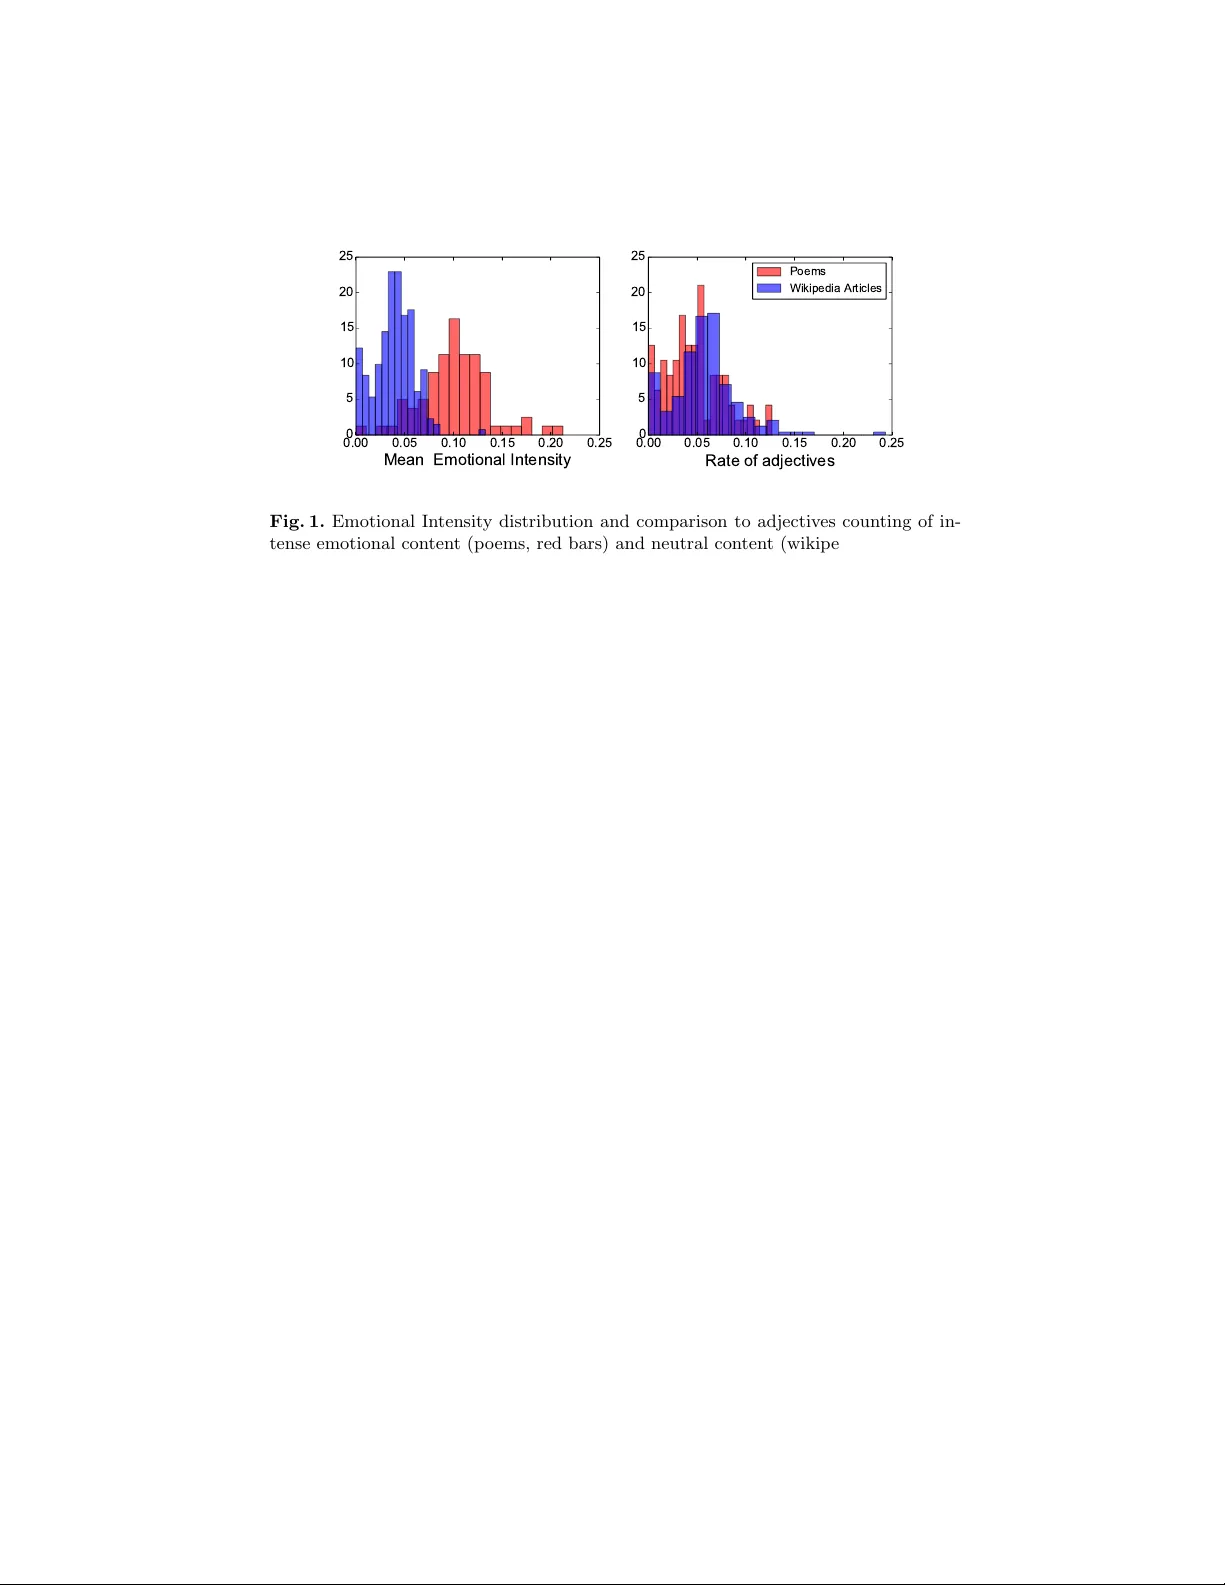
Emotional In tensit y analysis in Bip olar sub jects Carrillo, F acundo 1 , Mota, Natalia 2 , Cop elli, Mauro 3 , Rib eiro, Sidarta 2 , Sigman, Mariano 4 , Cecc hi, Guillermo 5 , and F ernandez Slezak, Diego 1 1 Lab oratorio de Inteligencia Artificial Aplicada, Departamento de Computaci´ on F acultad de Ciencias Exactas y Naturales, Univ ersidad de Buenos Aires, CABA, Argen tina 2 Instituto do C ´ erebro, Univ ersidade F ederal do Rio Grande do Norte, Natal, Brazil 3 Univ ersidade F ederal de P ernambuco, Recife, Brazil 4 Univ ersidad T orcuato Di T ella, CABA, Argen tina 5 T.J. W atson Researc h Cen ter, IBM, Y orktown Heights, NY, USA Abstract. The massiv e av ailabilit y of digital rep ositories of h uman thought op ens radical no vel wa y of studying the human mind. Natural language pro cessing tools and computational mo dels hav e evolv ed such that man y men tal conditions are predicted by analysing speech. T ranscription of in terviews and discourses are analyzed using syntactic, grammatical or sen timent analysis to infer the mental state. Here we set to inv estigate if classification of Bipolar and con trol sub jects is p ossible. W e develop the Emotion Intensit y Index based on the Dictionary of Affect, and find that sub jects categories are distinguishable. Using classical classification tec hniques we get more than 75% of labeling p erformance. These results sumed to previous studies show that curren t automated sp eec h analy- sis is capable of identifying altered men tal states to wards a quan titative psyc hiatry . 1 In tro duction Recen t adv ances in tec hnology allo w scien tists to examine the brain and the mind in differen t and radically no vel wa ys. The virtually infinite repository of h uman computation in digital format allows the exploration of pro cedures in high dimensional spaces previously intractable with data generated in the lab oratory . Psyc hology has historically used sp eec h and conv ersation with patien ts as windo w to the mind. In the last years many computational techniques brought to the psychiatric-psyc hological practice many new analyical to ols. Some men tal conditions are prognosticated extremely w ell using only computational models based on sp eech. In the w ork [1], the authors introduced a graphs model to c haracterize psychosis produced by sc hizophrenia and bipolar disorders. Authors sho wed how differences of top ology of sp eec h graphs may change dep ending on men tal condition of the patients. This technique, based on the structure of graphs, captures prop erties related to thought organization and allows using the mo del as a predictor of men tal disorders. Natural language processing of sp eec h has gotten to predict psycosis onset b etter than the psyc hiatry exp erts [2]. By analyzing coherence in sp eec h, authors are able to predict the first psyc hotic episode in high-risk patients, identifying whic h patients are going to dev elop schizophrenia with a p erformance of 100%. Moreo ver, computational mo dels may detect mental alterations caused by drugs ingest [3]. In [4], the authors ran an experiment where they ask the sub jects (20 con trol, 20 bip olars – 14 on mania and 6 on depression –, and 20 sc hizophrenic) to rep ort a recen t dream and report their waking activities immediately b efore that dream. Using these tw o different graphs they computed graph measures – as features of each sub ject’s sp eec h –, and built a classification mo del to predict the group lab el of each sub ject: Control, Bip olar or schizophrenic. Binary classification (Con trol vs Bip olar) using waking rep orts is close to c hance. In particular, the w orst classification was obtained for the maniac vs con trol comparison. Although the speech graphs are a great tool to characterize b et ween sc hizophre- nia and con trol or bipolar with dream and w aking reports, they do not seem use- ful to classify b etw een bip olar and con trol using waking rep orts, and the need to get a dream rep ort from a psychotic patient can b e really c hallenging. This ma y b e because the lack of evidence of grammatical alterations in bipolar sp eec h. Ho wev er, evidence sho ws that emotions change in sub jects with mania dis- order [5 – 7]. The result presen ted in [8] suggests, using fMRI, that abnormal mo dulation betw een ven tral prefrontal and limbic regions, especially the amyg- dala, are lik ely contribute to po or emotional regulation and mo od symptoms. W e hip othesize that this p o or emotional regulation and mo o d symptoms m ust b e detected in speech, and thus the identification of patien ts should b e p ossible analysing the emotional in tensity in speech. F or this, w e build a emo- tional in tensity index to study the differences b et w een control and maniac group using the same dataset of [4]. 2 Metho ds 2.1 Sub jects and in terviews F ort y sub jects participated in the study , 20 of them were diagnosed as Bip o- lar and another 20 acted as control. The diagnosis w as p erformed using the standard DSM IV ratings SCID [9]. The sub jects were patien ts of the Hospital Onofre Lop es (UFRN) and Hospital Machado, Natal, Brazil. All sub jects were in terviewed with the following tasks: Ple ase r ep ort a r e c ent dr e am and Ple ase r ep ort your waking activities imme diately b efor e that dr e am . Their discourse was recorded and a blind-conditioned exp erimen ter transcrib ed the recordings. All sub jects signed an informed consent for this study , which was approv ed by the UFRN Researc h Ethics Committee (p ermit #102/06-98244); F or this study , w e concatenated the sp eec h for both questions as a unique text. As texts were in P ortuguese, text were translated in to English using Go ogle T ranslate. 2.2 Emotional Intensit y Analysis algorithm In this w ork, w e presen ted a simple algorithm to measure the emotional in tensity in language. F or this w e used a list of words with high emotional v alue. T o define the emotional v alue we used the Dictionary of Affect in Language (English D AL) [10]. English DAL is to ol designed to measure the emotional meaning of w ords. In that work, the authors ran an exp eriment where ask p eople to rate some words in three categories: pleasantness, activ ation, and imagery . W e used as high emotional w ords, those where ple asantness where in the first 20% and in the last 20%. F rom this, we defined the emotional in tensity (EI) of a sentence as the rate of w ords in the sentences that are in high emotional list: E I ( s ) = P N i =0 ( dal + ( s i ) + dal − ( s i )) N where N is the num ber of w ords in sentence s and dal ± ( w ) returns 1 if w ord w b elongs to positive or negativ e affectiv e DAL w ord list. F or example, the sen tence: This is a b e autiful day has 5 words but just one b elongs to the high emotional list, so the emotional in tensity is 0 . 2. T o ev aluate a text, w e split it into sentences and calculate the EI for every one. Then as a summarized measure we rep ort the mean and the standar deviation of the serie. W e used scikit-learn [11], a Python mo dule for machine learning to perform all classifiers. The classifiers w ere initialized with the default parameters. 3 Results W e presen t a simple method to measure the emotional intensit y in text. T o test that emotional intensit y index (EI I) captures differences in emotional conten ts, w e defined tw o corpus: – Emotionally-neutral con tent: Wikipedia Articles. – Emotionally-in tense conten t: selection of Poems. F or the p oem corpus w e used 75 randomly selected texts from http://100. best- poems.net/ . F or the Wikip edia Articles corpus, we got 100 random Wikip edia articles 6 . F or each p o em and each Wikip edia article, we estimated the EI I (Figure 1A). The Wikip edia Articles presented low er mean EI I (0.0394 ± 0.0207) than do cumen ts in the p o em corpus (0.1017 ± 0.0363). Differences b et w een b oth distributions w ere highly significant (ttest, p ≤ 10 − 46 ). T o control we w ere not just coun ting the rate of adjectiv e in the text w e computed the part of speech (using NL TK [12]) and compare the distribution of both corpus. Figure 1 B shows this comparison, here the distribution are not 6 h ttps://en.wikip edia.org/wiki/Sp ecial:Random 0.00 0.05 0.10 0.15 0.20 0.25 Mean Emotional Intensity 0 5 10 15 20 25 0.00 0.05 0.10 0.15 0.20 0.25 Rate of adjectives 0 5 10 15 20 25 Poems Wikipedia Articles Fig. 1. Emotional In tensity distribution and comparison to adjectiv es counting of in- tense emotional con tent (p o ems, red bars) and neutral conten t (wikip edia, blue bars). significan tly distinct and presen ted a similar mean, for Wikipedia Articles corpus the adjective rate was 0 . 0574 ± 0 . 0342 and for the p oems corpus the mean and standard deviation w as 0 . 0473 ± 0 . 0300 The difference in the distribution using the emotional intensit y and the not c hange in adjective rate sho ws that the emotional in tensity algorithm are cap- turing the intensit y of the spee c h and not only the use of adjectives that are mostly the v ehicle of the mo dulation of the intensit y in language. In the in tro duction section w e presen ted the h yp othesis that w e could observe c hange in the emotional in tensity in maniac sub jects. F or this, w e build the algorithm and sho wed before that it has an exp ected behavior in other v alidation corpus. T o address the main goal of this work, we measured the EI in 20 con trol sub ject and in 20 maniac sub ject. F or each sub ject w e measured the EI for every sub ject and then we rep orted the mean and the standard deviation. Figure 2 sho ws the organization in 2D of the sub ject if we used the mean and the standard deviation as features. The mean EI for the control sub ject are t ypically low er than the mean EI for maniac sub jects, it presented a statistically difference (p v al=0.00793). The a v erage and standard deviation for the mean EI in control group w as 0.1168 ± 0.0277, and for maniac group was 0.1380 ± 0.0193. Comparing the distrubtion of EI of control sub jects and the previuos corpus w e didn’t find statistically difference b et ween po ems and control, they presen ted a very similar mean. Ho wev er when we compared the maniac EI and p oems we found that the first one not only had higher mean EI but they hav e presented statistically difference (pv al =4 . 211 − 05 ). This show ed that maniac has ev en a higher EI than the p oems dataset. T o analyze the emotional intensit y as predictor mo del we ran a Logistic Regression using the mean EI as unique feature and a 10 fold cross-v alidation sc hema. With that configuration w e obtained a p erformance of 75% where c hance w as 50%. W e compared this classifier to other classical metho ds (see T able 1), and Logistic Regression sho wed the best results. 0.06 0.08 0.10 0.12 0.14 0.16 0.18 Mean 0.06 0.08 0.10 0.12 0.14 0.16 0.18 Std Emotional Intensity Contol Maniac Fig. 2. 2D pro jection of sub jects using mean and standard deviation as features. T able 1. Camparison of classification metho ds for labeling Control and Bip olar pa- tien ts P erformance Ro c Auc F1 Classifier mean std mean std mean std LogisticRegression 0.7500 0.2738 0.7000 0.4153 0.6166 0.4349 LD A 0.6750 0.2968 0.7000 0.4153 0.6066 0.4103 SV C 0.6500 0.3000 0.7000 0.4153 0.5766 0.4060 GaussianNB 0.6500 0.3000 0.6750 0.4038 0.5766 0.4060 DecisionT reeClassifier 0.5500 0.2915 0.5250 0.2610 0.5533 0.3357 Gradien tBo ostingClassifier 0.5750 0.2750 0.6375 0.2589 0.5266 0.3362 BaggingClassifier 0.5750 0.1600 0.5875 0.2907 0.5066 0.2950 KNeigh b orsClassifier 0.5500 0.1500 0.5500 0.1500 0.4300 0.2956 RandomF orestClassifier 0.5000 0.2500 0.6000 0.3570 0.4833 0.2833 4 Discussion Affectiv e Computing has longly been trying to recognize and in terpret human affect using computational techniques [13]. These tecniques hav e ev olved to Sen- timen t Analysis, where natural language processing tools – combined with com- putational liguistics and classification methods – reco ver sub jective con tent from text [14]. Most applications are used to lab el, tag and analyze reviews and so cial media data. These studies tipically use an emotion taxonom y , and try to quan tify eac h emotion category , for example the six emotion prop osed by Ekman [15]. W e set to inv estigate if symptoms in Bipolar patien ts are identifiable in sp eech inferring the emotional intensit y in their discourse. W e do not use a pre-defined emotion taxonomy and quantify eac h emotional axis. Instead, we prop ose a sim- pler approach where w e just wan t to identify in tense emotional conten t (in any category of emotion) and explore distributional differences in discourse from Con trol and Bip olar sub jects. F or this purp ose, w e rely on DAL [10]. Our results sho wed that differences in emotional intensit y may b e detected us- ing this simple method for different corpus of data. Ho w ever, this simple method is capturing more than just counting w ords, as counting adjectiv es did not sep- arate b et w een groups. The application of this index w as able to classify betw een con trol and bipolar sub jects with a fair p erformance. These results complemen t to previous studies where natural language pro cessing to ols are used to classify b et ween sc hizophre- nia and con trol patient [2, 4], to wards quan titative psychiatry . Ac kno wledgments This researc h w as supp orted by Universit y of Buenos Aires, CONICET (Ar- gen tina) and ANPCyT (Argen tina). MS is sp onsored b y James McDonnell F oun- dation 21st Cen tury Science Initiative in Understanding Human Cognition. DFS is sponsored by Microsoft F aculty F ello wship. This researc h is partly funded b y the STIC-AmSud program partners MINCyT (Argentina), Inria (F rance), CAPES (Brasil) and ANI I (Urugua y), through the COMPLEX pro ject. References 1. N.B. Mota, N.A.P . V asconcelos, N. Lemos, A.C. Pieretti, O. Kinouchi, G.A. Cec- c hi, M. Cop elli, and S. Rib eiro. Sp eec h graphs pro vide a quantitativ e measure of though t disorder in psyc hosis. PloS one , 7(4):e34928, 2012. 2. Gillinder Bedi, F acundo Carrillo, Guillermo A Cecchi, Diego F ern´ andez Slezak, Mariano Sigman, Nat´ alia B Mota, Sidarta Rib eiro, Daniel C Ja vitt, Mauro Cop elli, and Cheryl M Corcoran. Automated analysis of free speech predicts psychosis onset in high-risk y ouths. npj Schizophr enia , 1, 2015. 3. Gillinder Bedi, Guillermo A Cecchi, Diego F Slezak, F acundo Carrillo, Mariano Sigman, and Harriet de Wit. A windo w into the in toxicated mind? sp eech as an index of psyc hoactive drug effects. Neur opsychopharmac olo gy , 2014. 4. Nat´ alia B Mota, Raimundo F urtado, Pedro PC Maia, Mauro Copelli, and Sidarta Rib eiro. Graph analysis of dream rep orts is especially informative ab out psyc hosis. Scientific r ep orts , 4, 2014. 5. SR Platman, R Plutc hik, RR Fiev e, and W G La wlor. Emotion profiles asso ciated with mania and depression. Ar chives of gener al Psychiatry , 20(2):210–214, 1969. 6. Sheri L Johnson, June Gruber, and Lori R Eisner. Emotion and bip olar disorder. 2007. 7. June Grub er, Sheri L Johnson, Christopher Oveis, and Dacher Keltner. Risk for mania and p ositiv e emotional resp onding: to o muc h of a go od thing? Emotion , 8(1):23, 2008. 8. Stephen M Strako wski, Caleb M Adler, Jorge Almeida, Lori L Altshuler, Hilary P Blum b erg, Kiki D Chang, Melissa P DelBello, Sophia F rangou, Andrew McIn- tosh, Mary L Phillips, et al. The functional neuroanatomy of bip olar disorder: a consensus mo del. Bip olar disor ders , 14(4):313–325, 2012. 9. Mic hael B First, Rob ert L Spitzer, Miriam Gibbon, and Janet BW Williams. Struc- tur e d Clinic al Interview for DSM-IV R Axis I Disor ders (SCID-I), Clinician V er- sion, A dministr ation Bo oklet . American Psychiatric Pub, 2012. 10. Cyn thia Whissell. The dictionary of affect in language. Emotion: The ory, r ese ar ch, and exp erienc e , 4(113-131):94, 1989. 11. F abian P edregosa, Ga¨ el V aroquaux, Alexandre Gramfort, Vincent Mic hel, Bertrand Thirion, Olivier Grisel, Mathieu Blondel, Peter Prettenhofer, Ron W eiss, Vincen t Dubourg, et al. Scikit-learn: Mac hine learning in python. The Journal of Machine L e arning R ese arch , 12:2825–2830, 2011. 12. E. Lop er and S. Bird. NL TK: The natural language to olkit. In Pr o c e e dings of the ACL-02 Workshop on Effective to ols and metho dolo gies for te aching natur al lan- guage pr o cessing and c omputational linguistics-V olume 1 , pages 63–70. Association for Computational Linguistics, 2002. 13. Rosalind W Picard. Affective computing. T echnical rep ort, MIT, 1995. 14. Bo P ang and Lillian Lee. Opinion mining and sentimen t analysis. F oundations and tr ends in information r etrieval , 2(1-2):1–135, 2008. 15. P aul Ekman. F acial expression and emotion. Americ an psycholo gist , 48(4):384, 1993.
Original Paper
Loading high-quality paper...
Comments & Academic Discussion
Loading comments...
Leave a Comment