Predicting Performance Under Stressful Conditions Using Galvanic Skin Response
The rapid growth of the availability of wearable biosensors has created the opportunity for using biological signals to measure worker performance. An important question is how to use such signals to not just measure, but actually predict worker perf…
Authors: Carter Mundell, Juan Pablo Vielma, Tauhid Zaman
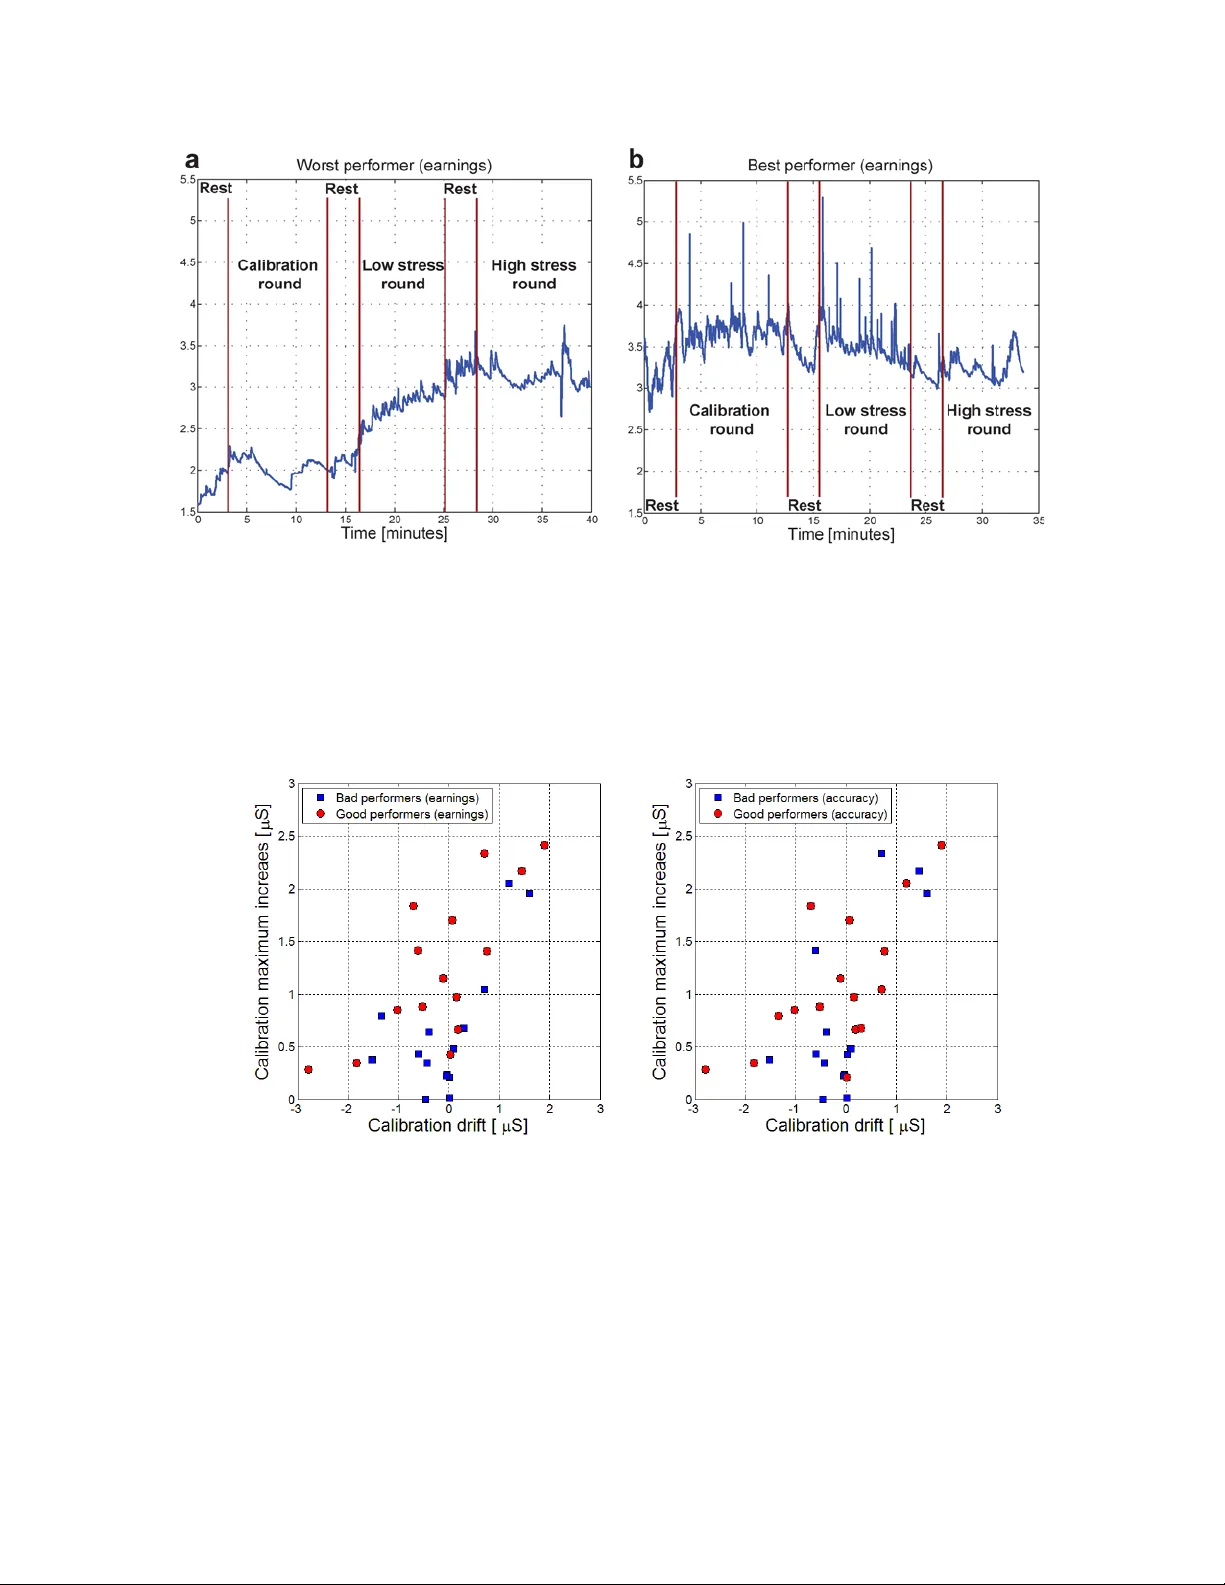
1 Pred icting Per for mance Und er Str essfu l Cond itions Using Galv anic Skin R espons e Carter M undel l, J uan Pab lo V ielma, and Tauh id Zaman * Sl oan School of Man agem ent , Massac hus etts I nstit ute of Technol ogy, C ambri dge, MA 0 2139 USA. *To whom co rresponde nce s hould be address ed. E - mail : zlisto @mit.ed u The rapid grow th of the avail abilit y of w earable biosensors has created the oppo rtunity for using biologica l signals to measu re worker p erforma nce. An important qu estio n is how to use such signal s to not just measu re, but ac tually pr ed ict w orker p erf orm ance on a task under stressful and potentiall y high risk c onditio ns. Here w e sho w that the biological sig nal known as gal vanic skin respo nse (GS R) allo ws such a predic tion. We co nduct an experiment w here subj ects answer arithmet ic questio ns under low and hi gh stress co nditions w hile having their GSR mo nitored using a w earable bio sensor . Using onl y the GSR measured unde r low str ess co ndition s , w e are able to predic t whic h subjects w i ll perform w ell under high stress co ndition s , ac hieving an area under the curve (A UC) of 0.76. If w e try to make si milar predic tions with out using any b iometric sig nals, the AUC barely excee ds 0.50 . Our result sugg ests that p erformance in hig h stress c onditions c an be predicted usi ng signals ob tained from w earable bio sensors in low stress conditio ns . For ma ny j obs , it is difficult to te st a wo rke r’s per for man ce u nd er real - life conditions eith er becau se it is prohibitively e xpens ive or bec ause th e stak es are to o high to ris k an e rror. For instance , it ca n be diff icult to simu late the a ctual pr essur e and risk faced by a financ ial trader on a trading floor. The true ris k of an a ccident is har d to recr eate fo r air line pil ots or truck drivers . A s oldier can only experienc e the real ity o f co mbat o n th e battl efiel d. In each of t hese exam ples, t he w ork er ’s performance is eva luated using some s ort of te sting in a sim ulation or a no ther low stres s e nviro nment. For i nstanc e, a irline pilots a nd soldiers are ofte n tes ted in co mp uter - generate d simulations (Bymer 20 12) (Chang 2013) . Th e perf orm ance o f a work er in a simulator or in an oth er low str es s environment may not be a goo d predictor of hi s performance in a high stre ss situation be cause it is not obvious how he will res pond to the additi onal stres s. So me wor kers m ay thri ve in h igh str ess envi ron ment s, wh ile oth ers m ay suffer a lar ge degr adati on i n their perf orman ce. In th is pap er, show tha t biometric data, in part icular galva nic sk in response (GSR), ca n be used to p red ict p erfo rman ce u nder stres s a nd po te ntially enh ance conventional tes ting methods . Th e rel atio nship bet ween st ress and p erfo rmance w as fir st char acter ized by th e fam ou s Yer kes Do dso n cu rve (Yerk es 1908) whi ch posits th at per for manc e is max imiz ed at a c ertai n level of stres s and d ecr eases as the stres s exc eeds this optima l le ve l. Oth er stu dies h ave fo un d that this relationship holds for a varie ty of task s and typ es of st re ss (Ariely 2009, An ders on 1994, S. L. Bei lock 200 7) . Diff erent th eori es have been pro po sed to try an d expl ain th is rel ationsh ip. On e theor y is that adde d str ess cau ses a shift from automatic t o c ontrolled me ntal proces se s, re sulting in d ecreased perf or m ance (Lange r 1979) , (Ba umeis te r 1984) , (C ame rer 2005) , (Da ndy 2001) . Ano ther t heory i s that the ad ded stress c onsu mes m ental resou rces 2 and interrup t s pr ocedu ral ized rou tines (S . L. Beilock 2007) . Wh ile t hese th eor ies provide differe nt explana tions for the impact of stres s on perform a nce, one criticism is that thes e theor ies are not p redictive because t he o ptim al stress l evel var ies by task an d per son an d als o it ca n be difficult to q uantifiab ly meas ure s tress ( Ne iss 1988) . On e pro po sed way t o m easure st ress inv ol ve s using what is k nown as galvanic skin resp on se (GS R) , wh ich is the electrical c onducta nce of the s kin and de pends on p re - se cretory activity in the sweat glands ( Lader 1962) . GSR w as fir st shown to be co rrel ated wi th str ess in (Jung 1 908) and ma ny studies since have supported this relationship (B oucse in 2012, Pic ard 19 97) . T he recent ubiquity of w earable bio senso rs such as sma rt wa tches a nd wris tbands ha s ma de GSR da ta much easier to co lle ct and has fac ili tated a new bo dy o f experim ental resear ch w hic h uses GS R fo r str ess det ec tio n . It has been shown to be effective for distinguishing varying deg rees of stress in bo th lab studies (Zha i 2 005) a nd real - life se ttings, s uch as highway a nd city driv ing (Heal ey 20 05) . Ex perimen ts have al so sh ow n that GS R can be us ed to infer the diff iculty or cognitive load a ss ociated with a task ( Setz 2010) , (Nou rb a khs h 2012) . Wh ile t he larg e b ody of w ork on GS R h as sho wn that it is c orr elat ed with stress an d task dif ficulty , w h a t has not be en es tab lished is the a bility of GSR to predict the per for manc e o f a w or ker un der stress fu l c onditions . Bein g able to p re di ct performance under s tress using GSR would make it an incredib ly useful signal for a host of a pplications , such as t esting and eval uat ing wo rker s . Here w e sh ow th at GSR measu red while perf ormi ng a ta sk under l ow stre ss is actu all y pre dic tive of per for manc e o f th e same t ask u nd er high str ess . That is, by te sting a pe rson unde r a low stress condition, we can predict how we ll th e y will perfor m when there is in creased str ess . Expe rimenta l setup W e co n duct ed a mu lt i - st a ge exp er ime nt w i t h var yin g d egrees o f str ess , but unif or m task d iff icu lt y t o st udy the re l at i onship b et ween GS R an d per f o rmance . We recru i ted 30 unde rgraduat e studen t s as subj ect s f or t he e xp er ime nt . T h e subjects were t ol d t hey wou l d be part i cipat in g in a stud y of m at h emat ical abi l i t y a nd st ress. Each subject was fi t ted w it h a NEULOG GSR finger se nso r o n t he ind ex a nd mid d le fin ge r s o n t he i r no n - do mina nt ha nd . The G SR si gnal was capt ured through out the wh o l e ex per i men t at a 5 Hz sa mp lin g r at e . T he s u bj ect was fir st asked t o r e lax f o r t h ree min ut e s . A f te r th is rest p e r io d t he y beg a n t hr e e d ist inct ro unds of a c o mputer - bas ed ar i t hmet i c g a me co n s ist ing o f a ser i es o f t hr ee d ig it by two di g i t mu lt i p l i cat ion quest i o n s . Bet ween each ro un d t h e subj ect was gi v en a t hree minu t e r est peri o d. Fig u r e 1 show s a screensho t o f t he game, t h e fi nger senso r used f o r t h e experiment an d a d i agra m depict in g the seque nce o f stages in t he e xpe r ime nt . T he fir st ro und o f t he ga me wa s fo r c a libr at io n a nd designed t o be min ima l ly s t re ss fu l i n o rder to ev aluat e t he su bject s’ ba se l ine per f o r m ance and GSR re spo n se t o t he a r it h me t ic questi ons. Subj ect s answered mu lt i p l ic a t io n questi o ns fo r t en min ut e s . T he y d id no t 3 rece iv e a n y feed back o n w h et h er o r no t t h eir answer s were co rrec t a nd t here was no t ime limi t fo r an swer ing ind ivid u a l quest i ons . Du r ing thi s round, subj ect s were inc e nt iviz e d w it h a s ma l l fin a ncia l r e war d o f $0. 25 f o r each co r rect re spo nse . D ur ing t he rest period f o ll o wing the calibrat i o n ro und, the subjects ’ ave rage re spo nse t ime was calculat ed an d used in the foll ow i ng two rounds f o r the i n ce n tive scheme described bel ow. The s econd an d third rounds of the g a me we re t he lo w an d hi g h stress r o un ds. Both of t h ese ro unds consisted o f 2 0 mu lt ip l ic a t io n quest i on s. Subj ects were giv en 130% o f t hei r average an swer t im e f r o m the cal i brat i o n ro und to answer each quest i o n i n t h ese ro un ds . They were inst ruct ed that a p o r t i o n of the t im e allo wed was “ bonus” tim e, durin g which co r rect an swers were wort h $1 in stead of $0. 25. In the l o w s tr es s r o un d, 85% o f the questi on t ime a l lo w e d was bonus t i me , whereas d urin g t h e hi gh stress ro un d only 50% of t h e t i me was bonus t im e. T h e se percent ages were ch ose n s uc h t h at achieving t h e bo n us pa yo u t in t he lo w st r ess ro und wa s o nly s lig ht ly cha l le ng ing , whereas in t h e hi g h str ess ro und i t was very difficu l t . T he t ime re ma in in g f o r each quest ion was v is ib le t o t he subject s on t h e ga m e scree n a s a ba r t ha t reduced in size e v er y seco n d , w it h bo nu s a nd nor m al t i me represe n t ed by gree n and red shad in g respect i vely , a s s ho wn in Fi gure 1. S ub jec t s w er e a ler t ed whe n t he y ra n o ut o f bo nu s t ime by a n u np lea sa nt buz ze r s o und . Du r ing t hese t wo str ess ro un ds, subject s were al so g ive n feed ba c k ind ic at ing w het he r t he answer t hey s ub m i tte d for each quest ion was corr e ct . Ex p lo ra t o ry Data Analysis and F eature Engine er ing Two different pe rf o rm ance m e t r ic s c a n be de ve lo p ed fr o m ou r exp er ime nt : accurac y on t h e 20 ques t i o ns aske d in ea c h r o und an d m o net ary earning s in e ac h r o und . In o u r ana l ys is , we f o cus on the earnings metr i c as the depende nt vari a bl e o f in t erest because earnings is likely to b e more sens i t ive than a ccur acy t o t h e impact o f st ress on t h e subj ect ’s per f o rm ance . I n ou r Su pplem entar y Mat erial s, w e incl ud e anal ysi s s howing th at th e accur acy is n ot w ell pred icted by e ith er per form ance featu res o r GS R featu res. The ea r ni ngs depend upon how f as t the s ubjec t an swers the in div i dua l questi ons a n d h ow m any ques t i ons are an swere d correct l y, whereas t he accuracy j ust depen ds upo n the nu mb er o f q uesti o ns answered c orrect ly . If a sub j ect i s impact ed by t h e st ress n egat iv e ly , t his wi ll h ave a larg er i m pact on t h e i r ear nings (w hich is se n sit i ve t o speed) t han accu racy (whic h can re ma in h ig h ev en if t he su b jec t slo ws do w n). I f we believe t h at GSR is re lated so mehow to the st ress of the subject , and th at t he str ess i s impact in g perfor m a n ce, t h en we would ex pect the good and b ad perfor mi ng subject s to be m or e easil y d is t inguished in ear nin gs t han in ac curac y . T he s imp le st h y po t hes is is t ha t s ub jec t s w ho pe rfo r m we ll in t he ca l ibra t i o n a nd lo w st ress ro unds w ill also per f o r m w el l in t he hig h st r ess ro und. I f t hi s is t he cas e, t hen pe rf orm an ce f eat ures f ro m t he calibrat i o n an d l ow s t r ess ro u nd s sh oul d be highl y co r re l ated w it h e ar n ing s in t he hig h st r e ss r o u nd . However, we fi nd t hat th es e f eat ure s are no t h ig h l y c o r r e la t e d w it h p erfor m ance i n the hig h er st ress rounds. We plot in Fi gure 2 each subject ’s perfor m ance metr i c s , bot h accur acy and earn i ng s, in calibrat i o n an d lo w st ress ro unds ver sus ea rn ing s in t he hig h str ess ro und. There is n o c l ear ly vis ib le r e la t io n s h i p bet w ee n t he pe r f o r m a nc e me t r ic s across ro un ds . This i s f urt h er suppo r t ed by t h e corr el at i o n coe ff icient of these met r ics, w hic h are n ot st a ti st i cally s i gnifi ca n t at the 4 five percent l e vel fo r e ach per f o rmance m et ric ( see Su pplem entar y Mater ials fo r de t ails ) . T his su gg est s t h at to pred i ct per f o rma n ce under high str ess condit i o ns, we w il l lik ely need m o re inf o r m at ion t han s im ply per f or m ance i n l o wer st ress co n diti o ns . T h is a lso supports o ur specu l at i o n that s imu lat i o n a nd t est ing methods designed to me a su r e a candidat e’s abili t y i n l o wer st ress condi t i ons ar e not necessar ily go o d in dicat ors of rea l - wor l d per f orm ance by themselves . We ne xt lo o k at t he p r ed i ct ive po w er of t he G S R s ig na l w e measure d f o r each sub j ect . Figure 3 s h o ws the tr aj ect o ry of t he raw GSR s ig n a l o ve r the co u r se o f t he e xp er i me nt fo r t w o subj ects, who in t hi s cas e are t he hi g hest and l o we st ea rne rs in t he h ig h str ess ro und . In t h e fi gure, e ac h r o u nd of the trial is s ep arat ed by a s h o rt rest p e r io d , dem ar cated wi t h red lines, and eac h ro un d an d rest peri od o f t he e xp er ime nt is la bele d . T h e G S R s ig na l i s mea su r ed in micr o s ie me ns ( µ S ) whi c h is a uni t of conduct ance. The figure s ho w s t hat th e GS R s i gnal c an ex h i b i t a variet y o f be h av i o rs, such as upwar d an d do wnward trends and rap i d o scil lat i ons. There are also s i g nifica nt diff ere nces in the GSR sig n a l pat h f o r t h ese two subj ect s. We wa n t to de ter mi ne what featur es of t h e GSR si g nal w ill pred i ct perf o r m a n ce i n t he hi g h st r es s ro u nd. T he G SR s i g na l is ver y h ig h d ime ns io na l, w it h o ver 1 0 ,000 sam p l ed val ues per subjec t . To o b tain a useful char act erizat i o n the GSR si gnal f o r each user, we reduce d t he f u l l h ig h d im e n s io na l s i g n a l t o a s e t o f lo w d im e n s io n a l fe a t u r es. O ne o f t he featu re is d rif t whi c h i s defi ned as th e abso l ut e change in t he GSR s ig na l f r o m t h e be g i nning to the en d o f a s in g le r o u nd in t he e xpe r i me nt . D rif t measures any sl o w variat i o n s in t h e GSR s i g n al o v er t he cour se of a round. Ano t her featur e i s the max imum i ncre ase w h ic h is t he a bso l ut e d iffer en ce in t he GS R s ig n a l betwee n i t s min i mu m po int in t he ro u nd t o t he e nd o f t h e r o und . Maximu m i n crease measur es any tr end in the GSR s i g n a l t hat i s p re se nt at t he end o f t he ro und . We co n s ide r ed ot her f eat ures as well , but no ne o f t he m pr o ved s ig n ific a nt . D et ails ca n be fou nd in S up p le me nt a r y Mat e r i a ls. Classif ying p e rfo rman ce Our predi ct i o n task i s to di st in guish between subject s w ho perf o rm well in t h e hi gh stress r o und fro m t ho se w ho do no t usi n g data fro m t h e cal ibrat i o n a n d l ow st ress ro un ds. T h is requ i res us to assi gn a binar y label t o each subject in dicat ing if he is a goo d or b ad p e r fo r me r i n t he h i g h st r e ss r o u nd . As a s imp le la bel in g sc he me, we sa y a subject is a good perf orm e r if his per f o rma n ce metr i c is st rict ly a b ove t h e m ed ian v alue f or al l subject s, otherw i se the subject is a bad p erf orm e r. W e use the m ed ian per f o rma n ce metr i c as a t h resho l d b e cause i t i s ro b ust to o u tliers who have extr em e values o f the metr i c. We c h ecked t h e ro bus t nes s o f o ur fi nd in gs w i t h re s pect to the cl a ssifi cat i o n t hr es ho ld a nd w e a ls o f o un d s i milar s i g nifica nce resu l t s f or reg ressi o n mode l s f or co nt inuo u s ear nings (see Su pp le me nt a ry M at er ia l fo r d et ails) . To g ai n a b ett er underst an ding of our data, we show a scatt e r pl ot o f t h e goo d and b ad perfor m ers i n a two dimensi o nal feat ure space in Fi gure 5 . W e use t h e f eatu res drif t an d maximu m i ncrease b ecau se these set of f e atur es l ead to a goo d separati o n o f t he go od and bad per f o r m ers. I n t h e scatt er pl o t the goo d an d bad perfor m ers are in dicat ed wi t h d i fferent sh aped markers. We see t hat each ty pe of perfor m er o ccup ie s a separate regi o n 5 o f t hi s featur e space. The bad perf o rm er s have a sm a ller m a ximum increase a nd a l ar ger d r i ft . It is not clear wh y t he f eat ures we hav e used in Figure 5 are ef fect iv e at separat in g t h e good an d ba d perf or m ers. From t h e fi gure, i t can be see n t h at the b ad per f o rmers t yp i c a l l y ha ve a l ow maximu m increase a n d a drif t that i s n ear zer o o r ne ga t ive in t he ca lib r at io n ro und . T his m ea ns t ha t du r ing t he ca libr a t io n ro u nd t he GS R s i gn al doe s n ot increa se very m uc h . I f we f o ll o w t heories which suggest that increases in GSR in dicat e an increa se in str ess o r co gni tive l o ad , t he n t he b ad per f o r m er s are not suffering ver y much str es s or c ognit i v e load i n the c alibrat i o n round. In c ontrast, t h e g ood perform ers have a l arge maximu m increase r el at iv e to t h e ir dr i f t . Thes e su bj ect s are experiencing a higher l eve l o f st ress o r cognit i ve l o ad . O ne po s s i ble e xp la n at i o n is t ha t t he ba d perf or m ers do not get them selves f o cus ed in t he a bs e nce o f a ny st re ss, a nd t he n w he n t he st ress i s added, t h ey are n ot abl e to perfor m we ll . T h e goo d perfor m er s, on the ot h er ha nd, a re get t ing t he m s e lv es m e nt a lly focu sed nat urally w i t hout an y add i t i ona l str ess. Then, whe n the exter n al stress i s added, the y are not affect ed by i t bec ause they h av e alread y pr epared thems e l ve s m ent ally. This i s on l y o ne po ssible ex p l an ati o n f o r what we o bse r ve a nd t her e ma y be o t he r e xp la nat io ns. Ho we ver , we do not fo cu s o n t he m because o ur goal is not to exp l ain the re l at ionship bet ween GSR a n d per f o rmance, b ut rat her to pr edi ct who will per f o rm well u n der st ress. There f o re, we will not di scuss t hes e exp l a nat i o n s fu rt her , but i nst ead buil d a pr edict i ve m ode l for perfor m a nce under st ress. To eva l uat e the st a tis t ical sig nificance o f these appar en t relat i o nsh i ps, we de v el o ped lo g i s t ic regr essi o n m o dels f o r t he above me d i a n h ig h s t re ss e ar n ing s la be l s ho wn in Figure 3. For t h e per for m a nce f eat ures, we considered accuracy, earning s a nd aver age answer t im e a nd fo r t he GSR f eatu res, we c onsidered d r i ft and ma x imu m incr e as e, a ll fro m bo t h ca lib r at i o n a nd l o w s t r ess ro u nds. T a b le 1 sho ws est im at ion r esu l t s for m od els w it h t hr ee d i fferent f eat ure set s: per f o rm a nce f eat ures, GSR f eatur es, and pe rf orm an ce and GSR feat ures co m bined. We co m par ed mode ls accor din g t o featur e si gnific ance and Akaike Infor m at i on Cr i t er i on (AIC) and repo r t in the tab l e t he two s t r o n gest m o dels f ro m each f eat ure set. We see t h at the m ode ls b ui l t w i t h performa n ce feat ures al o ne cont ain featu res from the ca lib rat ion ro un d o nly — no perf or m a nce features fro m the l ow st ress ro un d were f o und to b e signifi cant pr ed i ct ors o f high st ress earnings . The best p e r fo r ma n c e f eatur e mode l s co nta in onl y o n e weak ly sig nifi c ant pr edi cto r each. T h e t w o best GSR f eatu re m ode ls pai r dr if t a n d maximu m increa se f eat ures fro m t he same period. The calibrat ion per i o d m od el exhibits b ot h greater st a t i st ical s ignificance f o r both pred i ct o rs an d a l o wer AIC ( w h ic h in d ic a t e s b e t t e r mo d e l f it ) . F ina l ly, t he be st co mb ine d featu re m o de ls are t he same as t he b es t GS R f eatu re mo d e ls w it h t h e a d d it io n o f t h e calibrat ion accurac y feat ure, whi ch is no t st at ist ic a lly s ig ni fic a nt in e i t he r mo de l . Ho w ev er, t h e A IC f o r t h e combi ned m ode ls doe s imp r o ve s lig ht ly o ver t he GS R fea t u re mo d e l s. Predicti ve Power To estimate ho w m uc h o f an impro v e m ent GSR featu res o f f er o ver perf o r m a n ce f eat ures f or c l a ssifying good a nd ba d per f o r m er s, we eval uate t he p red i ct ion accurac y f o r t he six mo de ls s ho w n in T ab le 1. The predictiv e po we r of o ur m o del s is evalua t ed usi ng 6 st r at ifie d, fo u r - fo ld c r o s s - va lid at io n. T hi s t ec hnique inv o l ves s eparat in g the data i n t o f o ur separat e sets o r f o lds wi t h b ala nced numbers o f eac h out co m e c la s s i n a ll fo ld s. T he m ode l being t est ed i s fi t o n t hree of the f our f olds and predictions are g en erat ed o n t h e fo ur t h he l d- o ut fo ld . Th is fi t and pred i ct pro cess is repeat ed four t i mes, with a di f fere n t f o l d being h eld out i n o rder to gene rat e a p redicti o n for each dat a po int . T he n, w e use t he se ho l do ut p r e d ic t io n s t o d e v e lo p r eceiver o perating charact er i st ic (ROC ) cu rv e , a v isu a liz at i o n o f the t r ade - off betwee n t he t ru e pos it ive and false pos i t iv e rat es of y ou r pr e di c ti ons gi v en dif f e ren t va lu e s fo r t he d e c is io n r u le . To assess the pred i ct iv e accurac y, we calcu l at e t h e area under t he curve (AUC) . For context , an AUC o f 0. 5 indicat es that a pred i ct iv e mode l is no bet ter than rando m guessin g and the closer an AUC is to 1 .0 , t he m or e accurat e i t i s co nsidered t o be. We generat e d 500 di fferen t p e r m u ta ti on s of s tra ti fi ed fo ld s to ev aluate the resu l ts ’ sensi t ivi t y to the da ta spli t s a nd r an t h e above t echniques on each o ne . Fi gur e 5 s ho ws b ox pl ots f or th e di s tri b uti on of A UC s f or e ac h m od el ov er th e 500 p e r mu t a t io n s . N ote fro m t he figure, per f o r man ce f eat ure m od els per f o rm no bett er t h an random guess i ng ( AUC = 0.5 ) whereas the GSR f eat ur e m o de l s achie v e a media n AU C o f 0. 76. It i s als o wor th n ot i n g t h at the com bi ned fea t ure m o dels do not appea r to achieve hig h er accur acy t h an the GSR f eat ure m o de l s, suggest i ng t ha t pe rf orm an ce featu res pro vi de ver y li t t l e if any pred i ct ive infor mation not al read y conta in ed in the GS R featu res f or o ur da ta . Disc ussion Our resul t s dem onst rate t h at G S R s ig n a l c a n b e us ed to predi ct t h e perf or m a nce o n co gni t iv e tasks in hig h str ess c on di t i on s . An impo rt an t aspect o f o ur w o rk i s the f a ct t h at t h e GSR s i g nal used f or predict i o n is obtained under ca li brat i o n an d low st ress c on di ti on s . Therefore it is tr uly pred ict iv e o f per f o r m a nce under hi g h stress co ndi t i on s. We do not y et ha v e a clear ex p l a nat i on as to the mechanism of this p heno me no n , althou gh we suspect i t i s re l at ed to t h e f act that good perfor m er s will get f o cused an d menta lly pr epar ed for a t ask wi t h o u t the need f o r ad di t i o nal st ress o r p re ssure. No net he le ss , e ve n w it ho u t a cle ar exp la na t i o n fo r t he m ec ha n is m, w e are st il l a ble to accurately pred i ct the g ood an d b ad perf or m ers usin g GS R . T hi s sugges t s that by using wearable bi o se n sor s, o ne can evaluat e t he p e r fo r manc e of wo rkers un der dan gero us , hi g h r is k , high st ress con di ti ons using data fro m sa f er , l o w r isk , l o w str ess c o n d it io n s . W e ant i c ipate t hat o ur ex per im ent wi ll lead t o mo re ana lys is on t he pred i ct iv e power of GSR fo r worke r perf o rm ance und er s tress in a v ar iet y o f ot her t asks. Referen ces Anderson, K riste n Joan. 1994. "Impulsitivity, ca ffe ine, a nd task difficulty: A within - subjec ts t est of t he Y erke s - Dods on la w. " Pers onality and Indi vidu al Diff erences 813 -- 829. Ari ely, D an and G neez y, Uri an d Lo ewenst ein , Geo rg e and M azar, N ina. 2 009 . "L arge sta kes and big mis takes." Th e R eview of Econom ic S tudie s 451 -- 469. Baume iste r, R oy F. 1984. "C hoking under pre s sure: s elf - co nsci ou sness an d paradoxica l effec ts of incentiv es on skillful performance ." Journ al of person ality an d s ocial psy ch ology. Bei lo ck, Si an L and DeCaro , Mar ci S . 2007 . "From poor perf orman ce to success u nder str ess: wo rki ng m emor y, strat egy sel ectio n, and m athem atic al pr obl em 7 solvi ng under pres sure ." Jou rnal of E xperi menta l Psy cholog y: Learn in g, Me mory, an d Cogni tion . Beilock, Sian L. 200 8. "Math perf ormance in s tre ssf ul situations." Curre nt Dire cti ons in Psych ologic al Sci enc e 339 -- 3 43. Boucse in, Wolfram. 2 012. Electrode rmal acti vi ty. Springer Scienc e & Busine ss Media. Bymer, Maj . Lore n. 2012. Virtual re ality u sed to train Soldie rs in new trai nin g si mulator. August 1. ht tp:// www.a rmy.mi l /a rti cle/844 53 /. Cam erer, Co li n and Loew enstei n, Geo rg e and Pr elec, Dr azen . 200 5. "Neuroeconomics: How neuros cience can inform economics ." Journ al of ec onomi c Li terature 9 -- 64. Cha ng, H iro. 201 3. Simu lators alway s va luable i n mi litary traini ng. April 13. http:/ /www.a r my.m il/art icle/1959 9/simulator s - al ways - v aluabl e - in - military - training/. Dandy, Justine a nd Brewer, Neil and Tott man, Robin. 2001. " Self - co nsci ousness a nd performance de crements within a sporting cont ext. " T he Jou rnal of soci al psyc hology 150 -- 152. Healey , Jenn i fer, and Rosalind W. P icard. 2005. "Dete cting stres s during real - world driving task s using phys iological sens ors." Inte lli gent T ransporta tion Syste ms, IEEE T ran sacti ons on 156 - 1 66. Jung, Ca rl G usta v. 1908. " On psychophys ical rel ations of the a ss ociative e xperiment." Th e Jou rnal of Abn ormal Ps ych ology 247 -- 255. Lade r, MH an d Montagu, JD . 1962. " The psy cho - galv anic r eflex: a phar maco lo gic al stu dy o f the p erip her al mechan ism. " Journ al of n eurology, neu rosurge ry, a nd psyc hi atry. Lan ger, E ll en J and Imber , Loi s G. 1 979 . "W hen prac tice m akes im perfec t: debilitating e ffec ts of overlea rning." Jou rnal of p erson ality an d soci al psyc hology. Neis s, Rob. 1988. "Reconceptualizi ng arous al: psy chobiological state s in motor per for manc e." Psy chologi cal Bu lletin 345. No urbak hsh, N., Wang , Y., Ch en, F., & Cal vo, R. A. 201 2. "Usin g galvan ic skin resp onse for cognitive load measurement in a rithmetic a nd reading tas ks ." Proc eedi ngs of th e 24th Austra lian C ompute r - H uman I nteraction Co nference 420 - 423. Pic ard, Roalin d. 199 7. A ffect iv e com putin g. MI T pr ess . Setz , C., Arnri ch, B ., Schu mm, J., La Marca, R. , Tr oster, G ., & Ehl ert, U. 20 10. "Discriminating s tress from cognitive load usin g a we arable EDA device." Inf ormati on Te chn ology i n Biome dicin e, IEEE T ransac tions on 410 -- 417. Yer ke s, R . and Dodson J. 1908. "The relation of stre ngth of stimulus to rapidity of habi t - formation." Journ al of c omparative neu rology and psyc hology 459 -- 482. Zhai , J., Barret o, A. B., Ch in, C., & Li, C. 20 05. " Zhai, Jing, et al. "Re aliz ation o f stress det ecti on u s ing psychophys iological signa ls for impr ovement of human - computer intera ctions." South eastC on, 200 5. Pro ce edi ngs. IEEE 415 -- 420. 8 Fig ur e 1. ( a) A sc r een shot o f the computer in terface used for the e xper im en t. (b) T he N eu l o g GSR s ens or u sed f or th e ex p eri me nt. (c) T h e sequence of stage s in the expe r ime nt, beginni ng on the left wi th a res t stage fo r the subje ct and e nding on the r igh t with a h igh stre ss stag e . 9 Fi gur e 2. Sc atter p lots of the perf orma nce m etric s in d iff e rent rounds : (a) ca lib rati on earni ngs verus high stress e arnings, (b) low stre ss earnings ver sus high str ess earn ings, (c) c alib r ation a ccur acy versu s high stress accuracy, and (d) low stre ss accuracy versus h igh stress accuracy. The c orrela tio n coe ffici ent for ea ch p ai r of m etrics plotted i s not s ig nifi cant a t the f ive perc ent level . 10 F ig ur e 3 . Plo ts of the GSR sign als during the e xperiment f or the highe st and lowe st e a rning s ub ject s . T he di ff er e nt r ou nds a nd r est p er iods a r e dem a r cat ed b y t he ve r tical line s on e ach plo t. Fi g ur e 4 . S ca tt er pl ot s of subj ec ts’ calib ratio n d rift v e rsus ca lib ratio n ro u nd m axi mum i nc rease wi th diffe rent marke rs f or goo d an d b ad pe r f o r mers in t he hig h st ress r o und in t e rms of (a) ear nin gs an d (b) accu r acy. 11 Tab le 1 . Pre dic to r c o eff ic ie nts a nd AIC fo r six b es t lo gis tic re gres sio n mo de ls 12 Fi g ur e 5 . Box plo ts of mode ls AU Cs dev elope d w ith 500 permutatio n s o f stratifie d, 4 - fold cr os s - v alidat io n.
Original Paper
Loading high-quality paper...
Comments & Academic Discussion
Loading comments...
Leave a Comment